
Abstract
The ability to detect and quantify viral vector sequences from a variety of clinical sample types is crucial to performing biosafety risk assessments. Viral vector-mediated gene transfer studies are often performed in animals, and these animals must be placed under appropriate biocontainment conditions to protect the workers and environment. Data on the shedding of viral vectors from animals are limited, and the sample types are challenging for polymerase chain reaction (PCR). For this reason, we developed a quantitative PCR assay that could be used for such purpose. We designed a sequence-specific, probe-binding method for detecting adenoviral and lentiviral vector sequences. A duplex strategy was used that included a quality control sequence to be amplified in the same reaction as the viral vector. This sequence provided an internal control for normalization of noncellular sample types, such as animal excretions that inherently lack a natural control sequence. The new assay was used to establish the efficiency of reverse transcription and to detect viral genomes in stocks of whole virus particles. We identified sets of primers and probes for both adenoviral and lentiviral sequences that work well together with no interference. The average conversion rate of RNA into complementary DNA was 18.5%. The new quantitative PCR assay was efficient and specific, and it measured successfully the number of viral genomes in stocks of whole virus particles. This assay could be used to detect adenoviral and lentiviral vector sequences for biosafety and other research purposes.
Using a gene therapy approach against disease, corrective effects can be achieved by means of gene transfer to a specific target tissue. Potential expression of a transgene in a nontarget tissue (off-target effect) is a safety concern for gene therapy. Therefore, biodistribution studies represent important follow-up studies for viral vectors used in clinical trials. 1 Such studies aim at defining the spread of vectors, target organs for toxicity, and transmission into the germline. Some commonly studied organs for biodistribution are liver, spleen, kidney, heart, brain, and lungs. One of the most widely used methods to investigate biodistribution is quantitative polymerase chain reaction (qPCR), which is based on the detection of genetic material. Prior to clinical trial, these types of studies are generally conducted in animal models.2,3
Biodistribution studies have been performed for both adenoviral and lentiviral vectors in mice. Adenovirus was found to be predominantly expressed in the liver when injected through the intravenous route (IV, tail vein injection).4,5 The IV route also resulted in expression in most organs, including the lung, kidney, heart, and spleen. A study involving the distribution of the human multidrug resistance gene was evaluated using a murine colon carcinoma model, in which adenovirus was administered by bone marrow transplantation. By means of in situ hybridization and immunohistochemistry, vector-derived gene expression was found to be expressed in the lung, kidney, intestine, and bone marrow cells and not in the liver, spleen, brain, or tumor. 6
When lentivirus was injected similarly via the IV route, high levels of vector transgene expression were found in the liver, spleen, and bone marrow, while minor quantities were found in the gonad, bladder, gastrointestinal tract, brain, kidney, heart, and lung. 1 By 40 days postinjection, high levels of the transgene were still found in the bone marrow. For a lentiviral vector pseudotyped with murine envelope proteins, the expressed transgene was found predominantly in the liver, followed by spleen and heart, with lesser quantities in the heart and skeletal muscle. On the other hand, the expressed transgene from a lentiviral vector pseudotyped with a protein targeting the epidermal growth factor receptor was found predominately in the spleen rather than liver. 7 Pseudotyping of a lentiviral vector with the envelope protein of vesicular stomatitis virus showed more transgene expression in the liver cells, while pseudotyping with Mokola and Ebola virus envelope proteins was more efficient for muscle cells.8,9
Biodistribution of vector was also found to be dependent on route of administration.3,10 When adenovirus was administered to rabbits through periadventitial and intravascular routes, both routes led to systemic leakage of transgene expression in nontarget organs such as the bone marrow, liver, skeletal muscle, and testis. However, less leakage was observed with the periadventitial delivery route. 3
The dissemination of viral vector into the environment by means of excreta is referred to as shedding. It is considered a major risk factor to the environment, and therefore shedding analyses of urine and feces are performed. Shedding has been found to depend on route of administration, number of days postinfection, and dosage of initial inoculum. Three possible routes for vector virus entry into urine are through the kidney, bladder, and prostate. Biodistribution of virus to the liver and secretion of bile represent a possible route of shedding through feces. Analysis of adenoviral shedding after esophagus cancer treatment showed that 29.7% of patients were positive for shedding via feces and also 10% of patients were positive for shedding via urine, suggesting that the gastrointestinal tract can be a possible avenue for shedding. 11 Treatment of lung cancer with adenoviral vector also showed positive stool samples. 12 The IV route leading to biodistribution to kidney acts as a possible route for adenoviral vector shedding through urine. Other routes include intraprostatic and intramuscular. 10
Quantification of shedding can be performed by qPCR. Other methods include conventional PCR, transgene expression, and infectious virus titering. In the case of patients treated with viral vectors, the potential for transmission to third parties needs to be considered. In the case of animals infected with viral vectors, the potential for transmission to laboratory workers and the environment must be considered to determine the appropriate biocontainment level and workplace practices. One research study observed the presence of adenovirus and lentivirus vector in animals at the site of inoculation for up to 24 hours postinfection and no detectable vector in bedding or excreta after inoculation. 13 However, only conventional PCR was used in this study with visualization of amplicons by ultraviolet light transillumination. Furthermore, the researchers did not use an internal control. Therefore, these negative results for shedding must be viewed with caution.
One of the most important parameters for performing successful qPCR is the use of an internal control, which is sometimes spiked into the actual test sample, for checking inhibition, specificity, and sensitivity of the reaction. Reactions for qPCR are often performed in duplicate or triplicate to increase accuracy. 14 The technique of using internal controls in the same reaction tube (duplexing or multiplexing) offers the advantage of greater accuracy, but this control can also compete against the amplification, if not chosen carefully and validated.
In the present study, we developed a duplex qPCR assay for detection of adenoviral and lentiviral vectors that included a unique internal control method. For qPCR, we chose a sequence-specific, probe-binding method (Figure 1A) over a DNA-binding dye method because it is more specific (yields fewer false positives). We identified sets of primers and probes that were efficient, cooperative, and universal for adenovirus and lentiviral vector sequences regardless of transgene.
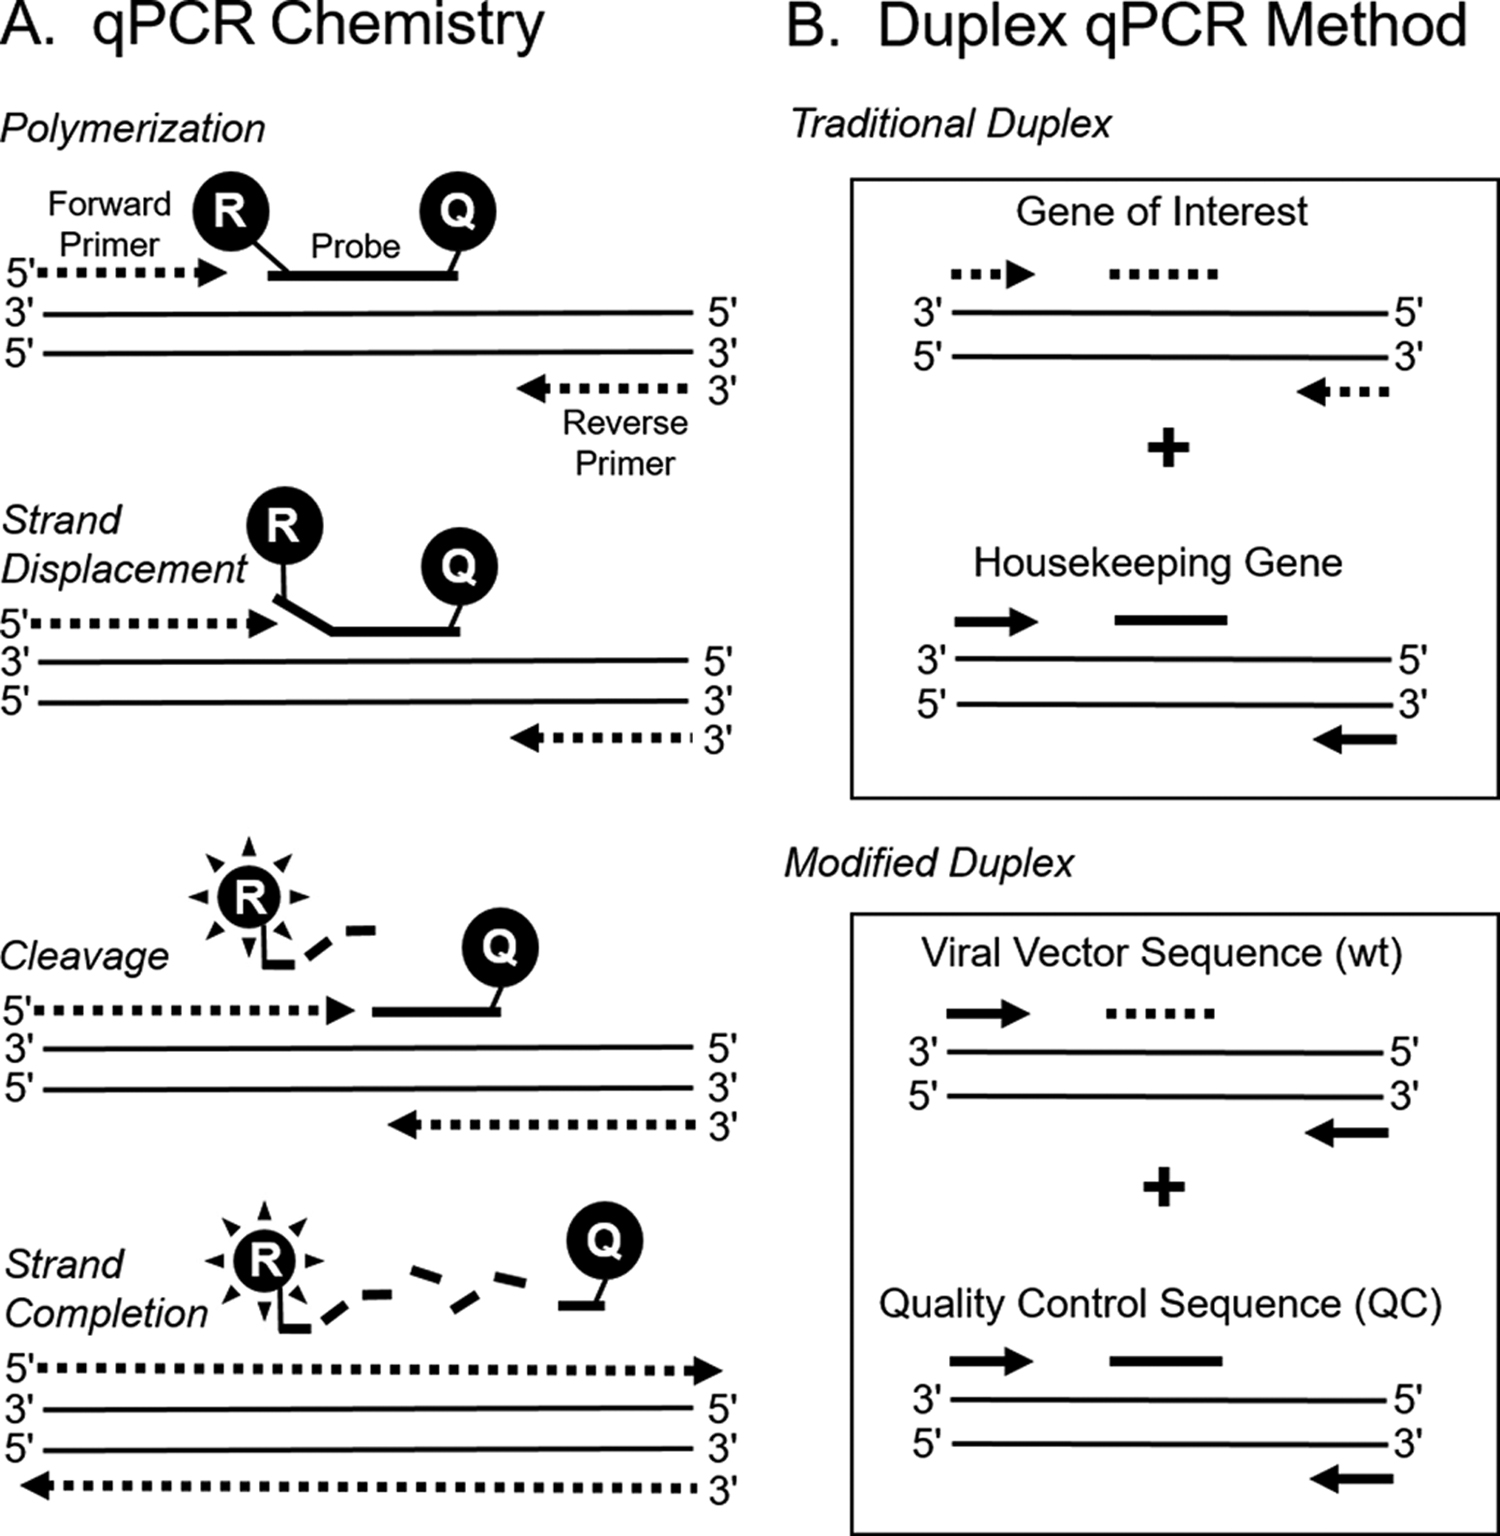
Quantitative polymerase chain reaction (qPCR) strategy for detecting viral vector sequences. (A) Sequence-specific, probe-binding method of qPCR. This method relies on a forward and a reverse primer with a probe in between. The probe has a fluorophore attached to the 5′ end of the molecule and a quencher attached to the 3′ end. During polymerization, the probe is displaced, and the 5′ to 3′ exonuclease activity of the polymerase enzyme cleaves the fluorophore from the probe, allowing it to emit fluorescence that can be quantified during the exponential phase of the reaction. (B) Duplex qPCR method. In a traditional duplex method, different sets of primers and probes are used to amplify a target and an internal control sequence, which is usually a cellular housekeeping gene for normalization. In the modified duplex method, the same set of primers is used for amplification, but the probe sequence is different to distinguish between a target and control sequence.
Materials and Methods
Viral Vector Systems
The AdEasy XL Adenoviral Vector system (catalog no. 240010) was used to construct the adenoviral vector expressing the lacZ gene (Figure 2A), and the AD-293 cells (catalog no. 240085) were used for production of viral particles, which were purified using the AdEasy Virus Purification Kit (catalog no. 240243). These adenoviral products were purchased from Agilent Technologies (Santa Clara, California). The manufacturer’s protocols were followed for all phases of production as outlined in their instruction manuals.15,16 The adenovirus stock was quantified by a standard plaque assay on AD-293 cells. Adenovirus particles were lysed with 5 μg proteinase K (catalog no. 31158887; Roche Diagnostics, Indianapolis, Indiana) for 30 minutes at 37°C with a heat inactivation step at 95°C for 20 minutes prior to qPCR amplification of adenovirus genomic DNA.
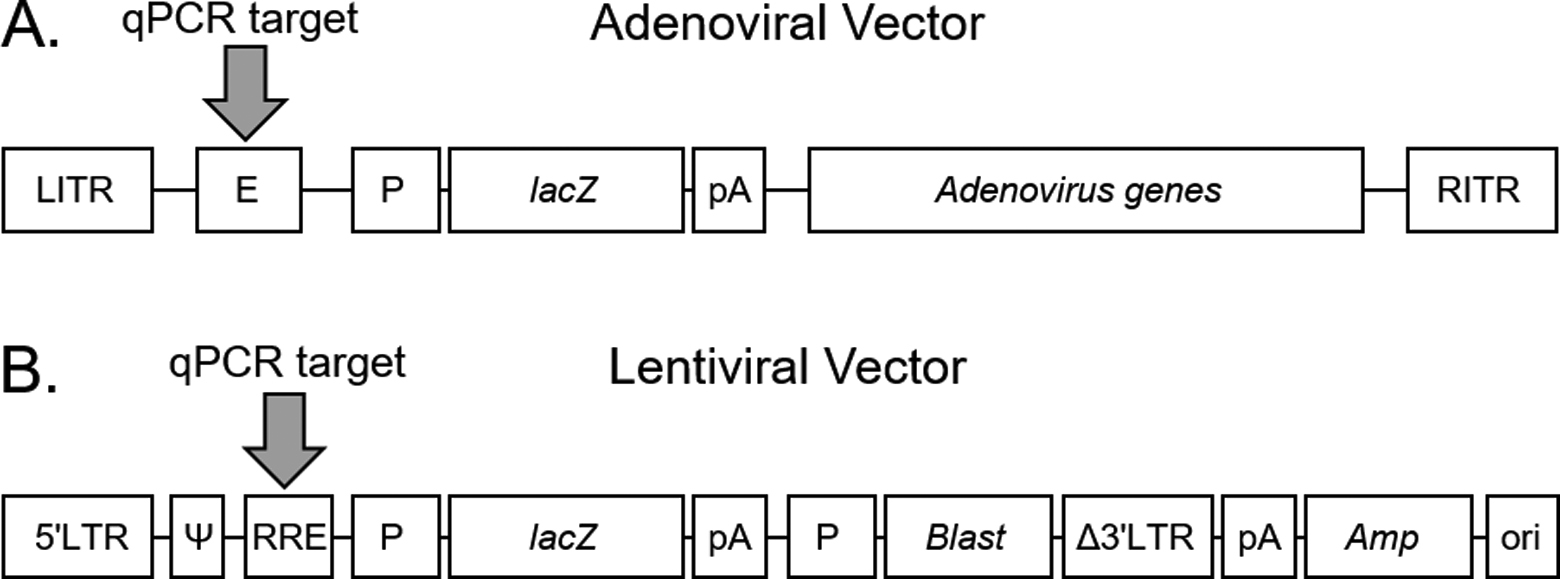
Viral vector layout. (A) Adenoviral vector. (B) Lentiviral vector. The gray arrow shows the target region for quantitative polymerase chain reaction (qPCR) detection. Amp, gene for resistance to ampicillin; Blast, gene for resistance to blasticidin S HCl antibiotic; E, encapsidation sequence; lacZ, β-galactosidase gene; LITR, left inverted terminal repeat; ori, origin of replication; P, promoter; pA, polyadenylation signal; RITR, right inverted terminal repeat; RRE, Rev-responsive element; Δ3′LTR, 3′ long terminal repeat containing deletion; 5′LTR, 5′ long terminal repeat; ψ, packaging sequence.
The pLenti 6.3/V-5 DEST system (catalog no. K5330-00) was used for the production of the lentiviral vector expressing the lacZ gene (Figure 2B), and the 293FT cells (catalog no. 51-0035) were used for the production of viral particles. The lentiviral products were purchased from Invitrogen (Carlsbad, California). The manufacturer’s protocols were followed for all phases of production as outlined in their instruction manuals.17,18 The lentiviral stock was quantified by a colony-forming unit assay on HT-1080 cells (catalog no. CCL-121; American Type Culture Collection, Manassas, Virginia) in the presence of Transdux reagent 19 (System Biosciences, Mountain View, California) using drug selection with Blasticidin S HCl (catalog no. A11139-03; Invitrogen). Lentivirus was purified and concentrated using the PEG-it Virus Precipitation Solution (catalog no. LV810A-1; Systems Biosciences) according to the manufacturer’s instructions. 20 Lentivirus was lysed with Igepal CA-630 detergent at a final concentration of 0.5% prior to reverse transcription of viral genomic RNA and qPCR amplification of the complementary DNA (cDNA).
All cell culture media and supplements were purchased from Invitrogen or ThermoFisher (Waltham, Massachusetts).
Synthetic Nucleic Acids
All DNA primers and probes for qPCR were purchased from Integrated DNA Technologies, Inc. (IDT; Coralville, Iowa).
For the adenovirus quality control (QC) template, a 184-bp synthetic fragment corresponding to nucleotides 157 to 340 of the AdEasy construct was synthesized by IDT. The AdEasy vector is based on wild-type human mastadenovirus C serotype 5 (more commonly known as human adenovirus 5 or Ad5), and the synthetic fragment corresponds to the encapsidation region of the virus. Restriction sites NcoI and PstI were engineered at the ends of the fragment to facilitate cloning into a plasmid. Specific mutations were incorporated into the probe-binding region of the QC fragment to allow differential detection in qPCR (Figure 3).
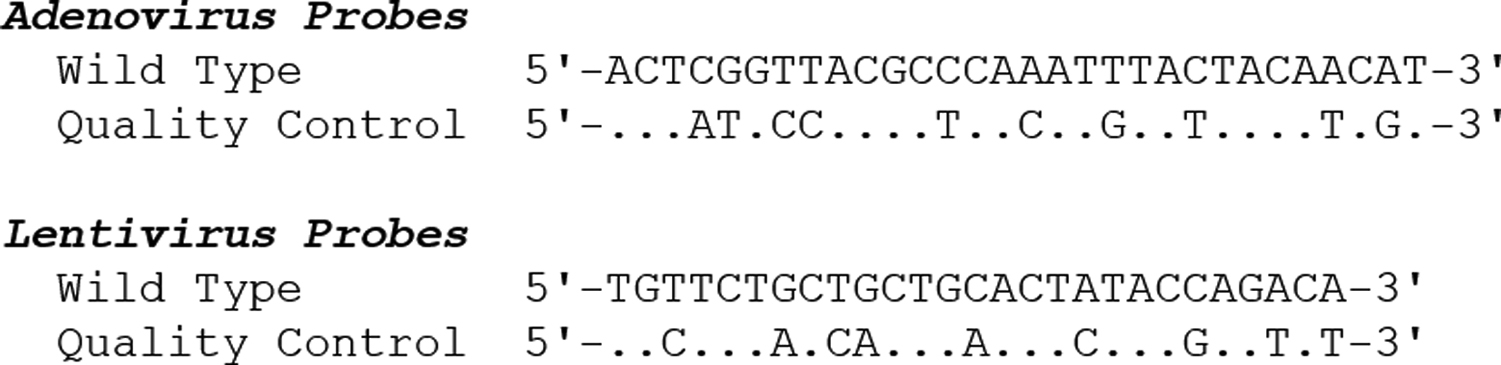
Sequence alignment of wild-type and quality control probes. The sequence alignments show differences between the wt and quality control probe sequences that were used in quantitative polymerase chain reaction. Dots represent sequence identity between the 2 probes.
For the lentivirus QC template, a 234-bp synthetic fragment corresponding to nucleotides 1075 to 1308 of the pLenti 6.3/V-5 DEST construct was synthesized by IDT. The pLenti 6.3/V-5 DEST construct is based on NL4-3 laboratory strain of human immunodeficiency virus type 1 (Genbank accession no. AF324493.2),17,21,22 and the synthetic fragment corresponds to the Rev-responsive region of the virus. Restriction sites XhoI and NotI were engineered at the ends of the fragment to facilitate cloning into a plasmid. Specific mutations were incorporated into the probe-binding region of the QC fragment to allow differential detection in qPCR (Figure 3).
Plasmids
The adenoviral QC fragment was cloned into the pIDTSMART plasmid, while the lentiviral QC fragment was cloned into pIDTBlue plasmid, a gene expression vector that allowed for the production of RNA. Both plasmids were purchased from IDT. All plasmids preparations were performed using the QIAGEN (Germantown, Maryland) Plasmid Maxi Kit according to the manufacturer’s instructions. 23
RNA Isolation
The lentiviral QC RNA fragment was produced using the RiboMAX Large Scale RNA Production System T7 (Promega, Madison, Wisconsin) according to the manufacturer’s instructions. 24 The pIDTBlue vector DNA containing the lentiviral QC sequence was extracted with a phenol/chloroform mixture to enhance cutting with NotI (New England Biolabs, Ipswich, Massachusetts). The restricted DNA was separated from uncut DNA by overnight gel electrophoresis using constant amperage of 30 mA, 1.5% agarose gel, and Tris–boric acid–EDTA buffer. The desired linearized plasmid of 3139 bp was excised from the gel and purified using the QIAquick extraction kit (QIAGEN). The in vitro transcription reaction was performed using the gel-purified plasmid DNA, T7 polymerase, and other RiboMAX reagents at 37°C for 4 hours. To remove input DNA, RNase-free DNase was added at a concentration of 1 unit per microgram of input DNA and incubated at 37°C for 15 minutes. The RNA was purified using the SV RNA Isolation System (Promega) following the manufacturer’s instructions. 25 The purified RNA was analyzed for size, purity, and concentration by electrophoresis on a 1% native agarose gel using Tris-acetic acid, EDTA buffer (Figure 4). The RNA was further quantified by UV spectrometry, aliquoted, and stored at –70°C.
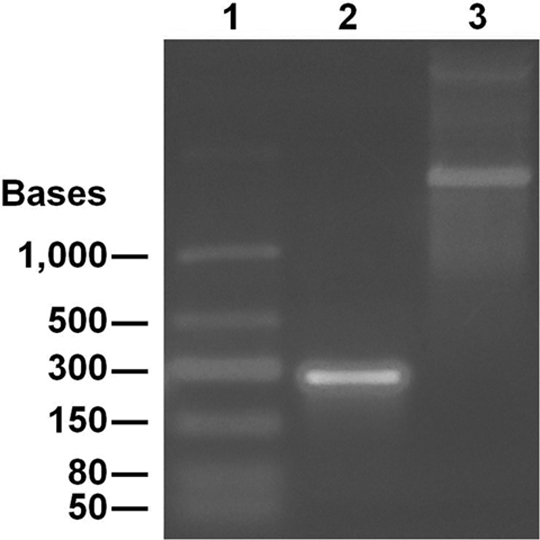
Purified RNA template of the lentivirus quality control sequence. Lane 1 = low-range ss RNA ladder; lane 2 = purified quality control RNA; lane 3 = transcriptional control (1800 bases).
Quantitative Polymerase Chain Reaction
The qPCR reactions were performed on an ABI Prism 7900 HT (Applied Biosystems, Carlsbad, California) sequence detection system under the following reaction conditions: 1 cycle at 50°C for 2 minutes, 1 cycle at 95°C for 10 minutes, and 40 cycles at 95°C for 15 seconds and 60°C for 60 seconds. A set of DNA standards was produced by performing 10-fold serial dilutions of DNA in the range of 102 to 106 molecules per qPCR reaction. The standards were created by diluting the wild-type (wt) and QC plasmid DNAs for both the adenovirus and lentivirus vectors. The dilution buffer was 10 mM Tris, 1 mM EDTA, pH 7.5. The final qPCR reaction volume was 20 μL and contained the proprietary TaqMan mix (Applied Biosystems), which provided all of the necessary reagents for amplification. Primers were used at concentrations of 18 μM and probes were used at concentrations of 2.5 μM. The efficiency of qPCR was calculated by using the following formula: Efficiency = –1 + 10(–1/slope).
Reverse Transcription
The RNA was converted to cDNA using the High Capacity cDNA Reverse Transcription kit (catalog no. 4368814; ThermoFisher Scientific) in accordance with the manufacturer’s instructions. 26 Serial 10-fold dilutions of the RNA were made such that there was a range of 1 to 106 molecules per cDNA reaction. The reaction conditions were 10 minutes at 25°C, 120 minutes at 37°C, 5 minutes at 85°C, and indefinitely at 4°C. This cDNA was used in qPCR to determine the reverse transcription efficiency.
p24 Assay
The p24 assay was performed using the Retrotek HIV-1 p24 Antigen ELISA kit (catalog no. 0801111; Zeptometrix Corporation, Buffalo, New York) by following the manufacturer’s protocol. 27
Computer Software
The primers and probes were designed with the assistance of MacVector software 11.1.2 (Apex, North Carolina). The graphs and statistical analyses for qPCR were performed using SigmaPlot 11.2 software (Systat Software, San Jose, California) and Excel 2016 (Microsoft, Redmond, Washington).
Results
Design of Duplex qPCR Assay for Universal Detection of Adenoviral and Lentiviral Sequences
A first-generation adenoviral system and a third-generation lentiviral system were used for assay development because they are most commonly used in research and gene therapy and thus often encountered in biosafety risk assessments. The adenoviral system comprised a vector that contained deletions in the first and third early region genes (E1- and E3-deleted; Figure 2A) and a helper cell line that expressed E1 genes. The lentiviral system consisted of a vector that contained deletions of all trans-acting sequences (Figure 2B) and a third-generation packaging system that expressed essential genes for virus production. 28
The qPCR primers were designed to bind sequences found universally on all adenoviral and lentiviral vectors, regardless of generation or transgene; they are required cis-acting sequences (Table 1). For the adenoviral system, primers were designed to bind the encapsidation signal (Figure 2A) and create a 116-bp amplicon, while for the lentiviral system, primers were designed to bind sequences in the Rev-responsive element (Figure 2B) and create a 111-bp amplicon.
Sequences of Primers and Probes for Quantitative Polymerase Chain Reaction.
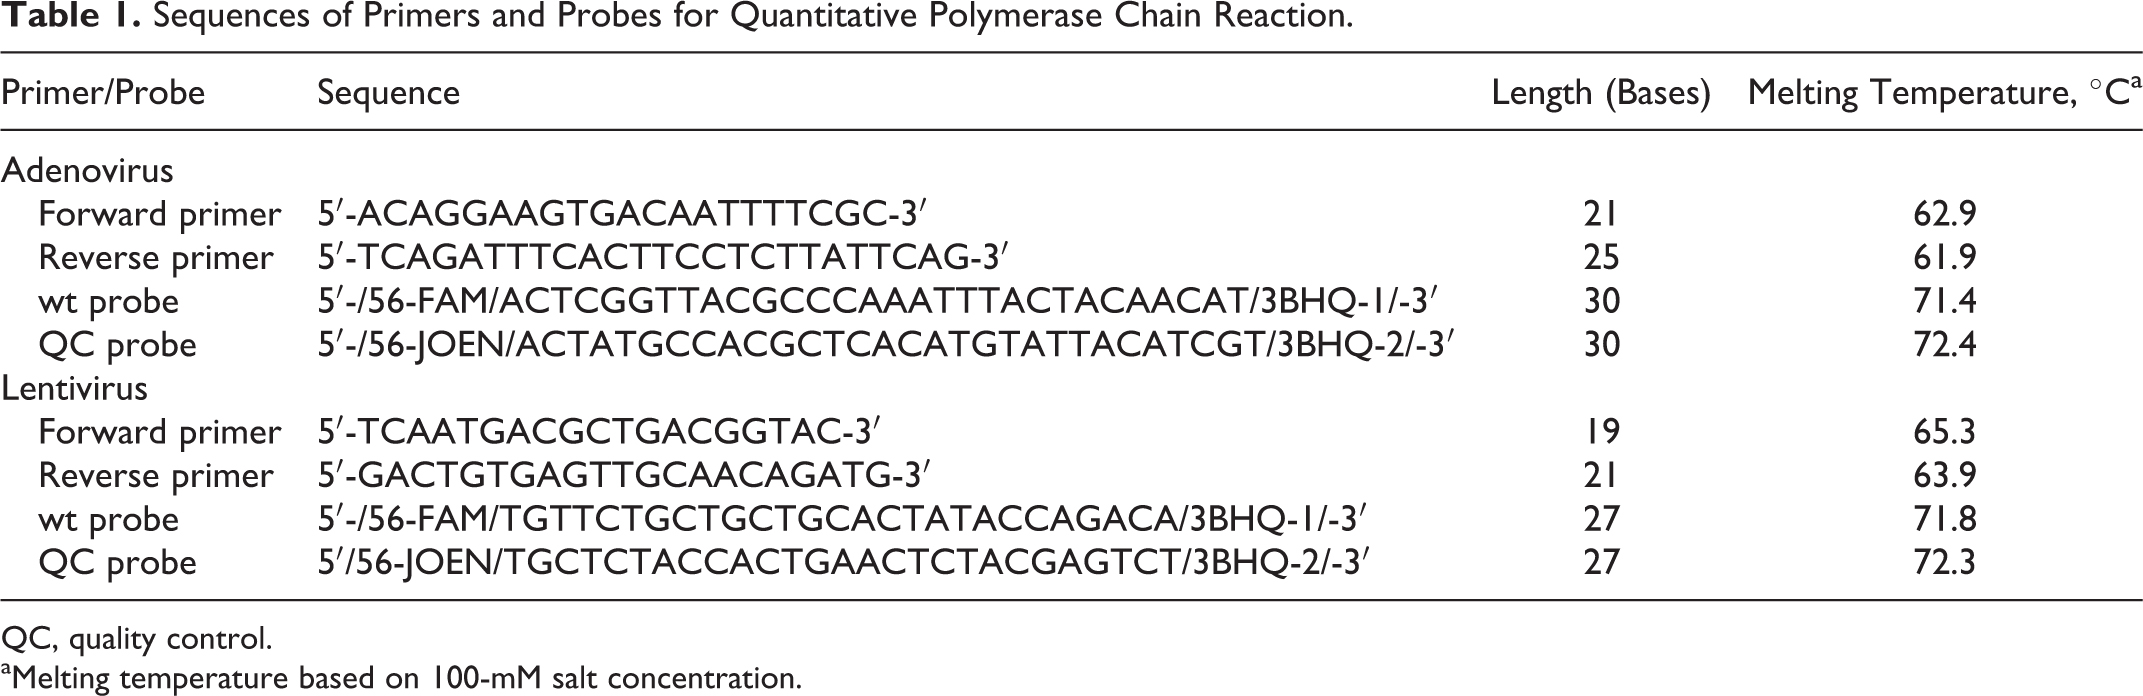
QC, quality control.
Melting temperature based on 100-mM salt concentration.
Our duplex design differed from that of other designs by using the same set of primers to amplify 2 different target sequences and a unique probe sequence to distinguish between the 2 targets. Traditional duplex designs use different primers and probes to distinguish between 2 target sequences (Figure 1B).
We chose reporter molecules with nonoverlapping emission spectra because we were amplifying 2 different target sequences in the same reaction. One reporter was 6-FAM (blue spectrum) and the other reporter was JOE (green spectrum). Quenchers were selected to absorb energy in the appropriate emission ranges (BHQ-1 and BHQ-2, respectively) (Table 2). Computer software was used to design primer sequences to help ensure uniqueness and absence of dimers, hairpins, and self-duplexes. The probes were designed to have a higher melting temperature than the primers to ensure that they would bind first to the target to avoid amplification without probe (Table 1).
Reporter Molecules for Quantitative Polymerase Chain Reaction.
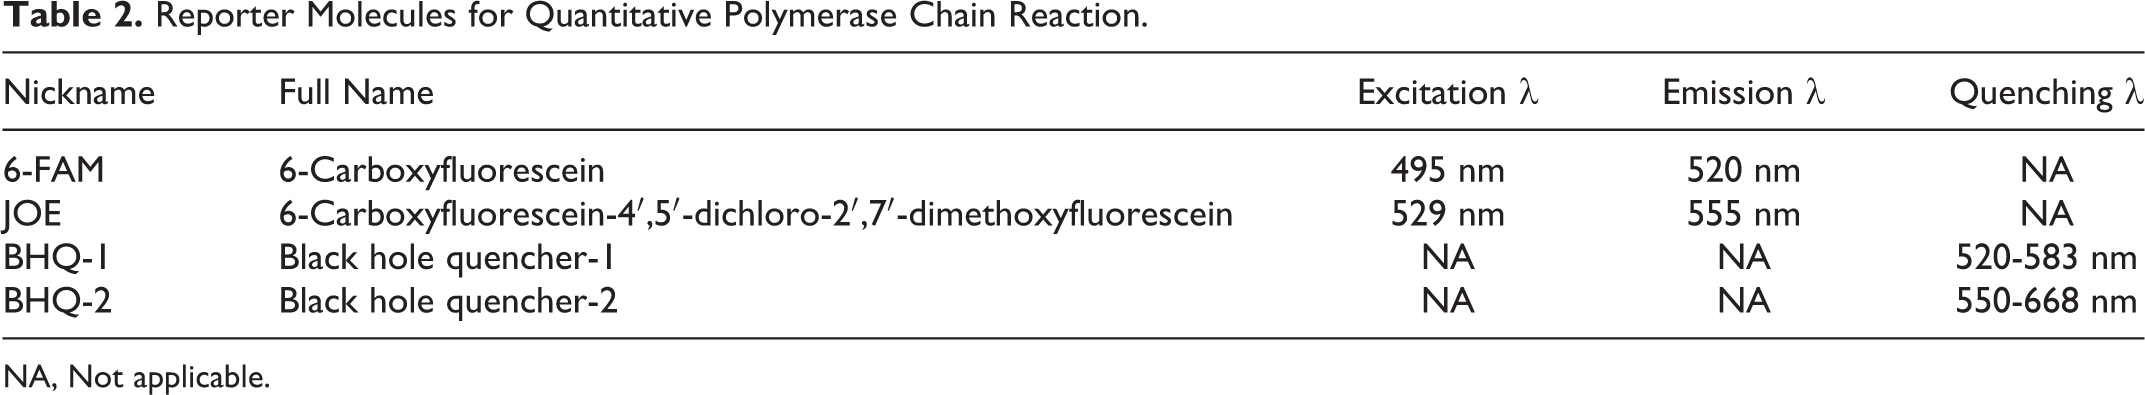
NA, Not applicable.
Generation of Quality Control Templates
Since our assay was designed to detect viral vector sequences in animal excretions such as urine, housekeeping genes for normalization would not be present as they would be in cellular samples. Therefore, we designed and produced QC templates to serve as internal controls for normalization, with the intention that these controls would be spiked into samples at early processing time points during future in vivo testing. The QC sequences were designed to be identical to the wt viral sequences with the exception that the probe-binding regions were different; there were 10 sequence differences in the adenoviral probe and 9 differences in the lentiviral probe (Figure 3). This design enabled us to use the same set of primers and a unique probe for selectively amplifying either the wt or QC sequence (Figure 1B). The sequence changes engineered into the probe areas were designed to have minimal impact on the efficiency of the amplification (ie, similar nucleotide composition and melting temperatures).
The QC sequences were cloned into different plasmids, one for each viral system, and after large-scale production, the plasmids were diluted serially for use as standards alongside wt controls. Since the lentivirus genome is an RNA molecule, the QC template for the lentivirus was cloned into a plasmid that could also serve as an expression vector for isolation of QC RNA, which could then be used as an internal control in this form (Figure 4).
Assay Validation
We evaluated the primer sets by performing 10-fold serial dilutions of wt and QC sequences over a range of 5 orders of magnitude. The coefficient of correlation (R 2 value) was determined, and the efficiency of amplification was calculated using an equation based on the slope. Slopes between –3.1 and –3.6 with efficiencies of reactions between 90% and 110% and with R 2 values between 0.990 and 1.00 were acceptable.
Full duplex reactions were performed for both viral systems in which wt and QC sequences, primers, and probes were all placed into the same reactions and compared with the set of standards for each template. The cycle threshold (Ct) values were plotted against the dilutions of the template sequence. The Ct is the number of cycles required for the fluorescent signal to cross the established baseline level. For the adenoviral system, the efficiencies for the wt and QC sequences were 98.0% and 103.2%, respectively (Figure 5A). For the lentiviral system, the efficiencies for the wt and QC sequences were 96.7% and 92.4%, respectively (Figure 5B). These efficiencies were all within the established acceptable range of 90% to 110%.
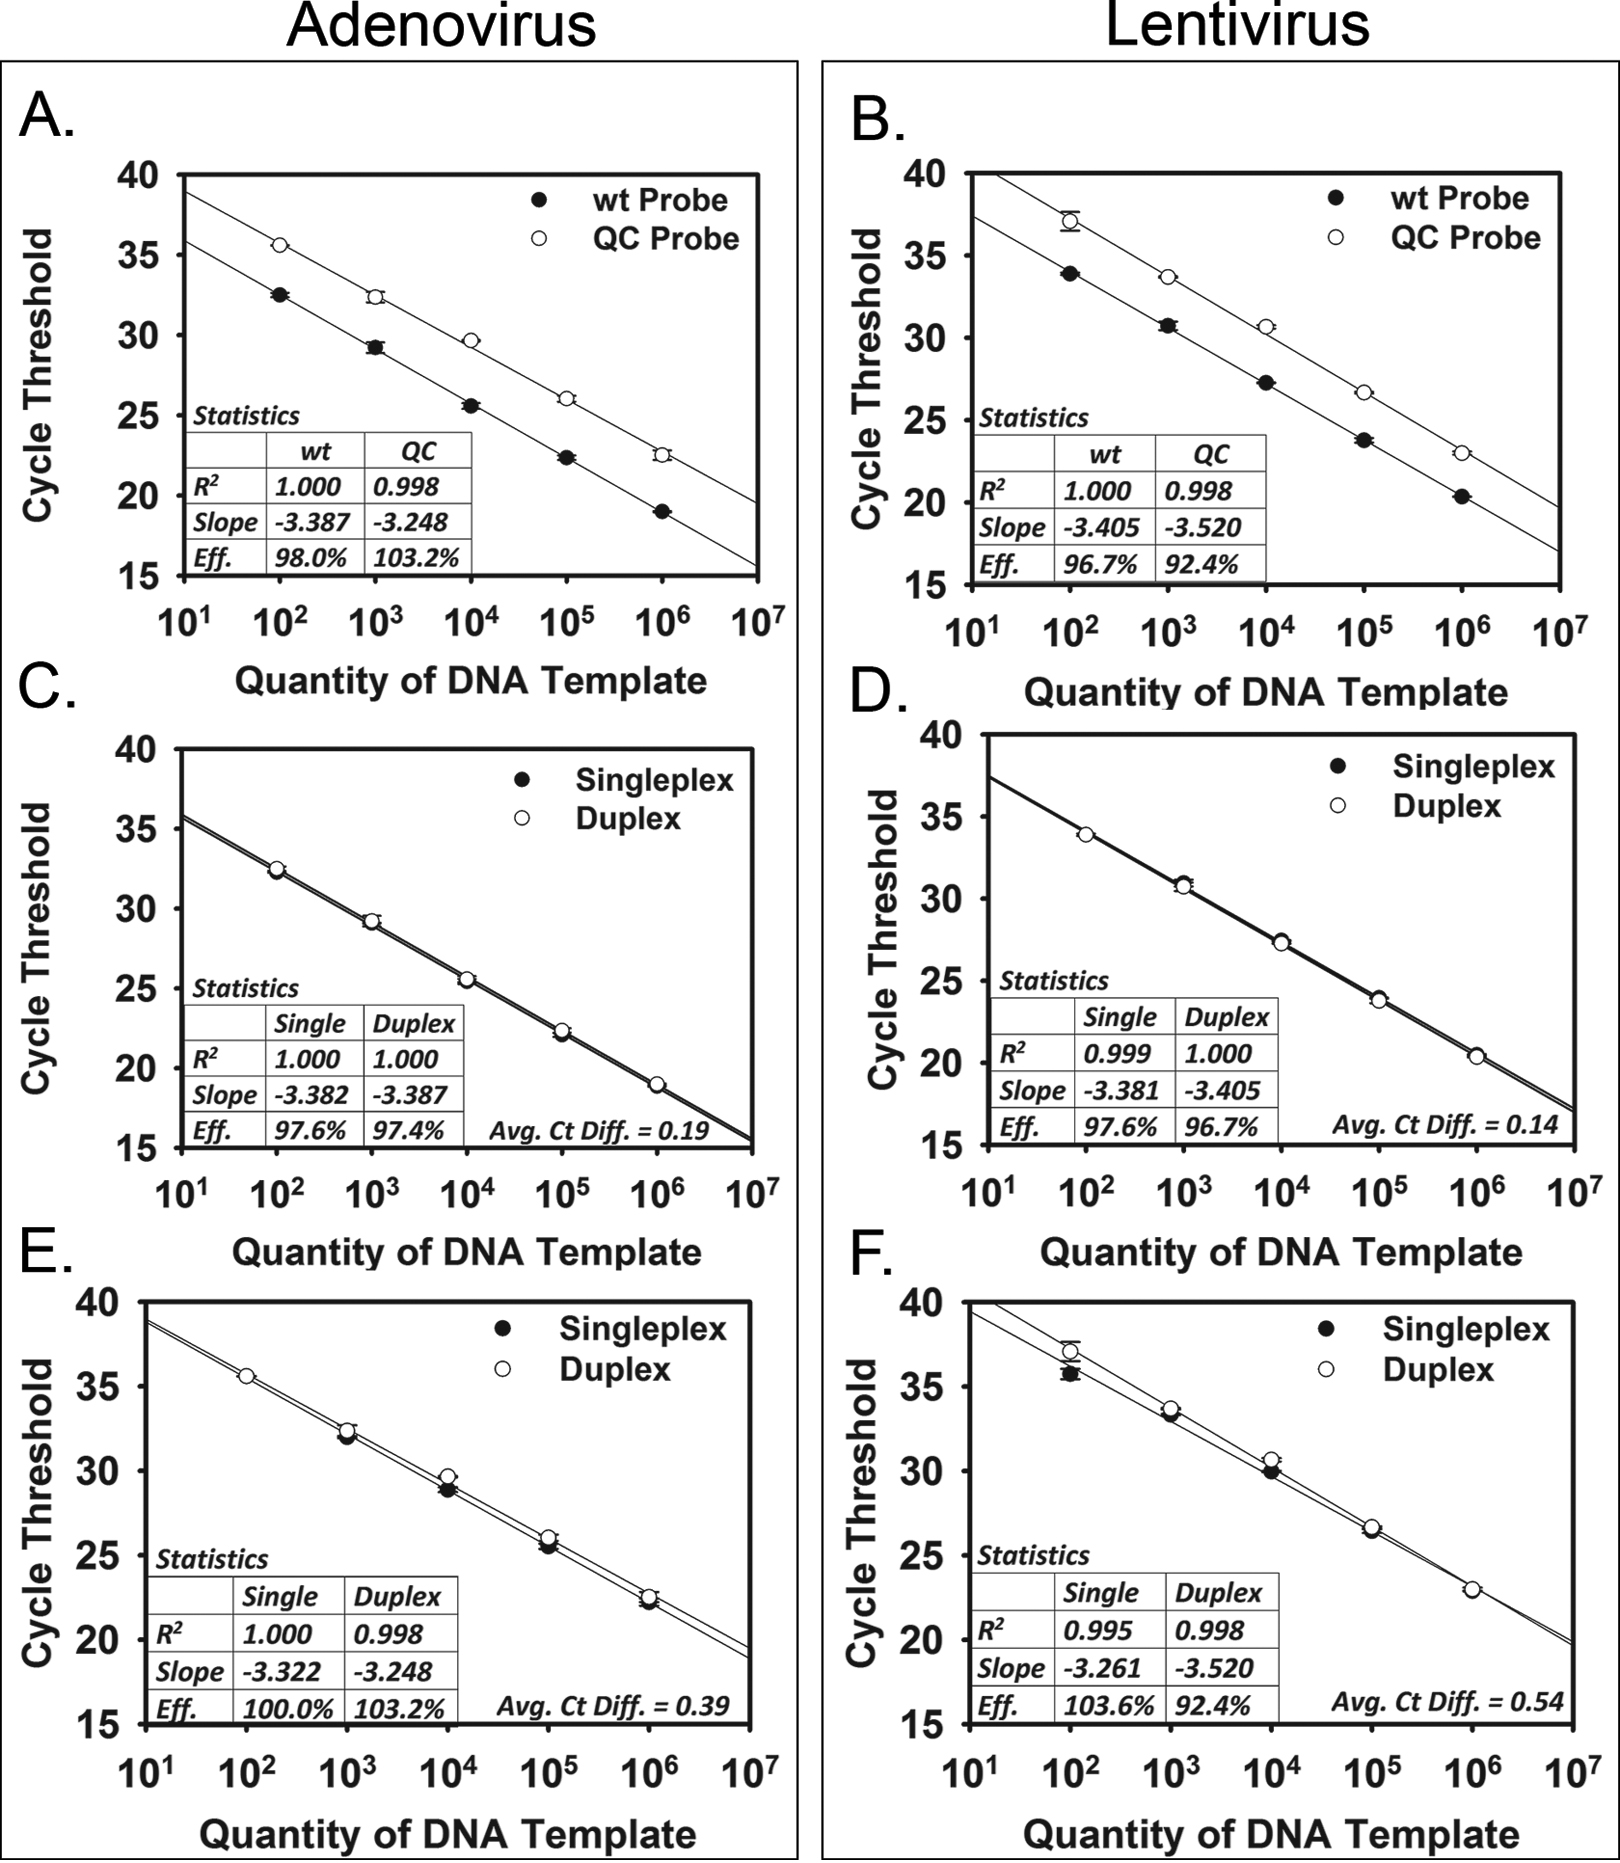
Validation of quantitative polymerase chain reaction (qPCR). Dilutions of DNA template are plotted against the cycle threshold for the qPCR reactions. Full duplex reactions for (A) adenoviral vectors and (B) lentiviral vectors are shown in the top panels. Comparison of singleplex and duplex reactions for the wt sequence for (C) adenoviral vectors and (D) lentiviral vectors is shown in the middle panels. Comparison of singleplex and duplex reactions for the quality control (QC) sequence for (E) adenoviral vectors and (F) lentiviral vectors is shown in the bottom panels. Reaction statistics are listed in boxes in the lower left-hand corners of the graphs. For the singleplex vs duplex reactions (panels C-F), the average Ct differences are listed in the lower right-hand corners of the graphs.
To ensure that the duplex format was not altering the amplification profile for the different templates, each wt and QC sequence was amplified in both singleplex and duplex formats, and the results were compared. For the wt sequences, average Ct differences across the range of dilutions for singleplex vs duplex qPCR were 0.19 and 0.14 for the adenoviral and lentiviral systems, respectively (Figure 5C,D). For the QC sequences, average Ct differences across the range of dilutions for singleplex vs duplex qPCR were 0.39 and 0.54 for the adenoviral and lentiviral systems, respectively (Figure 5E,F). The efficiencies of amplification were all within the established acceptable range of 90% to 110%. Based on the observation that average Ct differences were all less than 1 Ct, we can conclude that the presence of the second template and probe in duplex qPCR did not alter the amplification profile; there was no interference or inhibition of amplification due to the presence of the other sequence in the same reaction.
The specificity of the probes was checked by amplifying wt DNA with the QC probe and conversely amplifying the QC DNA with the wt probe in separate reactions. There was no amplification in either case, thus confirming the specificity of the primers and probes (data not shown).
The sensitivities of the assays were further checked by performing qPCR with primers and probes for both sequences but with only 1 template (wt or QC) to ensure that the probes were not inhibiting each other. Results were compared with standard curves and showed amplification profiles identical to reactions conducted in the absence of the second probe for both adenoviral and lentiviral systems (Figure 5C-F). Thus, there was no interference between the probes.
Conversion Rate of Lentiviral RNA Into DNA
To establish the proportion of lentiviral RNA genomes converted into DNA, we performed 10-fold serial dilutions of QC lentiviral RNA and reverse transcriptase reactions on aliquots from each dilution. The cDNAs produced in this manner were subsequently amplified in singleplex qPCR and compared with QC DNA standards (Figure 6A). The efficiencies of amplification were all within the established acceptable range of 90% to 110%. Five different experiments were performed on 5 different days at 5 different dilutions of input RNA molecules (n = 25), and the efficiency of reverse transcription was found to range from 4% to 52% across all dilutions (mean = 18.5%, SD = 15.3) (Figure 6B).
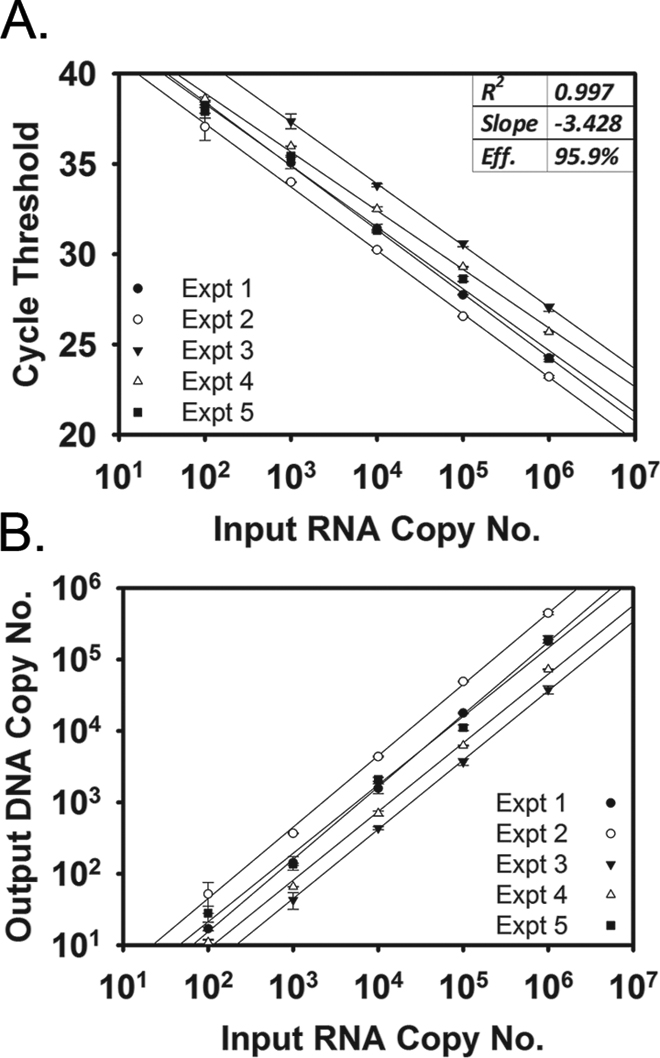
Efficiency of reverse transcription for lentivirus template. Dilutions of the quality control RNA template were plotted against (A) cycle threshold and (B) output DNA copy number. Each of 5 experiments is indicated by a different symbol on the graph. Statistics for the amplification reaction are shown in the upper right-hand corner of panel A. The output copy number represents the number of RNA molecules that were converted to complementary DNA.
Quantitation of Whole Viral Particles
The duplex qPCR assay was tested on whole virus particles by performing 10-fold serial dilutions of virus stocks, which were lysed to release viral genomes. The qPCR was carried out as described above. For the adenovirus stocks, the total genome counts were 12- and 5-fold higher than the infectious titer, whereas for the lentivirus stock, the total genome count was 30,000-fold higher than the infectious titer (Table 3). For the lentivirus stock, a p24 enzyme-linked adsorbent assay indicated a total virus genome count of 2.7 × 10¹¹ per milliliter, which agreed with the quantity obtained by qPCR, further validating the assay.
Quantification of Whole Virus Particles.
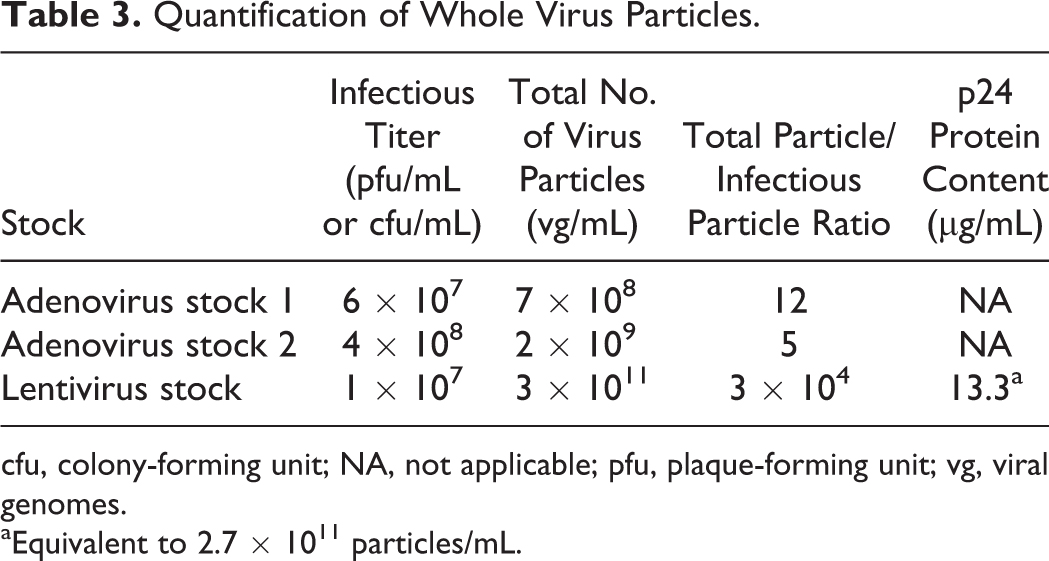
cfu, colony-forming unit; NA, not applicable; pfu, plaque-forming unit; vg, viral genomes.
Equivalent to 2.7 × 10¹¹ particles/mL.
Discussion
The use of viral vectors for gene transfer has been studied widely. Viral vectors used in clinical trials or infected animals have been found to distribute to nontarget organs, followed by shedding.29 -32 Although viral vectors are generally replication deficient, the potential risk of recombinant viruses entering the environment or exposing unintended persons needs to be assessed for proper biocontainment. Studies on shedding of vector viruses from experimentally infected animals are lacking in the scientific literature.
The use of real-time PCR for quantification of nucleic acids is an essential, powerful technique used in a wide range of analyses. Real-time PCR measures the amount of DNA produced in the exponential phase of amplification. In contrast, conventional PCR shows only the end product of amplification, frequently in the plateau phase of amplification.
For the qPCR assay in the current study, primers and probes were designed to amplify and detect the encapsidation region of human adenovirus type 5 and the Rev-responsive element (RRE) region of HIV-1. Because all generations of adenoviral and lentiviral vectors to date retain these regions, the primers and probes designed here can be used universally regardless of transgene, assuming the serotype or strain is similar.
The standard curves for wt and QC sequences were generated using a dynamic range of 5 logs (102 to 106). The upper limit of this range was chosen based on the observation that Ct values were approaching the baseline Ct range (generally between cycles 3 and 15). The lower limit of the dynamic range was chosen based on the observation that Ct values for the 102 standard were less than or equal to 37. Values of Ct between 37 and 40 were defined as the equivocal range for this study. When limiting dilutions of DNA and RNA molecules for the adenoviral and lentiviral systems were performed and measured by qPCR, quantities below 10 (in the 37 to 40 Ct range) could be detected by extrapolation from the standard curve.
A novel feature of the new assay reported here is the design of a QC sequence that can be added as an internal control into an unknown test sample. We propose that the QC sequence should be added at an early time point in the sample processing procedure to account for sample loss that will be incurred during preparation of the sample for qPCR. Many researchers spike an unknown sample immediately prior to the amplification reaction, which gives the internal control an unfair advantage (over estimation of detection limit) because the control sequence has not been subjected to the same handling steps and possibilities for degradation. This timing issue for spiking is especially important for detecting RNA viruses, such as lentivirus, because RNA is much more susceptible to nucleases in the environment compared with DNA. Other investigators have determined limits of detection for qPCR in separate reactions or in a separate medium, which is not as accurate as duplexing or multiplexing with the same medium. A recent study investigating the shedding of viral vectors from rodents established a lower limit of detection of 200 infectious units for their assay by spiking whole blood with vector virus particles. 13 However, the actual test samples in this study were urine and feces, much harsher environments for nucleic acids. For this reason, the negative results obtained in this study are uncertain, and their conclusion that viral vectors pose minimal exposure risk after 72 hours after inoculation must be interpreted with caution.
Since the QC sequence for lentivirus was an RNA molecule, it was important to establish the rate of conversion of RNA into DNA during the reverse transcriptase step. 33 In most cases, the efficiency of reverse transcription (cDNA synthesis) is well under 100% and has been reported to be highly variable. 34 In the current study, cDNA was quantified using qPCR, and the efficiency of reverse transcription was found to be 18.5% on average. Given the high variability inherent in this reaction, it is important to include a reverse transcription control in every experiment.
Other PCR assays have been reported in the literature. However, none of the reported assays suited our needs for detecting vector viruses in animal excretions, especially with regard to including an internal QC template and thus the need for a new assay. For example, 1 research group reported the use of an internal control for adenovirus vectors, but their control was against a different virus, namely, λ bacteriophage. 35 Another group used conventional PCR to report only positive or negative viral DNA in samples; quantification was not performed in this study. 11 A qPCR assay was described for adenovirus 5 that used primers and probes against sequences upstream of those described in the current study, but there was no internal control for normalization. 36 Yet another group of investigators described an assay for adenovirus that required cultivation of virus first before PCR, and it was also transgene specific. 37 One lentivirus assay was described in which qPCR was performed on total cell genomic DNA with normalization using the human TERT gene, thus only detecting integrated virus. 38
The new qPCR assay described here was tested on stocks of whole virus particles to provide further validation of the assay. The ratio of infectious to noninfectious particles was measured to assess the quality of the stocks. Noninfectious particles contribute to potentially toxic effects in a host organism and will add to the number of particles being shed from an animal. For adenovirus, the infectious titer was determined by plaque-forming unit (pfu) assay, while for lentivirus, the infectious titer was determined by colony-forming unit (cfu) assay. The new qPCR assay was used to measure the number of viral genomes (vg) in each of the stocks.
For each of 2 adenovirus stocks tested, the ratio of vg/pfu was 12:1 and 5:1 (Table 3). Similar ratios of 10:1 and 5:1 were reported for a similar adenovirus 5–based vector. 39 In general, a high-quality batch of the adenoviral vector would have a ratio less than 30:1. 40
For the lentiviral stock, the ratio of vg/cfu was 30 000:1, suggesting the presence of a large amount of defective particles. This observation agrees with previous reports showing that human immunodeficiency virus (HIV) infections are known to produce large proportions of defective viral particles that lack 1 or more viral genes.41,42 Defective interfering viruses have been long documented in the field of virology, and their presence is thought to be involved in many aspects of pathogenesis and antiviral responses.43,44 The total virus genome count for the lentivirus stock was confirmed indirectly by measuring concentrations of p24 Gag protein using an enzyme-linked immunosorbent assay. Based on a previous finding that each HIV particle contains approximately 5 × 10–17 g of p24 protein, 45 it was determined that the lentivirus stock had a vg/cfu ratio of 27 000:1, in agreement with our new qPCR assay.
In conclusion, a highly specific, sensitive, and reproducible qPCR assay to quantify adenoviral and lentiviral vector viruses was developed. The qPCR assay was based on a duplex format with a QC template spiked into the sample to serve as an internal control. The assay was validated by analyzing the efficiencies of amplification and the coefficients of correlation across a dynamic range of 5 orders of magnitude. The QC sequence allows for normalization of results for samples where cellular housekeeping genes are not available. Although this assay was designed for future testing of vector virus shedding in animal excretions, it could be used for a variety of other clinical sample types. Having a validated set of primers and probes for qPCR detection of viral vectors may assist researchers and biosafety professionals in performing risk assessments and basic research on viral vectors.
Footnotes
Declaration of Conflicting Interests
The author(s) declared no potential conflicts of interest with respect to the research, authorship, and/or publication of this article.
Funding
The author(s) disclosed receipt of the following financial support for the research, authorship, and/or publication of this article: This work was supported by a grant from The Elizabeth R. Griffin Research Foundation.