
Abstract
Objective:
To explore mechanisms of Modified Tongyou Decoction (MTD) and its separated formulas inhibiting vasculogenic mimicry (VM) in esophageal cancer (EC) TE-1 cells and improving the hypoxic environment via NF-κB/HIF-1α axis on the basis of the hypoxia stimulating the cells’ VM formation.
Methods:
The extract of MTD was prepared by water extraction and alcohol precipitation-whirl evaporation, and amygdalin, the content of the antitumor active component, was determined by chromatography. TE-1 cells were divided into normoxia control (NC) group, hypoxia control (HC) group, MTD group, activating blood (AB), promoting Qi (PQ) and removing toxin (RT) separated formula groups. The optimal concentration and time dependent manner of MTD and the 3 separated formulas were screened by CCK-8 assay. Migration and invasion ability was detected by wound healing and invasion assay. Vasculogenesis experiment was performed to investigate TE-1 cells’ vasculogenic capacity. Protein expression of NF-κB/HIF-1α axis and VM related molecules were detected by Western blot. Interaction between HIF-1α and NF-κB was detected by double immunofluorescence labeling assay. mRNA expression of HIF-1α and NF-κB was detected by qRT-PCR. Protein secretion of HIF-1α and E-cadherin in supernatant of culture media was determined by ELISA assay.
Results:
Extract of MTD contained amygdalin, an active anti-cancer component, the concentration of it being 104.397 μg/mL. Effect-time dependent manner was achieved when cells were treated with MTD and the 3 separated formulas for 24 hours with IC50 concentration, MTD, 2550 μg/mL; PQ, 3384 μg/mL; AB, 3979 μg/mL; RT, 3832 μg/mL. Cell migration area rate of NC group was 43% while that of HC group was 56% after 12 hours; the rate of the 4 medications decreased differently, showing statistical significance with that of NC group (P < .05). Cell invasion area in HC group was 80% within invasion field while it was 55% in NC group after 48 hours; Cell invasion ability was inhibited differently by the 4 medications, invasion area showing statistical significance with that of NC group (P < .05). Hypoxia stimulation promoted formation of reticular structure of cells after 6 hours. The structure disappeared after the 4 medications’ activity. Fluorescent signals of HIF-1α and NF-κB were enhanced in the hypoxia, compared with those in the normoxia, showing statistical significance (P < .05). The 2 fluorescent signals were notably inhibited by the medications, among which MTD and the AB formula were much stronger. Proteins of the NF-κB/HIF-1α axis and VM related molecules were over-expressed in the hypoxia except E-cadherin was down-regulated. After intervention with the medications, the protein expression was remarkably inhibited, while E-cadherin was over-expressed. HIF-1α mRNA expression significantly increased after hypoxia stimulation, however, the expression in AB and RT groups was notably inhibited. NF-κB mRNA expression didn’t change notably in the hypoxia, but was inhibited in all medication groups with no statistical significance. ELISA assay showed that HIF-1α protein from supernatant was increased and E-cadherin reduced after hypoxia stimulation. The 4 medications inhibited HIF-1α protein secretion, among which MTD and the AB formula showed stronger function. However, the 4 medications showed no obvious function on E-cadherin protein secretion.
Conclusions:
Hypoxia is an important condition that promotes VM generation in EC TE-1 cells and the mechanism relates to NF-κB/HIF-1α axis over-expression. Based on separated formulas being in harmony with each other, MTD shows explicit effect on EC VM regulated by NF-κB/HIF-1α axis.
Introduction
Esophageal cancer (EC) belongs to the category of “dysphagia” in traditional Chinese medicine(TCM). 1 As the sixth most common cancer in the world, there were 510 716 new EC cases, and the related death reached 445 129 in 2022, according to the data of the “2022 Global Cancer Statistics Report” published by the International Agency for Research on Cancer (IARC). 2 As a EC-high-incidence country, China accounts for more than half of the new cases globally. 3 The high incidence and mortality rate of EC pose a great threat to the survival and development of human beings. Therefore, breaking through the bottleneck of clinical treatment is a major problem that needs to be resolved urgently by traditional Chinese and Western medicine.
As a highly aggressive malignant tumor, EC tissues consume a large amount of oxygen, nutrients, and blood in the rapid proliferation stage. However, the speed of new blood vessel supply cannot meet growth requirements of the tumor which is in a state of high oxygen consumption, leading to formation of a hypoxic environment. Based on the issue of new blood vessel supply in this special condition, it has been confirmed that tumor cells can produce vascular-like channels through their own deformation and matrix remodeling under hypoxia stimulation, called vasculogenic mimicry (VM). 4 During the formation of VM, tumor cells can acquire the mesenchymal cell phenotype through the epithelial-mesenchymal transition (EMT), which can mimic endothelial cells and thereby simulate the process of embryonic vasculogenesis to form functional lumens. 5
In the tumor VM signaling pathway model, hypoxia is the key “switch,” and HIF-1α is the most important transcription regulatory factor. It can promote formation of VM by upregulating downstream genes. 6 NF-κB is normally located in the cytoplasm and forms a complex with IκB protein to maintain an inactive state. When cells are stimulated by hypoxia, IκB protein is degraded by phosphorylation, and HIF-1α accumulates continuously, thereby activating the NF-κB pathway. 7 Multiple experiments have demonstrated that NF-κB and HIF-1α are interrelated in different cascades, and both are hypoxia sensors which can promote generation of new blood vessels and energy supply, and further promoting the occurrence, development, invasion, and metastasis of cancer cells.8,9
As a national patent in China, 10 modified Tongyou Decoction (MTD) was designed by our research team, aiming to treat EC. A series of basic experiments were conducted, showing that MTD inhibited EC cells proliferation via regulating cell cycle and downregulating PI3K/akt- NF-κB signaling pathway in normoxia condition,11,12 and what’s more, MTD inhibited EC cell invasion and metastasis by downregulating HIF-1α-Snail axis and EMT related proteins in hypoxia condition, 13 however, how herbs in MTD interact hasn’t yet been clearly understood. This study further explored effects of MTD and its separated formulas on VM, the special tumor behavior in hypoxia, and the possible mechanism on HIF-1α/NF-κB pathways regulating hypoxia-related factors in EC TE-1 cells. The research is reported as follows.
Materials and Methods
Drugs and Cells
Ingredients of MTD: Arecae Semen (Areca catechu L,) 5 g, Carthami Flos (Carthamus tinctorius L.) 15 g, Bugbane Rhizome (Cimicifuga foetida) 10 g, Persicae Semen (Prunus persica (L.) Batsch) 5 g, Barbed Skullcap Herb (Scutellaria barbata D. Don) 15 g, Spreading Hedyotis Herb (Hedyotis diffusa) 15 g. Six Chinese herbs were purchased from Tongrentang Pharmacy. MTD is divided into 3 separated formula groups according to their functions: activating blood (AB) Group, promoting Qi (PQ) group, and removing toxin (RT) group. Components are as follows: (1) AB group: Persicae Semen and Carthami Flos. (2) PQ group: Bugbane Rhizome and Arecae Semen. (3) RT group: Spreading Hedyotis Herb and Barbed Skullcap Herb. TE-1 cells (SIBS,TCHu 89, RRID: CVCL_1759) of EC were purchased from Shanghai Cell Bank of the Chinese Academy of Sciences.
Instruments
Cell Culture Incubator (Thermo, 371); Biological Safety Cabinet (Thermo, 1574-AC-GP); Low-Temperature High-Speed Centrifuge (Haier, LX-165T2R); High Performance Liquid Chromatography (Shimadzu LC-20A); C18 Chromatographic Column (Agilent ZORBAX Eclipse Plus C18Model: 4.6 × 250 mm, 5-micron); Electrophoresis Tank (Thermo, PS2108); Electrophoresis Instrument (Thermo, Mini Blot Module 072021); Chemiluminescence/Fluorescence Gel Imaging System (BIORAD, ChemiDocTM CXRS + System); PCR Amplifier (BIO RAD, T100TM Thermal Cycler); Fluorescence Quantitative PCR Instrument (Analytik Jena, 2.1).
Preparation of MTD and Its 3 Separated Formulas
MTD Preparation: Six herbs were immersed in MilliQ water for 24 hours, then refluxed for 2 hours. The supernatant containing water was filtered (4500 rpm for 30 minutes, repeated twice), and then anhydrous ethanol was added to the supernatant containing water for alcohol precipitation. The final concentration of anhydrous ethanol in the supernatant containing water was 55%. After resting for 48 hours, the supernatant containing ethanol was filtered again (4500 rpm for 30 minutes, repeated twice), and then followed by rotary evaporation for 4 hours to produce a sample (extract); we use a filter (diameter, 0.22μm) to get rid of impurities. The 3 separated formulas were prepared with the same procedure. All medications were stored at 4ºC.
High Performance Liquid Chromatography (HPLC) for Identifying Amygdalin in MTD
MTD extract was mixed with 25 mL of methanol, weighed, and then sonicated for 30 minutes. After the mixture cooled to room temperature, it was re-weighed, and the weight lost during sonication was made up with methanol. The mixture was filtered, and 5 mL of the filtrate was transferred to a 50 mL volumetric flask and diluted to volume with 50% methanol. The mixture was then filtered through a 0.45 μm filter membrane and injected into the HPLC system (chromatographic conditions: column temperature 40ºC, mobile phase: acetonitrile-0.1% phosphoric acid solution (8:92), flow rate 1.0 mL/min; wavelength 207 nm, injection volume 20 μL).
Cell Grouping and Culture
TE-1 Cells were divided into normoxia control (NC) group, hypoxia control (HC) group, MTD Group, AB Group, PQ Group, and RT Group. Cells in NC Group were cultured at 37ºC and 5% CO2 in 7 mL of RPMI1640 complete medium. Cells in the rest of the groups were cultured at 37ºC and 5% CO2 with 94% N2 in 7 mL of RPMI1640 (Shanghai XP Biomed Ltd, C3001-0500) complete/drug-containing medium.
Cell Counting Kit-8 (CCK-8) Assay
TE-1 cells were seeded into a 96-well plate with 100 µL of cell suspension at a density of 1 × 10⁵ cells/mL. After adherence, 100 µL of drug-containing medium was added with final concentrations of 400, 800, 1600, 3200, 6400, and 12 800 µg/mL, with 3 replicate wells for each concentration. Cells in the control group were treated with RPMI1640 complete medium, and cells in blank group were treated with the basic medium. After discarding the original culture medium at 24, 48, and 72 hours, CCK-8 (Report Biotech Ltd, RP-RC3028) reagent was added, and the cells were incubated for 1 hour. The absorbance (OD) value at 450 nm of each well was measured. The tumor cell inhibition rate (%) = [1 − (medication group − blank group)/(control group − blank group)] × 100%.
Wound Healing Assay
TE-1 cells were seeded into a 24-well plate with 1 mL cell suspension at a density of 5 × 10⁴ cells/mL. When cells fused to 95%, a 200 µL pipette tip was used to make a vertical scratch in each well, and the line ran through the entire well of the culture plate. The cells were then washed with phosphate-buffered saline (Shanghai XP Biomed Ltd, C3593-0500) to remove any suspended cells and cell debris. Cells in the medication groups were each added with 1 mL of drug-containing medium. Immediately, the cells were observed and photographed to record the migration status at 0 hours. The migration width area of the scratch was measured and photographed after 12 hours.
Transwell Invasion Assay
The Matrigel (ABW, 0827045) and serum-free RPMI1640 medium were mixed at a ratio of 1:8. The diluted solution was then added to the bottom of the Transwell chamber and allowed to rest for 1 hour. TE-1 cells were inoculated into the Transwell chamber with 100 µL of cell suspension at a density of 1 × 10⁶ cells/mL. The groups were set up as described above, with 1 mL drug-containing medium added to the lower chamber. After 48 hours of cultivation, the cells were terminated, and the medium in the chamber was discarded. The cells were washed in PBS 3 times, fixed with 4% paraformaldehyde for 30 minutes, stained with crystal violet, and gently brushed with a cotton swab to remove any unstained cells from the inner surface of the Transwell chamber. A coverslip was then placed over the cells, sealed, and observed under a microscope for photography.
Vasculogenesis Experiment
The Matrigel stored at −20ºC was thawed on ice, and 50 µL of Matrigel was added to each well of a 96-well plate. The plate was then incubated for 1 hour. Logarithmic phase TE-1 cells were inoculated into the 96-well plate with 100 µL of cell suspension at a density of 2 × 10⁴ cells/mL. After the cells had adhered to the plate, the groups were set up as described above, and 100 µL drug-containing medium was added to each group. The VM morphology was observed and photographed under a microscope at 6 and 8 hours time points.
Double Immunofluorescence Labeling Assay
TE-1 cells were seeded into a 24-well plate with 1 mL cell suspension at a density of 5 × 10⁴ cells/mL. When cells had fused to approximately 60%, the groups were set up as described above, and 100 µL of drug-containing medium was added to each group. The cells were cultured for 24 hours. The medium was discarded, and the cells were washed in PBS 3 times. They were then fixed with 4% paraformaldehyde (Report Biotech Ltd, RS0030) for 30 minutes, washed in PBS 3 times, and permeabilized with 0.5% Triton X-100 (Report Biotech Ltd, RS0015) at room temperature for 30 minutes. The cells were washed in PBS 3 times, blocked with 2% BSA (Report Biotech Ltd, RP-RW0502-5g) for 30 minutes, and then aspirated. A sufficient amount of primary antibody (anti-mouse, Report, S1001, Anti-rabbit, Report, S1002; diluted 1:100) was added to each slide and incubated overnight at 4ºC. The cells were washed in PBS 3 times, and the fluorescent secondary antibody (anti-mouse, Report, S2001 RRID: AB_3662690, Anti-rabbit, RRID: AB_3662691, Report, S2002; diluted 1:200) was added and incubated for 1 hour at 37ºC in the dark. The cells were washed in PBS 3 times, stained with DAPI for nuclear staining, and then sealed and imaged.
Western Blot Assay
Cells in NC group were cultured under the conditions of 37ºC and 5% CO2. Cells in HC group and medication groups were cultured under the conditions of 37ºC, 5% CO2, and 94% N2. The protein levels in hypoxia modeling were detected by Western Blot (hypoxia marker: HIF-1α). Culture flask was taken out from incubator, and cells’ morphology was observed, on condition that cells covered 80% visual field, total protein was extracted. The medium was discarded, and cells were washed with PBS 3 times to remove dead cells, cell debris and other impurities. Lysis buffer was prepared with a ratio of RIPA Lysis Buffer (ZHONGSHI TONTRU, CC01001) to PMSF of 100:1. The cells were scraped and transferred to an EP tube. About 150 μL of lysis buffer were added to each EP tube for different groups and mixed well and the tubes were placed in an ice bath. The cells were pipetted every 10 minutes to ensure complete cell lysis for a total duration of 30 minutes. The tubes were centrifuged at 8000 rpm and 4°C for 10 minutes. The supernatants were collected from each tube and stored at −80°C. The protein concentration of each sample was determined by the BCA protein assay kit (Report Biotech Ltd, RW0201). The quantitative samples were mixed with loading buffer, then denatured at 100ºC for 10 minutes. The operations include routine potting, loading, electrophoresis, electroporation, blocking and antigen-antibody reaction (each primary antibody working concentration: HIF-1α (GeneTex, GTX127309, RRID: AB_2616089), 1:3000; MMP-2 (Report Biotech Ltd, RP-RA1021), 1:1000; MMP-9 (Affinity, AF5228, RRID: AB_2837714), 1:1000; VE-cadherin (Arigo, ARG11036), 1:2500; Snail (HUA BIO, ER1706-22 RRID: AB_3069038), 1:1000; E-cadherin (ABclonal, A20798, RRID: AB_3107194), 1:1000; Vimentin (HUA BIO, EM0401, RRID: AB_3068733), 1:1000; NF-κB (Report Biotech Ltd, RP-RA1047, RRID: AB_3662687), 1:1000; TNF-α (Affinity, AF7014, RRID: AB_2835319), 1:1000; β-actin (ABclonal, AC026, RRID: AB_2768234, 1:100 000), ECL (Report Biotech Ltd, RW0601) imaging. Image J analysis software was used to semi-quantitatively analyze the gray value of protein bands. Statistical analysis was performed by taking the ratio of each band to the internal reference.
qRT-PCR Assay
Cells in HC group and 4 medication groups were cultured under the conditions of 37ºC, 5% CO2, 94% N2. Total RNA was extracted by the TRizol reagent kit, and the concentration of RNA in each group was detected. A reverse transcription system was constructed: 5×Fast SYBR Green qPCR Mix (ZHONGSHI TONTRU, ZS-M13001) 4 μL, PCR Forward Primer(10 μM) 0.2 μL, PCR Reverse Primer(10 μM) 0.2 μL, DNA template 2 μL, dH2O adjusted the final volume to 20 μL. A 2-step Real-Time PCR reaction program was used:
Stage 1: 95ºC 30 seconds
Stage 2: 95ºC 30 seconds
60ºC 20 seconds 40 cycles
Stage 3: The 2−ΔΔCT method was used to calculate the relative gene expression (Dissociation analysis)
The primer sequence for NF-κB, HIF-1α, and GAPDH was in Table 1.
Primer Sequence.

ELISA Assay
Cells in HC group and medication groups were cultured under the conditions of 37ºC, 5% CO2, 94% N2. The supernatant of cell culture was centrifuged at 2000 rpm for 20 minutes to prepare the samples for detection. The standard substances were slowly diluted, and the standard substances and the samples were added to the 96-well plate coated with antibodies, incubated at room temperature for 2.5 hours. The plate was washed with Wash Buffer 4 times, and Detection Antibody HIF-1α/E-cadherin was added to each well and incubated at room temperature for 1 hours. The plate was washed with Wash Buffer 4 times, HRP-streptavidin concentrate (diluted 300 times) was added to each well and incubated at room temperature for 45 minutes. The plate was washed with Wash Buffer 4 times, and TMB 1-step substrate reagent was added to each well and incubated at room temperature for 30 minutes. Finally, the termination solution was added to each well, the value was read at 450 nm of the microplate reader and the data were analyzed.
Statistical Analysis
Data analysis was conducted with SPSS 26.0 edition software. Line chart was used to calculate IC50 values based on CCK-8 assay. Cell scratch width area, invasion area, protein gray values, and mRNA values were expressed as (mean ± standard error). Gel-Pro imaging was used for the semi-quantitative analysis of protein bands, mRNA and fluorescent signal density. The data were tested for homogeneity of variance by one-way ANOVA, which was also applied for comparisons within multiple groups. Presuming that the data followed a normal distribution, the least significant difference (LSD) test was applied to compare differences in the data between each pair of groups. P < .05 was regarded as statistical significance.
Results
Amygdalin Content in MTD
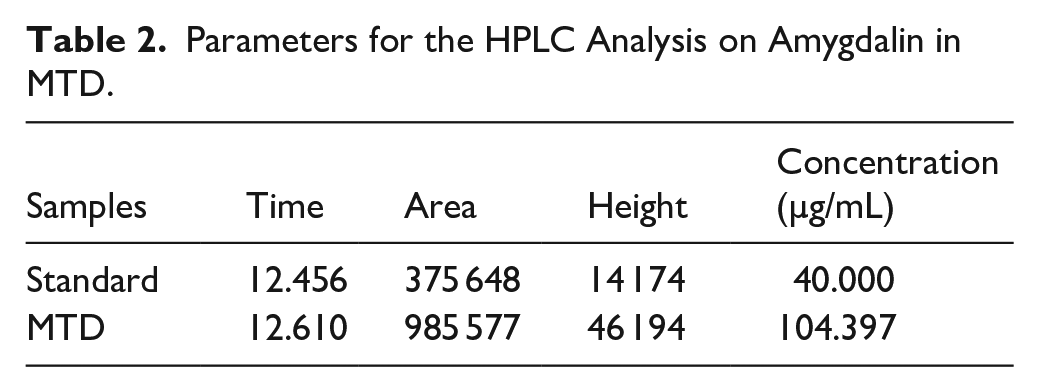
In order to ascertain therapeutic material basis of MTD anti-EC activity, HPLC assay was used to measure amygdalin which was an explicit anticancer ingredient contained in Persicae Semen, an indispensable herb in MTD. HPLC showed that amygdalin decomposed in the diluted MTD samples was successfully separated from the mixture. Then, the relative content of amygdalin in the test solution was 104.397 μg/mL by comparing the chromatograms of amygdalin standard solution with the chromatograms of the test solution, as shown in Figure 1 and Table 2.

HPLC analysis on amygdalin in MTD.
Parameters for the HPLC Analysis on Amygdalin in MTD.
Cell Viability
As shown in Figure 2, inhibition rate of MTD and its separated formulas on TE-1 cells viability was measured with CCK-8 assay under hypoxia condition. Results showed that inhibition rate of TE-1 cells proliferation was different at various concentrations of MTD and its separated formulas. The cell viability was negatively related to the drug concentration. The IC50 of MTD was 2550 µg/mL; that of PQ, 3384 µg/mL; that of AB, 3979 µg/mL; that of RT, 3832 µg/mL. At the maximum concentration 12 800 µg/mL after 24 hours, the 4 medications showed the same tendency, inhibition rates touching the top, MTD inhibited 99.58% TE-1cells proliferation, PQ, 93.97%; AB, 96.58%; RT, 97.80%. The curves showed there was dose-effect and time-effect dependent manner of anti-cancer activity of the 4 medications.

Inhibition of TE-1 cells proliferation at various concentrations of MTD and its separated formulas. The 4 medications inhibited cell proliferation in vitro in different degrees. Cell viability analysis was performed by using CCK-8 assay following treatment with different concentrations (0, 400, 800, 1600, 3200, 6400, 12 800 µM) of MTD and its separated formulas for 24, 48, or 72 hours. The horizontal axis represents drug concentration, and the vertical axis represents inhibition rate. The IC50 was calculated by Graphpad Prism 9.
Cells Migration Ability
Migration ability of TE-1 cells showed different results in normoxia and hypoxia environments. The wound healing assay showed that migration area rate of NC group was about 43% while that of HC group was about 56% after 12 hours, showing statistical significance (P < .05). Migration ability was markedly enhanced with hypoxia stimulation.
Cells migration area rate in the 4 medication groups decreased differently, showing statistical significance with that of NC group (P < .05). Notably, the rate of MTD group showed statistical difference from that of the 3 separated formula groups (P < .05). However, there was no significant difference among the 3 groups. The results indicated that MTD is the optimal choice for inhibiting EC cells migration, as shown in Figure 3 and Table 3.
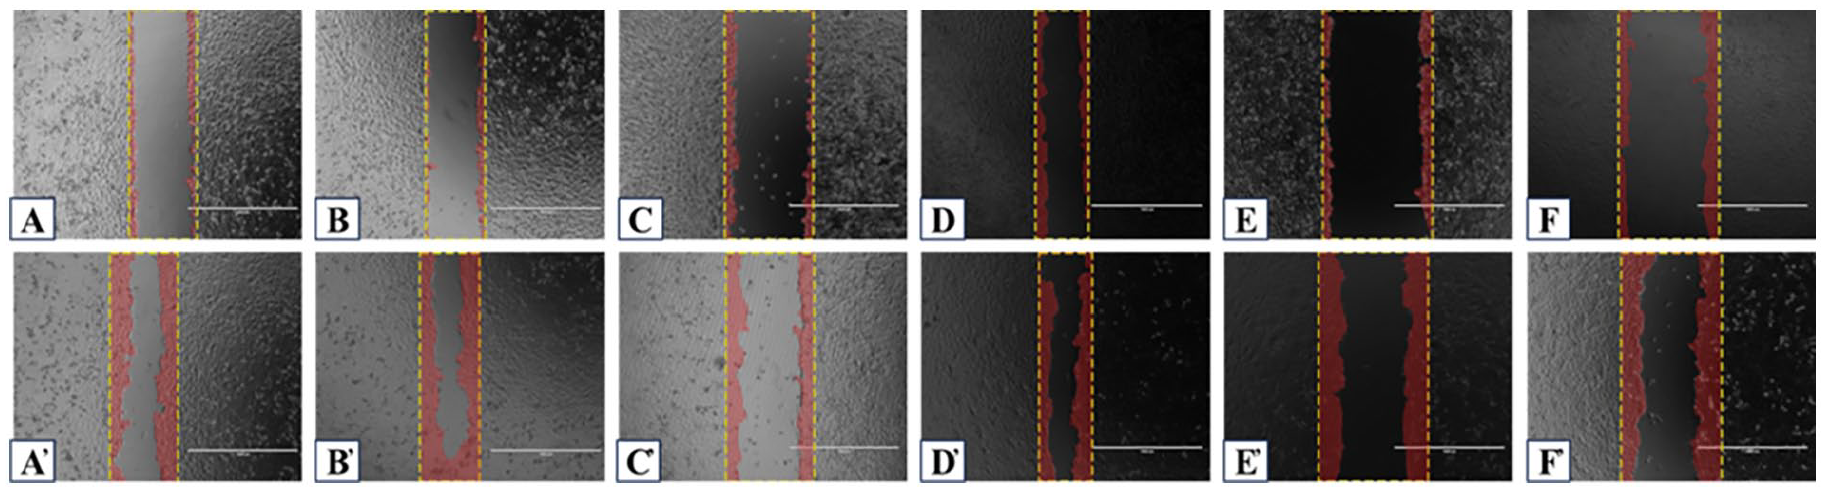
Scratch assay on TE-1 cells affected by MTD and its separated formulas. Note: A(0 hours), A’(12 hours)-NC group; B(0 hours), B’(12 hours)-HC group; C(0 hours), C’(12 hours)-MTD group; D(0 hours), D’(12 hours)-PQ group; E(0 hours), E’(12 hours)-AB group; F(0 hours), F’(12 hours)-RT group. Scratch was made successfully for each group at 0 hours time point. Cells in the 6 groups showed different healing abilities after 12 hours. Cells proliferated and healed obviously in NC and HC groups (A’ and B’), especially cells re-touched again in the hypoxia environment (B’). Cells affected by 4 medications healed slowly in different degrees (C’-F’).
Migration Area Percent of TE-1 Cells Affected by MTD and Its Separated Formulas (%,x− ± s).

Cells in HC group showed the strongest healing ability among the 6 groups. The healing ability was inhibited in different degrees by the 4 medications. MTD showed the strongest function. One-way ANOVA was used to test homogeneity of variance, LSD method was used to test statistical difference between every 2 groups.
Compared with NC group (P < .05).
Compared with HC group (P < .05).
Compared with AB group (P < .05).
Compared with PQ group (P < .05).
Compared with RT group (P < .05).
Cell Invasion Ability
Invasion ability of TE-1 cells showed different results in normoxia and hypoxia environments. Transwell assay showed that cells area in HC group was about 80% invasion field while that was about 55% in NC group after 48 hours. Cell invasion ability was markedly enhanced after hypoxia stimulation.
Cells invasion ability was inhibited differently by the 4 medications, the area showing statistical significance with that of NC group (P < .05). Notably, the area of the MTD group showed statistical difference from that of the 3 separated formula groups (P < .05). However, there was no significant difference among the 3 groups. The results indicated that MTD is the optimal choice in inhibiting EC cell invasion, as shown in Figure 4 and Table 4.
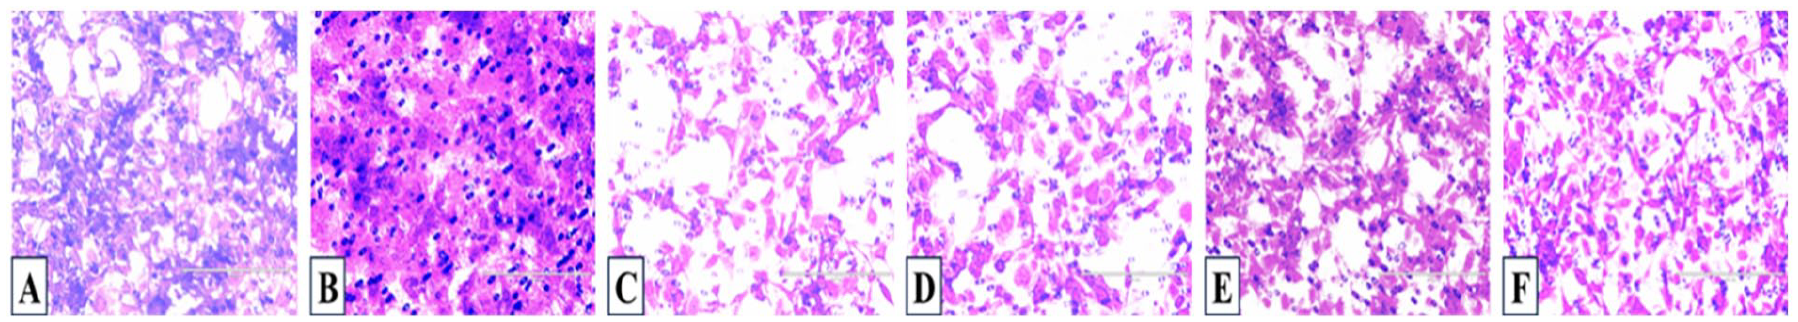
Invasion assay on TE-1 cells affected by MTD and its separated formulas. (A) NC group. (B) HC group. (C) MTD group. (D) PQ group. (E) AB group. (F) RT group. Transwell cells proliferated vigorously in the hypoxia, cells being in mass (B). Cell invasion ability was inhibited by the 4 medications in different degree, especially the MTD and PQ formulas showed strong activity; cells were infertile and the mass disappeared (C and D).
Invasion area of TE-1 Cells Affected by MTD and Its Separated Formulas (μm2,x−±s).

Cells in the HC group showed the strongest invasion ability among the 6 groups. The invasion ability was inhibited to different degrees by the 4 medications. MTD showed the strongest activity. One-way ANOVA was used to test homogeneity of variance, LSD method was used to test statistical difference between every 2 groups.
Compared with NC group (P < .05).
Compared with HC group (P < .05).
Compared with AB group.
Compared with PQ group.
Compared with RT group (P < .05).
Vasculogenesis Ability
The vasculogenesis experiment showed that morphology of TE-1 cells was quite different in the normoxia from the hypoxia environment. Cells grew in clusters without forming a reticular structure in the normoxia, however, cells took on a reticular structure with mutual connections in the hypoxia.
Hypoxia cells showed quite different morphology affected by MTD and its separated formulas. The cells grew irregularly with disordered arrangements and didn’t present a reticular structure, indicating the medications significantly inhibited vasculogenesis, as shown in Figure 5.

MTD and its separated formulas inhibiting vasculogenesis of TE-1 cells. A(6 hours), A’(8 hours)-NC group; B(6 hours), B’(8 hours)-HC group; C(6 hours), C’(8 hours)-MTD group; D(6 hours), D’(8 hours)-PQ group; E(6 hours), E’(8 hours)-AB group; F(6 hours), F’(8 hours)-RT group. Cells grew in clusters without forming a reticular structure in normoxia (A and A’). Cells formed a reticular structure with mutual connections after 6 hours hypoxia stimulation (B), the reticular structure was significant after 8 hours (B’). MTD and 3 separated formulas inhibited formation of reticular structure (C-F, C’-F’).
Fluorescent Co-expression of HIF-1α and NF-κB
The hypoxia environment notably enhanced HIF-1α and NF-κB fluorescence intensity compared with that in normoxia, showing statistical significance (P < .05). The 2 signals expression were positively correlated.
MTD and the 3 separated formulas markedly inhibited HIF-1α and NF-κB fluorescence intensity compared with that HC group, showing statistical significance (P < .05). Notably, judged by the fluorescence intensity, function of MTD and the AB formula inhibiting HIF-1α expression was much stronger than that of PQ and RT, showing statistical significance (P < .05). However, activity of the 4 medications inhibiting NF-κB expression showed no statistical significance with each other, as shown in Figure 6 and Table 5.

Co-expression of NF-κB and HIF-1α with immunofluorescence in TE-1 cells affected by MTD and 3 separated formulas. (A) NC group. (B) HC group. (C) MTD group. (D) PQ group. (E) AB group. (F) RT group. The green represented HIF-1 α fluorescence expression, the red represented NF-κB fluorescence expression. The red and green lights were weak in the NC group; by contrast, both lights were enhanced in the HC group. Light signals in the 4 medications group scattered locally and decay of the co-expression is noteworthy. Different images were taken with a microscope (20×).
Fluorescence Density Semi-Quantitative Analysis of MTD and Its Separated Formulas on the Co-Expression of NF-κB and HIF-1α (x− ± s).

Relative fluorescent density of HIF-1α and NF-κB in TE-1 cells affected by MTD and its separated formulas. Fluorescent signals were enlightened in the HC group, showing the strongest density among the 6 groups. The signals were inhibited to different degrees by the 4 medications. MTD showed the strongest function, followed by AB formula. One-way ANOVA was used to test homogeneity of variance, LSD method was used to test statistical difference between every 2 groups.
Compared with NC group (P < .05).
Compared with HC group (P < .05).
Compared with PQ group.
Compared with RT group (P < .05).
Protein Expression of NF-κB/HIF-1α Axis and VM Related Molecules in the Normoxia and Hypoxia Environment
As shown in Figure 7, Tables 6, and 7, HIF-1α in the hypoxia condition was markedly up-regulated compared with that in normoxia, indicating successful hypoxia modeling with a statistical significance (P < .05). Protein expression of NF-κB, TNF-α, MMP-2, MMP-9 snail, and Vimentin showed the same tendency. Notably, protein expression of E-cadherin was down-regulated. The results illustrated that the hypoxia offered favorable condition for NF-κB/HIF-1α axis mediating VM formation.

Protein bands of NF-κB/HIF-1α axis and VM related molecules in TE-1 cells in the normoxia and hypoxia. Indexes included MMP-2, MMP-9, E-cadherin, VE-cadherin, snail, Vimentin, TNF-α, HIF-1α, and NF-κB.
Relative Gray Value of Protein Expression of NF-κB/HIF-1α Axis in the Normoxia and Hypoxia (x− ± s).
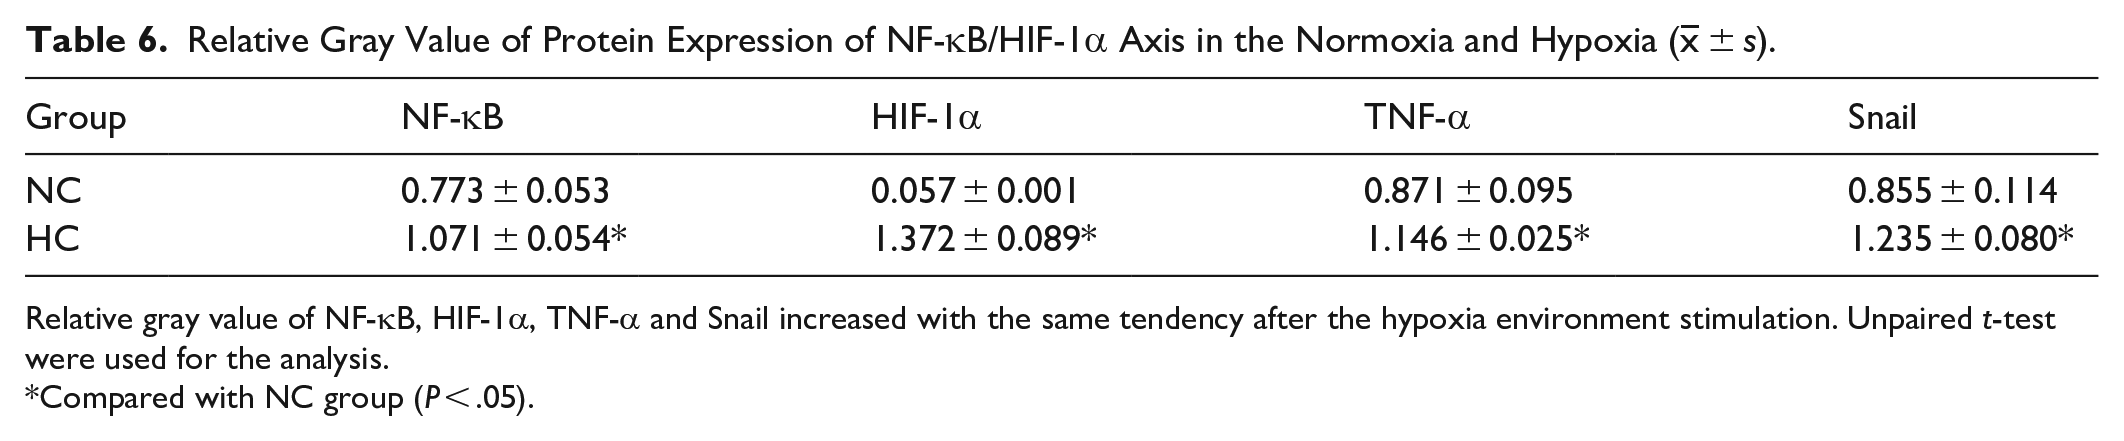
Relative gray value of NF-κB, HIF-1α, TNF-α and Snail increased with the same tendency after the hypoxia environment stimulation. Unpaired t-test were used for the analysis.
Compared with NC group (P < .05).
Protein Expression of NF-κB/HIF-1α Axis and VM Related Molecules
Relative Gray Value of Protein Expression of VM Related Molecules in the Normoxia and Hypoxia (−x ± s).

Relative gray value of MMP-2, MMP-9, VE-cadherin, and Vimentin increased with the same tendency after the hypoxia environment stimulation, except that E-cadherin reduced. Unpaired t-test were used for the analysis.
Compared with NC group (P < .05).
Protein Expression of NF-κB/HIF-1α Axis and VM Related Molecules
As shown in Figure 8, Tables 8, and 9, Western Blot showed that protein expression of HIF-1α, NF-κB, TNF-α and Snail in the 4 medication groups was markedly down-regulated compared with that in HC group, showing statistical significance (P < .05). However, for NF-κB and Snail, there was no statistical difference among MTD and its separated formulas. Notably, protein expression of HIF-1α in AB group was significantly lowered among the 4 medication groups (P < .05). Expression of TNF-α affected by PQ and RT formula was weaker than that by MTD and AB (P < .05). Therefore, the results suggest that AB formula has the strongest inhibitory effect on HIF-1α; PQ and RT showed strong inhibition effect on TNF-α.

Protein expression of NF-κB/HIF-1α axis and VM related molecules treated with MTD and its separated formulas in TE-1 cells under hypoxia conditions. The effect of MTD and its separated formulas on the expression of MMP-2, MMP-9, E-cadherin, VE-cadherin, Snail, Vimentin, TNF-α, HIF-1α, and NF-κB protein in TE-1 cells.
Relative Gray Value of Protein Expression of NF-κB/HIF-1α Axis Affected by MTD and Its Separated Formulas (x− ± s).

Compared with HC group (P < .05).
Compared with PQ group (P < .05).
Compared with RT group (P < .05).
Compared with AB group (P < .05).
Compared with MTD group (P < .05).
Relative Gray Value of Protein Expression of VM Related Molecules Affected by MTD and Its Separated Formulas (x− ± s).

Compared with HC group (P < .05).
Compared with PQ group (P < .05).
Compared with RT group (P < .05).
Compared with AB group (P < .05).
Compared with MTD group (P < .05).
Protein expression of MMP-2 in the medication groups was down-regulated compared with that in HC group (P < .05). Notably, PQ showed the strongest inhibition on MMP-2, showing statistical significance with AB (P < .05). Protein expression of MMP-9, VE-cadherin and Vimentin in the 4 medication groups was significantly down-regulated compared with that HC group (P < .05). Notably, PQ and RT showed the strongest inhibition on MMP-9; MTD and RT formula showed strong inhibition effect on Vimentin.
Protein expression of E-cadherin in the medication groups was markedly up-regulated compared with that in HC group (P < .05). Notably, there was significant difference between MTD group and PQ group, AB group (P < .05). Therefore, MTD is the strongest formula promoting E-cadherin expression among the 4 medication groups.
mRNA Expression of NF-κB and HIF-1α
qRT-PCR assay showed that mRNA of HIF-1α in HC group was markedly over-expressed compared with that in NC group, showing statistical significance (P < .05). The mRNA in the 4 medication groups were down-regulated in different degree. Notably, the mRNA expression in AB group and RT group was markedly lowered compared with that in HC group, showing statistical significance (P < .05); however, the expression in MTD and PQ group showed no statistical significance with that in HC group.
Additionally, mRNA expression of NF-κB in HC group showed no difference from that in NC group. However, the mRNA expression of NF-κB in the 4 medication groups was significantly lowered compared with that in HC group, showing statistical significance (P < .01, P < .001).
There was no statistical significance among the medication groups about the mRNA expression of HIF-1α and NF-κB, as shown in Figure 9.

Column diagram of mRNA expression of NF-κB and HIF-1α in TE-1 cells affected by MTD and its separated formulas. The top one was in HC group. mRNA expression of NF-κB and HIF-1α was inhibited in different degree by the 4 medications. One-way ANOVA was used to test homogeneity of variance, LSD method was used to test statistical difference between every 2 groups.
Protein Expression of HIF-1α and E-cadherin from Supernatant of Cell Culture
ELISA assay showed that protein of HIF-1α from supernatant of cell culture was markedly over-expressed in the hypoxia compared with that in the normoxia condition, with statistical significance (P < .0001). Compared with the expression in HC group, those in MTD group and AB group were remarkably reduced (P < .0001), and those in the PQ and RT groups fairly reduced (P < .001 and P < .01, respectively), showing statistical significance.
On the other hand, protein of E-cadherin was down-regulated in hypoxia compared with normoxia, showing statistical significance (P < .001). There was no statistical significance between any medication group and HC group.
There was no statistical significance among the medication groups for the mRNA expression of HIF-1α and E-cadherin, as shown in Figure 10.

Column diagram of protein secretion of HIF-1α and E-cadherin from the supernatant of cell culture. HIF-1α was over-expressed in HC group and down-regulated by MTD and its separated formulas. E-cadherin was suppressed in HC group and the 4 medications showed no effect on it. One-way ANOVA was used to test homogeneity of variance; LSD method was used to test statistical difference between every 2 groups.
Discussion
Hypoxia of tumor tissue is closely related to blood stasis. 14 Most solid tumors experience local oxygen supply disorders and abnormal vasculogenesis due to their excessive demand for oxygen and blood supply during rapid proliferation. 15 The coagulation state of the blood and the hypoxic microenvironment correspond to the concept of Qi stasis and blood stagnation in TCM. 16 Therefore, therapeutic method of activating blood and promoting Qi plays a crucial role in inhibiting the metastasis of malignant tumors. This method can be used to improve the hypercoagulation state by promoting peripheral microcirculation. 17 In short, when blood stasis resolves, blood vessels become unobstructed, and cancerous toxin is eliminated. Hence, this approach offers a new direction and strategy for intervening in the tumor in hypoxia microenvironment and inhibiting tumor invasion and metastasis. 18
Based on the above pathogenesis consideration and TCM pharmacology, the present study aimed to investigate MTD, a Chinese national patent invented by our team, which is a typical activating-blood formula, for its activity on EC cells, to provide experimental evidence for its application in the clinic. In order to verify its function accurately, MTD was separated into 3 sub-formulas. Activating-blood Formula containing Persicae Semen and Carthami Flos, which can promote blood circulation and transform blood stasis. Promoting-Qi Formula containing Bugbane Rhizome and Arecae Semen. Bugbane Rhizome can ascend the nutrients and descend the turbidity. Arecae Semen can disperse and circulate Qi. Removing-toxin Formula containing spreading Hedyotis Herb and barbed Skullcap Herb, can detoxify the body’s stasis toxin. Overall speaking, MTD is specialized in activating blood, circulating Qi, removing toxin, and resolving masses.
Tumor cell or tissue hypoxia can cause abnormalities in multiple signaling pathways, with the NF-κB/HIF-1α axis being an important one. HIF-1α plays a crucial role in the adaptive response of tumor cells to hypoxia. HIF-1α is not only a key regulator of tumor hypoxic response but also an upstream transcription regulator of genes related to tumor neovascularization, energy metabolism, cell proliferation, invasion, and metastasis. Multiple studies have shown that NF-κB can activate the expression of factors related to tumor vasculogenesis, invasion, and metastasis.19,20 Further, it’s an important transcription factor for HIF-1α which accumulates continuously under hypoxia conditions. 21 The subunits P65 and P50 of NF-κB can bind to the promoter of HIF-1α, promoting the transcription of HIF-1α, and may play a role in determining the speed and degree of HIF-1α activation under hypoxia conditions. 22
The remodeling of the extracellular matrix (ECM) of tumor cells is an important change in the process of VM formed by tumor cells. Matrix metalloproteinases (MMPs) are the only matrix-degrading enzymes for interstitial collagen, and they can aggravate tumor growth and diffusion through endothelial cell migration and neovascularization. 23 During the process of vasculogenesis, endothelial cells migrate through the extracellular matrix and matrix membrane, a process where MMP-2 and MMP-9 both play a role in degrading the fibrous scaffold and fibrinolysis, 24 thereby promoting the infiltration of cancer cells into surrounding tissues.
EMT is a process that leads to the reduction of cell adhesion molecules such as E-cadherin, playing a crucial role in maintaining the epithelial phenotype. Therefore, the reduction of E-cadherin can decrease intercellular adhesion, making tumor cells more prone to invading and metastasizing toward surrounding tissues. Concurrently, VM, a transformed form of tumor cells after EMT, involves VE-cadherin as a crucial site for its cross-interaction. VE-cadherin can mediate adhesive connections between endothelial cells and tumor vasculogenesis. 25 As the first identified important regulatory factor for VM, it also can mediate intercellular adhesion.
Inflammation is a protective response triggered by stimuli such as damage and infection in the body. Approximately 20% of cancers have been shown to be associated with chronic inflammation, and inflammatory factors have been demonstrated to play a crucial role in the occurrence and development of tumors. 26 Moreover, TNF-1α is regarded as a crucial inflammatory factor that links inflammation with tumor. It can mediate the release of other inflammatory factors through inflammatory pathways such as NF-κB, promoting the cascade amplification of inflammatory responses and abnormal proliferation of tumor cells. 27 Additionally, TNF-1α can directly trigger EMT, facilitating the malignant transformation of epithelial cells, thus serving as a key factor in tumorigenesis.
Amygdalin, a chemical component of glycoside natural product, has been found to have inhibitory activity against multiple types of tumors. 28 The Persicae Semen used in the formula of this experiment contains amygdalin. In terms of quality control on Persicae Semen, the literature often uses the amount of amygdalin as an indicator to evaluate the quality of Persicae Semen. 29 Therefore, based on the antitumor effects demonstrated by amygdalin, the determination of amygdalin contained in MTD provides a pharmacological basis for the feasibility of this prescription in treating EC.
Supported by the analysis on amygdalin content, the CCK-8 cell toxicity assay was used to observe the effect of MTD and its separated formulas on the proliferation of EC TE-1 cells under hypoxia condition, and to screen for the optimal drug concentration and time. The experimental results showed that when the drug concentration was set to IC50 and treated for 24 hours, the 4 medications significantly inhibited proliferation of TE-1 cells. To objectively evaluate the effects of MTD and the 3 separated formulas on cell movement, morphology, and molecular mechanisms under hypoxia conditions, this experiment set up a NC group to investigate the feasibility of hypoxia modeling and hypoxic microenvironment from multiple dimensions.
Wound healing and invasion assay showed that the hypoxia stimulated migration and invasion abilities of TE-1 cells. MTD remarkably inhibited these abilities and the separated formulas functioned in harmony to ensure the inhibition power maximally. Vasculogenesis experiment was used to observe the VM generation of TE-1 cells and showed that tumor cells interconnected to form a network structure under hypoxic stimulation. Notably, the vascular network disappeared with intervention by MTD. The result supported that of wound healing and invasion assay.
To investigate the co-expression feature between NF-κB and HIF-1α in the hypoxia environment, the double immunofluorescence labeling assay was performed. The result showed that HIF-1α was significantly expressed in the nucleus of TE-1 cells, while it was expressed in the cytoplasm in normoxia, indicating successful induction of the expression of HIF-1α. NF-κB showed the same character, demonstrating that hypoxia activates NF-κB for nuclear translocation. Meanwhile, NF-κB/HIF-1α could be co-localized in the cells, and their fluorescence intensity showed a positive correlation. With medications intervention, their fluorescence expressions were markedly inhibited, with MTD and AB formulas showing stronger effects than the others.
In order to verify NF-κB/HIF-1α axis regulating VM, a series of protein expressions was determined with western blot, including NF-κB, HIF-1α, TNF-α, Snail, MMP-2, MMP-9, VE-cadherin, Vimentin, and E-cadherin in the normoxia and hypoxia conditions. It was noteworthy that all upregulated in the hypoxia except E-cadherin, which was markedly downregulated. With MTD and its 3 separated formulas intervention, the protein expression was inhibited except for E-cadherin overexpressing. Among the medication groups, MTD was the most effective in regulating E-cadherin and Vimentin, the AB formula was the most effective in regulating HIF-1α, both the PQ and RT formulas showed the equal effect on regulating TNF-α and MMP-9, and the RT showed equal effect on Vimentin to MTD. Aiming to elucidate the mRNA level change by the hypoxia and MTD, we used qRT-PCR assay to investigate the mRNA expression of NF-κB and HIF-1α. Interestingly, the 2 factors didn’t show the same tendency in hypoxia. HIF-1α significantly elevated but NF-κB didn’t change obviously. Both AB and RT formulas significantly inhibited HIF-1α mRNA expression, while MTD and PQ formula didn’t show effects. All medications markedly inhibited NF-κB mRNA expression, with no significant difference among them. The results of Western Blot and RT-PCR showed that in the hypoxia condition, the expression of HIF-1α protein and mRNA in TE-1 cells was significantly increased compared to that in the normoxia condition, indicating successful hypoxia modeling. Among the 4 medication groups, both AB and RT significantly inhibited HIF-1α protein and mRNA expression. However, MTD and PQ effectively inhibited protein expression but had no inhibitory effect on mRNA expression. There was no significant change in NF-κB mRNA expression in hypoxia compared to that in normoxia. MTD and its separated formulas significantly inhibited the expression of NF-κB protein and mRNA. In light of the results of RT-PCR, there was no significant difference in NF-κB mRNA expression in normoxia or hypoxia conditions, and the MTD and PQ showed no significant inhibition on HIF-1α and mRNA expression. It was considered that gene expression is divided into transcription and translation levels, namely mRNA and protein levels. The transcription and translation of eukaryotic gene expression occurred at different times and locations, with post-transcription processing, degradation of transcription products, translation, post-translation processing, and modification occurring at multiple levels and stages. As a result, the transcription and translation levels were not fully consistent.
In order to observe MTD effects in the hypoxic micro-environment, we used ELISA assay to analyze HIF-1α and E-cadherin concentration in the supernatant from culture medium. After the hypoxia stimulation, HIF-1α secretion was significantly elevated. Notably, the 4 medications inhibited the protein secretion, MTD and AB formula showing a stronger effect than PQ and RT formulas. E-cadherin in supernatant dropped markedly in hypoxia, showing the same feature as it expressed in cells; nevertheless, none of the 4 medications markedly enhanced the expression. Obviously, E-cadherin expression isn’t consistent between from culture medium and from cells affected by MTD, because different samples involved the interference from dead cell debris and metabolites in the cell supernatant.
To sum up, the CCK-8 assay provided the optimal dosing method for subsequent experiments. Wound healing and invasion assay demonstrated the effectiveness of MTD and its separated formulas on TE-1 cells from the perspective of cell viability. The vasculogenesis experiment confirmed that hypoxia acts as the “switch” for VM. Western Blot, double immuno-fluorescence labeling, ELISA, and qRT-PCR assays further elucidated mechanism of MTD and its separated formulas on TE-1 cells at the protein and mRNA levels by influencing relevant factors related to the NF-κB/HIF-1α axis.
Conclusions
Hypoxia is an important condition that promotes VM generation in EC TE-1 cells and the mechanism relates to NF-κB/HIF-1α axis over-expression. Based on separated formulas being in harmony with each other, MTD shows explicit effects on EC VM regulated by NF-κB/HIF-1α axis.
Footnotes
Acknowledgements
We are greatly indebted to the staff of Hebei Key Laboratory of Integrated Traditional Chinese and Western Medicine and Central Lab of School of Chinese Medicine, North China University of Science and Technology, for the provision of precision instruments and experiment site condition.
ORCID iDs
Author Contributions
Qian Wang, Yingying Tian and Zeyi Chen carried out the main experiments. Lingyu Kong, Xin Yan, Huijuan Cao and Fanwu Wu participated in the studies partly and analyzed the results. Chenxi Wu and Yongsen Jia wrote the manuscript. Yongsen Jia designed the research. All authors read and approved the final manuscript.
Funding
The author(s) disclosed receipt of the following financial support for the research, authorship, and/or publication of this article: This study was supported by grants from Natural Science Foundation of Hebei Province of China [Grants no. H2021209030], Basic Innovation Research Team of Tangshan, Hebei Province of China [Grants no. 21130204D], the Science and Technology Project of Hebei Education Department [Grants no. QN2018060].
Declaration of Conflicting Interests
The author(s) declared no potential conflicts of interest with respect to the research, authorship, and/or publication of this article.
Data Availability Statement
The original contributions presented in the study are included in the article/Supplemental Material, further inquiries can be directed to the corresponding authors.