
Abstract
Afatinib is a target anticancer drug of the second-generation EGFR TKI type, showing an advantage in treatment effect compared to conventional chemotherapy. However, patients on EGFR-TKI drugs also usually progress after 9 to 13 months according to secondary resistance. HAD-B1 is composed of drugs that are effective against lung cancer. This study is an exploratory study to evaluate the efficacy and safety between dosage groups by conducting a clinical trial in subjects requiring afatinib drug treatment in non-small cell lung cancer with EGFR mutation positive to determine the optimal dosage for HAD-B1 administration. At the final visit compared to before administration, each change in the disease control rate was measured according to the HAD-B1 doses of the test group 1 (972 mg), the test group 2 (1944 mg), and the control group. The efficacy and safety of HAD-B1 were compared and evaluated through sub-evaluation variables. As a result of the study, there was no statistically significant difference in the disease control rate at 12 weeks after dosing, but complete and partial remission were evaluated as 1 patient each in the test group 1, and none in the other groups. There was no statistically significant difference between groups in the sub-evaluation variable. In addition, there was no problem of safety from taking the test drug. However, the initially planned number of subjects was 66, but the number of enrolled subjects was only 14, which may limit the results of this study.
Introduction
Lung cancer is the most common malignant tumor worldwide. It is also the most common cause of cancer-related deaths, amounting to 135 000 deaths in 2020. 1 Non-small cell lung cancer (NSCLC) accounts for approximately 85% of all lung cancer cases. 2 Targeted treatments for epidermal growth factor receptor (EGFR), anaplastic lymphoma kinase (ALK), BRAF, and ROS1 have resulted in marked enhancements regarding survival rates, especially for patients with advanced disease. 3 The current standard of care for patients with locally advanced or metastatic NSCLC harboring epidermal growth factor receptor tyrosine kinase inhibitors (EGFR TKIs) mutations is the treatment with a first-generation or second-generation EGFR TKIs such as erlotinib, gefitinib, or afatinib.4,5 EGFR TKIs provide a beneficial treatment outcome in EGFR mutation-positive patients. A maximum response rate for these types of patients is 80%, and about 10 to 14 months of progression-free survival (PFS).6,7
Afatinib is an orally available, irreversible ErbB family blocker that can block signaling from human epidermal growth factor receptor 2 (HER2/ErbB2), EGFR (ErbB1), ErbB4, and other related ErbB family dimers. 8 Afinitib’s irreversible blocking action towards multiple ErbB family receptors results in more effective and prolonged suppression of receptor kinase activity than reversible first-generation EGFR TKIs. 9 Unfortunately, the disease still progresses with all types of EGFR TKIs. Thus, tumors must be characterized for further molecular aberrations to address drug resistance and provide suitable treatment.
Integration of traditional Korean medicines with conventional treatments can enhance the survival rates and diminish adverse effects. 10 In cancer treatments, the primary purposes of using herbal medicine are to inhibit creation of a microenvironment that allows cancer cells to grow, prevent cancer recurrence, improve the body’s immune system, and decrease side effects from conventional cancer treatment, including chemotherapy and radiotherapy.11,12 The efficacy of herbal medicine in combination with EGFR-TKI in reducing acquired resistance and prolonging PFS and OS has been shown in several clinical studies. 13 As the first and second line treatment in EGFR mutation-positive patients, the current study provides the first demonstrated evidence that the combination of herbal medicine and EGFR-TKI provides a superior PFS and OS compared to EGFR-TKI alone. 14
HAD-B1, an herbal aqueous extract, composed of 4 critical herbs (Panax notoginseng Radix, Cordyceps militaris, Panax ginseng C.A. Meyer, and Boswellia carteri Birdwood), was developed to focus on lung cancer treatment. Recently, the extracts of HAD-B1 and HAD-B have shown treatment efficacy in lung cancer patients. 15 Through in vitro and in vivo tests, HAD-B1 doses of 100, 200, and 400 mg/kg were tested, and dose-dependent efficacy and safety test results were secured, and HAD-B1 dose was determined by calculating HED (Human equivalent dose). Doses of 972 mg (corresponding to the dose 200 mg/kg) and HAD-B1 1944 mg/day (corresponding to the dose 400 mg/kg) were derived.
This study is a multi-center (Kosin University Gospel Hospital, Pusan National University, Yangsan Hospital, Konyang University Hospital), randomized, double-blind, placebo-controlled, and exploratory clinical trial. We attempted to evaluate whether afatinib with HAD-B1 can enhance the DCR (Disease Control Rate) for patients with EGFR mutation-positive and locally advanced or metastatic NSCLC and estimate the efficacy and safety of HAD-B1 for finding the proper dose.
Methods
Study Design
Institutional Review Board (No. KUGH-2018-06-015-002, NO. PNUH-2020007, NO. KYUH-2020-05-014) and Investigational New Drug (No. 20200119148) approved this study. The results were disseminated via peer-reviewed journals and the Clinical Research Information Service (CRIS), Republic of Korea, ID: KCT0003524, registered retrospectively on January 30, 2019.
This study was a randomized, double-blinded, placebo-controlled study attempting to examine the efficacy and safety of HAD-B1 (Table 1), for EGFR positive and locally advanced or metastatic NSCLC patients who need afatinib therapy. Besides, the results will provide a suitable dosage of HAD-B1 for the patients. Participants who consented were randomized in a 1:1:1 ratio into treatment group 1 (afatinib 40 mg/day plus HAD-B1 2 tablets [972 mg] plus placebo 2 tablets), treatment group 2 (afatinib 40 mg/day plus HAD-B1 4 tablets [1944 mg]), and control group (afatinib 40 mg/day plus placebo 4 tablets). Patients took the drugs for 12 weeks (Figure 1).
Ingredients of HAD-B1.


Study flow chart.
Initially, the number of subjects planned was 66, but due to limitations in the recruitment period and conditions, 14 subjects were recruited. Participants were randomly assigned into a group after a screening period when 14 subjects were administered the clinical drug at least once, and all of them were eligible for the clinical trial. Among the safety group, all of them underwent primary efficacy variable evaluation. Therefore, there were 14 patients in the full analysis set (FAS). In test group 2, 1 subject (R01-004) did not complete visit 3, 4, and 5, and in test group 1, 2 subjects (R01-001 and R02-005) subjects did not complete visit 4 and 5. Among the FAS analysis group, 3 subjects who withdrew their consent were disqualified by the per-protocol set (PPS) exclusion criteria. Therefore, 11 subjects were included in the PPS group.
Random numbers were assigned to each participant (test group 1: 5 subjects, test group 2: 3 subjects, control group: 6 subjects). The number of safety analysis subjects is 14 (test group 1: 5, test group 2: 3, control group: 6), FAS analysis subjects is 14 (test group 1: 5, test group 2: 3, control group: 6), and PPS analysis subjects is 11 (test group 1: 3, test group 2: 2, control group: 6).
Participants
Among all subjects registered in this clinical trial, those who meet the inclusion/exclusion criteria, are randomly assigned and have applied the product for clinical trials at least once are the safety set (SS). Among the SS, the subjects who were tested for the efficacy main evaluation variable at least once after application of the clinical trial product were used as FAS, and the subjects who completed the FAS in accordance with the clinical trial protocol were referred to as PPS.
There was no statistically significant difference between the groups in terms of sex ratio. Of the 14 FAS subjects: 4 were female (80.0%) in the test group 1, 2 (66.7%) in the test group 2, and 3 (50.0%) in the control group (P = .1499). (The mean age was 68.45 ± 15.6 years in the test group 1, 53.0 ± 12.1 years in the test group 2, and 71.3 ± 7.6 years in the control group. The control group’s average age was slightly higher, but there was no significant difference between these groups (P = .1268). The mean height was 156.0 ± 9.5 cm in test group 1, 161.4 ± 3.8 cm in the test group 2, and 158.3 ± 13.8 cm in the control group. Height was slightly larger in test group 2, but there was no significant difference between groups (P = .8055). The average body weight was 56.2 ± 13.9 kg in test group 1, 69.6 ± 11.9 kg in test 2, 63.1 ± 17.5 kg in control group, and was slightly larger in test group 2, but there was no significant difference between groups (P = .4995; Table 2).
Basic Demographic Data, FAS.
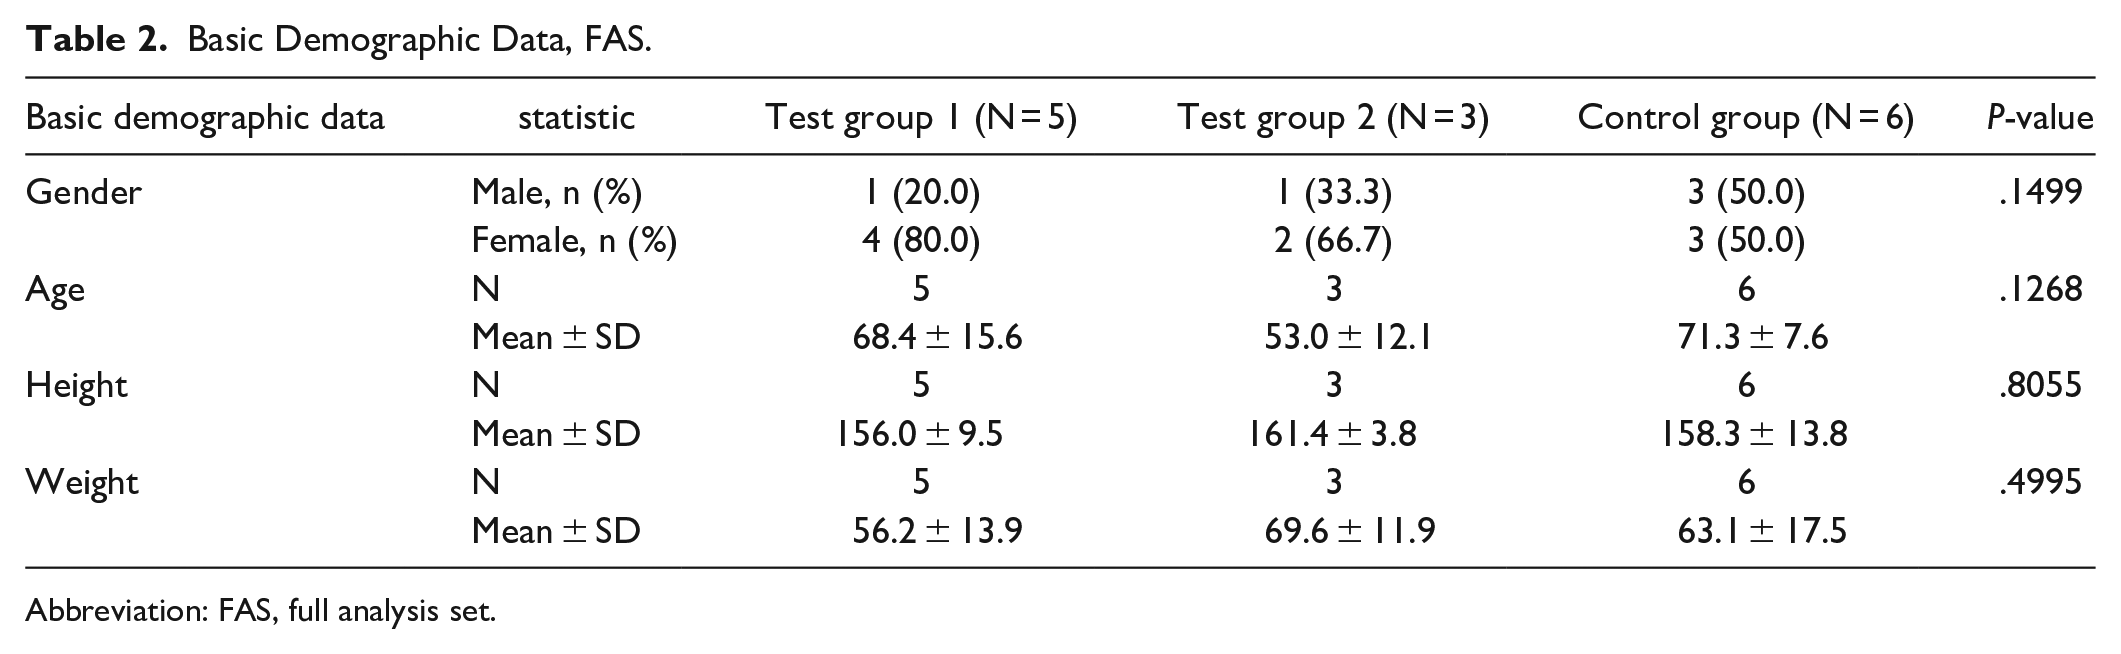
Abbreviation: FAS, full analysis set.
Inclusion Criteria
(1) Subjects who are over 19 years of age and diagnosed with locally advanced or metastatic NSCLC who cannot undergo surgery or radiation.
(2) Subjects who are histologically or cytologically positive for EGFR gene and require afatinib drug treatment.
(3) Subjects with lesions that can be measured by CT, Chest X-ray, MRI, etc. with a single diameter or 2 diameters.
(4) Those who are eligible for daily life performance ability (Eastern Cooperative Oncology Group Performance Status) 0 to 2.
(5) Those who have normal bone marrow function and solid organ function with an expected life of more than 6 months.
(1) Bone marrow function: Absolute neutrophil count ≥1.5×/L, platelet ≥10×/L, hemoglobin ≥10 g/dL.
(2) Liver function: Subjects whose aspartate aminotransferase (AST) and alanine aminotransferase (ALT) levels are less than twice the upper limit of normal.
(3) Kidney Function: Subjects with Creatinine Levels 2 times or less than the upper limit of normal.
(6) Those who voluntarily agreed in writing to participate in this clinical trial.
Exclusion Criteria
(1) Subjects who have experienced severe drug hypersensitivity reactions to certain drugs in the past or who are difficult to administer oral drugs.
(2) Pregnant or lactating patients (patients of childbearing potential need adequate contraception during the study period).
(3) Subjects whose cancers have metastasized to the central nervous system or are judged to require concurrent treatment, such as primary site radiation therapy, other anticancer drugs, or immunotherapy during the clinical trial period.
(4) Subjects with T790M mutation-positive (acquired, re-biopsy).
(5) Other serious diseases:
(1) Congestive heart failure or unstable angina without drug control.
Uncontrolled hypertension or high-risk arrhythmia if myocardial infarction occurs within 1 year of study participation.
(2) Neurological or psychiatric problems such as dementia and seizures prevent understanding of the research content
(3) Uncontrolled active infection (tuberculosis and hepatitis).
6) Subjects with a history of diagnosis or treatment of malignant tumors other than non-small cell lung cancer.
7) Subjects who participated in other clinical trials and co-administration of other research drugs except for afatinib within 2 weeks.
8) Persons who need an immune checkpoint inhibitor or platinum-based anticancer therapy after testing for PD-L1 expression in case of multiple metastases with symptoms.
9) Those who must take contraindicated medications during the clinical trial period.
10) A person who judges that the investigator is inappropriate as the subject of a clinical trial.
Outcome Measures
The primary outcome
Disease control rates were compared between group 1 (972 mg), group 2 (1944 mg), and the control group at week 0 (baseline) and week 12 (visit 5). Statistical significance between the test groups, and the control group were analyzed using chi-square. When statistical significance is found between the 3 groups, multiple comparison analysis was performed using the Bonferroni or Duncan method. Chi-square analyses between the control group and each test group were performed additionally.
The secondary outcomes
At the intermediate visit (visit 4, dosing 6 weeks), end visit (visit 5, dosing 12 weeks), the following measurements of the test groups and the control group were evaluated and compared to the baseline date:
(1) Complete response (CR), Partial Response (PR), and Stable Disease (SD).
(2) Progressive-free Survival (PFS).
(3) Time to Progression (TTP).
(4) QOL (EORTC QLQ-C30).
(5) CEA, NSE, Cyfra 21-1.
(6) Lymphocyte-monocyte ratio (LMR) and Neutrophil to lymphocyte ratio (NLR).
(7) Natural killer cell activity.
Statistically significant differences were measured using paired t-test or Wilcoxon signed rank test for changes. Descriptive statistics (number of subjects, mean, standard deviation, median, minimum, and maximum values) were presented for each administration group for the PFS and TTP at 5 visit points compared to the baseline. The difference between experimental groups (972 and 1944 mg) and the control group was analyzed by Kaplan-Meier survival analysis.
Safety Assessments
Abnormal case inspections, laboratory tests, vital signs measurement were conducted at week 0 (visit 2, baseline), which was before administering the investigational drug, and at the intermediate visit (visit 4), and lastly and week 12 (visit 5), which is after the administration of the drug.
Abnormal cases were evaluated throughout the study period. Also, periodical safety monitoring was performed through the laboratory tests for each radiotherapy and chemotherapy cycle.
We closely monitored any adverse events following the National Cancer Institute Common Terminology Criteria for Adverse Events, version 4.03 (NCI CTCAE version 4.03). 13
Statistical Analysis
The data obtained from these clinical trial subjects are primarily analyzed in 3 types: the safety group, FAS group, and the PPS group.
Safety group
The safety group included subjects who participated in this clinical trial and took at least 1 investigational drug or reference drug.
FAS group
In the FAS group, subjects whose primary endpoints were measured at least once after receiving the investigational drug were targeted. All subjects who were randomly assigned and received clinical trial drugs, except for the study subjects with the least justifiable reason for exclusion, were enrolled.
In this case, only the following among randomized subjects were excluded from the main analysis.
- Violation of major selection and exclusion criteria.
- Have not taken the investigational drug even once.
- When there is no data after randomization.
PPS group
The PPS group included subjects who completed this study according to the clinical trial protocol among subjects included in the FAS group.
In this case, only the following among randomized subjects were excluded from statistical analysis during PPS analysis.
- Those who violate the test plan.
- Those who take contraindicated medications, those with a continuous compliance of 80% or less, and those who do not comply with the visit period.
In principle, the main analysis of the efficacy data obtained from this study was performed in the FAS analysis group, and the PPS analysis group was additionally performed. Analysis of data on safety was performed in the safety analysis group. For demographic and health status, the characteristics of the data were evaluated utilizing the mean, standard deviation, maximum value, and minimum value through basic statistical analysis. In the case of continuous data, the average value of the test group and the control group were compared through ANOVA analysis. Categorical data were analyzed using the Chi-square test or Fisher’s exact test.
Results
Efficacy Results
The primary outcome
At 12 weeks after dosing, DCR was used as the main analysis in FAS (14 patients; test 1 group: 5, test 2 group: 3, control group: 6). In the test group 1, CR, PR, and PD were each 1 (20.0%), and 2 patients were not evaluated. In the test group 2, only SD was examined in 2 patients (66.7%), and 1 patient was not evaluated. In the control group, 4 SD patients (66.7%) and 1 PD (16.7%) were investigated, and 1 patient was not evaluated. CR was investigated only in the test group 1, but there was no statistically significant difference between groups (P = .4331; Table 3).
DCR Change in FAS and PPS.

Abbreviations: DCR, disease control rates; FAS, full analysis set; PPS, per protocol set.
At 12 weeks after dosing, DCR was used as the main analysis in PPS (11 patients; test 1 group: 3, test 2 group: 2, control group: 6). In the test group 1, CR, PR, and PD were each 1 (33.3%). In the test group 2, only SD was surveyed with 2 patients (100.%). In the control group SD was assessed in 4 patients (66.7%), PD in 1 patient (16.7%), and 1 patient was not evaluated. CR was investigated only in test group 1, but there was no statistically significant difference between groups (P = .2532; Table 3).
The secondary outcomes
CR, PR, and SD
Regarding CR, PR, and SD in FAS, at 6 weeks, 2 PR patients (40.0%) and 1 PD (20.0%) in test group 1 were investigated, and 2 were not evaluated. In the test group 2, only SD was examined in 2 patients (66.7%), and 1 patient was not evaluated. In the control group, 4 SD patients (66.7%) and 1 PD (16.7%) were investigated, and 1 patient was not evaluated. At 6 weeks, no CR was found in any treatment group, and there was no statistically significant difference between groups (P = .3798; Table 4). The 12-week time point was described in the principal evaluation analysis.
CR, PR, SD, in FAS and PPS.

Abbreviations: CR, complete response; PR, partial response; SD, stable disease; FAS, full analysis set; PPS, per protocol set.
For CR, PR, and SD in PPS, at 6 weeks, 2 PR patients (66.7%) and 1 patient PD (33.3%) in test group 1, and 2 SD patients (100.0%) in test group 2 were evaluated. In the control group were 4 SD patients (66.7%), and 2 patients were not evaluated. At 6 weeks, no CR was found in any treatment group, and there was no statistically significant difference between groups (P = .1848; Table 4). The 12-week time point was described in the main evaluation analysis.
PFS
In a comparison between groups for PFS at 12 weeks after administration, 4 patients (80.0%) in the test group 1, 3 patients (100.0%) in the test group 2 and 5 patients (83.3%) in the control group were first censored. There were 12 (85.7%) of the total 14 patients, and there was no statistically significant difference between groups (P = .1269).
TTP
PFS is the time from randomization to objective tumor progression or death, and the TTP is from randomization to observation of tumor progression; deceased patients whose progression was not confirmed were excluded. Therefore, since no subjects died in this clinical trial, TTP was the same as PFS, and was replaced by the analysis result of sub-evaluation variable 2, PFS.
QOL (EORTC QLQ-C30)
In FAS, the QOL (EORTC QLQ-C30) Functional score at baseline for test group 1 was 78.67 ± 17.96, and for test group 2 was 75.56 ± 22.22. For the control group it was 76.67 ± 11.13, showing no statistically significant difference between groups (P = .8081) The amount of change 6 and 12 weeks after the drug administration was −7.56 ± 17.18 and −11.56 ± 20.21 in the test 1 group, −2.22 ± 3.85 and −2.96 ± 4.63 in the test group 2, and 2.96 ± 5.56 and 1.11 ± 19.10 in the control group, respectively. It increased only in the control group rather than the test group 1 and group 2, but there was no statistical significance between the groups (P = .2340 and .1726; Table 5). There were no statistically significant differences within each group.
Changes of QOL (EORTC QLQ-C30) Functional 6 and 12 Weeks After Administration, in FAS and PPS.

Abbreviations: FAS, full analysis set; PPS, per protocol set.
In PPS, the QOL (EORTC QLQ-C30) Functional score at baseline for test group 1 was 87.41 ± 8.89, for test group 2 was 86.67 ± 15.71, and for control group was 76.67 ± 11.13, showing no statistically significant difference between groups (P = .2965). The amount of change 6 and 12 weeks after administration was −12.59 ± 22.26 and −19.26 ± 24.38 in the test 1 group, −1.11 ± 4.71 and −2.22 ± 6.29 in the test 2 group, respectively, and 2.96 ± 5.56 and 1.11 ± 19.10 in the control group, respectively. It increased only in the control group compared to the test group 1 and group 2, but there was no statistical significance between groups (P = .3294 and .1759; Table 5). There were no statistically significant differences within each group.
In FAS, the QOL (EORTC QLQ-C30) Symptom score at baseline for test group 1 was 26.15 ± 15.74, for the test group 2 was 32.48 ± 23.82, and for the control group was 22.22 ± 14.47, showing no statistically significant difference between groups (P = .8346). The amount of change 6 and 12 weeks after administration was 4.10 ± 13.88 and 2.05 ± 4.93 in the test group 1, respectively, −3.42 ± 5.34 and −2.56 ± 9.25 in the test group 2, respectively, and −5.98 ± 8.53 and −3.42 ± 9.68 in the control group, respectively. It decreased in the control group compared to the test group 1 and the test group 2, but there was no statistical significance between groups (P = .3568, P = .5207; Table 6). There were no statistically significant differences within each group.
Changes of QOL (EORTC QLQ-C30) Symptom 6 and 12 Weeks After Administration, in FAS and PPS.

Abbreviations: FAS, full analysis set; PPS, per protocol set.
In PPS, the QOL (EORTC QLQ-C30) Symptom score at baseline for test group 1 was 23.93 ± 14.12, for test group 2 was 19.23 ± 9.07, and for the control group was 22.22 ± 14.47, showing no statistically significant difference between groups (P = .7875). The amount of change 6 and 12 weeks after administration was 4.10 ± 13.88 and 2.05 ± 4.93 in the test group 1, respectively, −3.42 ± 5.34 and −2.56 ± 9.25 in the test group 2, respectively, and −5.98 ± 8.53 and −3.42 ± 9.68 in the control group, respectively. It decreased in the control group compared to the test group 1 and the test group 2, but there was no statistical significance between groups (P = .3568 and .5207; Table 6). There were no statistically significant differences within each group.
In FAS, the QOL (EORTC QLQ-C30) Global score at baseline for test group 1 was 58.33 ± 27.64, for test group 2 was 52.78 ± 37.58, and for the control group was 54.17 ± 11.49, showing no statistically significant difference between groups (P = .9393). The amount of change 6 and 12 weeks after administration was −13.30 ± 30.39 and −13.33 ± 29.81 in the test group 1, −5.56 ± 9.62 and −8.33 ± 22.05 in the test group 2, respectively, and −8.33 ± 27.89 and 1.39 ± 14.35 in the control group, respectively. It was decreased in the test group 2 at 6 weeks after administration, and increased in the control group compared to the test group 1 and test group 2 at 12 weeks after administration, but there was no statistical significance between groups (P = .9645 and .3504; Table 7). There were no statistically significant differences within each group.
Changes of QOL (EORTC QLQ-C30) Global at 6 and 12 Weeks After Administration in FAS and PPS.

Abbreviations: FAS, full analysis set; PPS, per protocol set.
In PPS, the QOL (EORTC QLQ-C30) Global score at baseline for test group 1 was 75.00 ± 22.05, for test group 2 was 70.83 ± 29.46, and for the control group was 54.17 ± 11.49, showing no statistically significant difference between groups (P = .2025). The amount of change 6 and 12 weeks after administration was −22.22 ± 39.38 and −22.22 ± 38.49 in the test group 1, −8.33 ± 11.79 and −12.50 ± 29.46 in the test group 2, respectively, and −8.33 ± 27.89 and 1.39 ± 14.35 in the control group, respectively. It was decreased in the test group 1 at 6 weeks after administration, and increased in the control group compared to test 1 and test 2 at 12 weeks after administration, but there was no statistical significance between groups (P = .8073 and .3667; Table 7). There were no statistically significant differences within each group.
Tumor markers
In FAS, CEA at baseline was 75.18 ± 130.89 in test group 1, 14.47 ± 17.16 in test group 2, and 19.68 ± 39.45 in the control group, showing no statistically significant difference between groups (P = .3700). After 6 and 12 weeks, the amount of change was −33.35 ± 67.44 and −39.35 ± 81.85 in test group 1, 24.92 ± 43.89 and 15.33 ± 27.17 in test group 2, respectively, and −4.50 ± 13.41 and −5.55 ± 31.49 in the control group, respectively. At 6 and 12 weeks after administration, test group 1 and test group 2 showed an increase compared to the control group, but there was no statistical significance between groups (P = .4208 and .4004; Table 8). There were no statistically significant differences within each group.
Changes in CEA at 6 and 12 Weeks After Administration in FAS and PPS.

Abbreviations: CEA, carcinoembryonic antigen; FAS, full analysis set; PPS, per protocol set.
In PPS, CEA at baseline was 105.07 ± 175.57 in test group 1, 17.91 ± 22.75 in test group 2, and 19.68 ± 39.45 in the control group, showing no statistically significant difference between groups (P = .6951). After 6 and 12 weeks, the amount of change was −51.42 ± 88.50 and −61.42 ± 107.39, in the test group 1, 37.38 ± 54.05 and 22.99 ± 33.53 in the test group 2, and −5.95 ± 13.12 and −7.01 ± 31.31 in the control group, respectively. At 6 and 12 weeks after administration, the test group 1 and group 2 showed a significant increase compared to the control group, but did not show statistical significance between groups (P = .5106 and .5106; Table 8). There were no statistically significant differences within each group.
In FAS, NSE at baseline was 16.84 ± 9.60 in the test group 1, 13.63 ± 6.10 in the test group 2, and 17.87 ± 15.86 in the control group, showing no statistically significant difference between groups (P = .9962). Changes 6 and 12 weeks after administration were −5.16 ± 11.48 and −6.08 ± 10.72 in the test group 1, −0.63 ± 1.64 and 0.03 ± 0.25 in the test group 2, and 0.33 ± 2.26 and −0.80 ± 3.76 in the control group, respectively. The control group showed an increase at 6 weeks after administration, and the test group 2 showed an increase at 12 weeks, but there was no statistical significance between groups (P = .8407 and .2521; Table 9). There were no statistically significant differences within each group.
Changes of NSE 6 and 12 Weeks After Administration, in FAS and PPS.

Abbreviations: NSE, neuron-specific enolase; FAS, full analysis set; PPS, per protocol set.
NSE at baseline in PPS was 14.10 ± 3.32 in test group 1, 13.70 ± 8.63 in test group 2, and 17.87 ± 15.86 in the control group, showing no statistically significant difference between groups (P = .9625). Changes 6 and 12 weeks after administration were −0.27 ± 4.19 and −1.80 ± 2.25 in the test group 1, −0.95 ± 2.19 and 0.05 ± 0.35 in the test group 2, and −10.27 ± 20.39 and −11.40 ± 19.90 in the control group, respectively. At 6 and 12 weeks after administration, the decrease in the control group was significant, but there was no statistical significance between groups (P = .9028 and .3422; Table 9). There were no statistically significant differences within each group.
In FAS at baseline, Cyfra 21-1 was 11.02 ± 15.11 in test group 1, 3.27 ± 2.79 in test group 2, and 2.07 ± 0.67 in the control group, showing no statistically significant difference between groups (P = .1023). The amount of change 6 and 12 weeks after administration was −7.14 ± 13.08 and −6.14 ± 13.76 in test group 1, −1.80 ± 2.54 and −1.37 ± 1.95 in test group 2, and 0.13 ± 1.19 and 0.50 ± 1.130 in the control group, respectively. There was a significant increase in the control group at 6 and 12 weeks after administration, but there was no statistical significance between groups (P = .4228 and .4704; Table 10). There were no statistically significant differences within each group.
Changes of Cyfra 21-1 at 6 and 12 Weeks After Administration, in FAS and PPS.

Abbreviations: Cyfra, cytokeratin fragment; FAS, full analysis set; PPS, per protocol set.
The baseline of Cyfra 21-1 in PPS was 4.50 ± 3.87 in test group 1, 4.10 ± 3.39 in test group 2, and 2.07 ± 0.67 in the control group, showing no statistically significant difference between groups (P = .2541). The amount of change 6 and 12 weeks after administration was −2.00 ± 4.81 and −0.33 ± 5.65 in test group 1, −2.70 ± 2.83 and −2.05 ± 2.19 in test group 2, and −0.75 ± 1.90 and −0.39 ± 2.06 in the control group, respectively. The control group’s increase was slightly more significant at 6 and 12 weeks after administration, but there was no statistical significance between groups (P = .6133 and .4889; Table 10). There were no statistically significant differences within each group.
Inflammatory factors
The baseline of LMR in FAS was 1.40 ± 0.55 in test group 1, 1.33 ± 0.58 in test group 2, and 1.50 ± 0.55 in the control group, showing no statistically significant difference between groups (P = .8893). Changes 6 and 12 weeks after administration were −0.30 ± 0.45 and 0.00 ± 0.71 in test group 1, 0.00 ± 1.00 and 0.00 ± 1.00 in test group 2, and 0.00 ± 0.00 and −0.17 ± 0.41 in the control group, respectively. At 6 weeks after administration, the decrease in the test group 1 and the control group at 12 weeks was somewhat significant, but there was no statistical significance between groups (P = .4450 and .9015; Table 11). There were no statistically significant differences within each group.
Changes of LMR at 6 and 12 Weeks After Administration, in FAS and PPS.

Abbreviations: LMR, lymphocyte-monocyte ratio; FAS, full analysis set; PPS, per protocol set.
The baseline of LMR in PPS was 1.00 ± 0.00 in test group 1, 1.50 ± 0.71 in test group 2, and 1.50 ± 0.55 in the control group, showing no statistically significant difference (P = .3425). Changes 6 and 12 weeks after administration were −0.17 ± 0.29 and 0.33 ± 0.58 in est group 1, −0.50 ± 0.71 and −0.50 ± 0.71 in test group 2, and 0.00 ± 0.00 and −0.17 ± 0.41 in the control group, respectively. At 6 weeks after administration, the decrease in test group 1 and the control group was slightly greater at week 12, but there was no statistical significance between groups (P = .2158 and .2163; Table 11). There were no statistically significant differences within each group.
In FAS, the baseline of NLR was 0.90 ± 0.22 in test group 1, 0.83 ± 0.29 in test group 2, and 0.92 ± 0.20 in the control group, showing no statistically significant difference between groups (P = .8542). Changes 6 and 12 weeks after administration were 0.00 ± 0.00 and −0.10 ± 0.22 in test group 1, 0.17 ± 0.29 and 0.17 ± 0.29 in test group 2, and 0.00 ± 0.32 and 0.08 ± 0.20 in the control group, respectively. At 6 and 12 weeks after administration, there was a slight increase in test group 2, but there was no statistical significance between groups (P = .5542 and .2518; Table 12). There were no statistically significant differences within each group.
Changes of NLR at 6 and 12 Weeks After Administration, in FAS and PPS.

Abbreviations: NLR, neutrophil to lymphocyte ratio; FAS, full analysis set; PPS, per protocol set.
In PPS, the baseline of NLR was 1.00 ± 0.00 in test group 1, 0.75 ± 0.35 in est group 2, and 0.92 ± 0.20 in the control group, showing no statistically significant difference between groups (P = .3962). The amount of change 6 and 12 weeks after administration was 0.00 ± 0.00 and −0.17 ± 0.29 in test group 1, 0.25 ± 0.35 and 0.25 ± 0.35 in test group 2, and 0.00 ± 0.32 and 0.08 ± 0.20 in the control group, respectively. At 6 and 12 weeks after administration, there was a slight increase in test group 2, but there was no statistical significance between groups (P = .4842 and .2163; Table 12). There were no statistically significant differences within each group.
Natural killer cell activity
The baseline of natural killer cell activity in FAS was 540.01 ± 746.05 in test group 1, 175.91 ± 35.79 in test group 2, and 897.32 ± 977.11 in the control group, showing no statistically significant difference between groups (P = .9387). Changes after 6 and 12 weeks were −146.29 ± 787.88 and −8.67 ± 1014.64 in test group 1, 378.71 ± 651.01 and 288.03 ± 358.31 in test group 2, and −145.42 ± 698.93 and −53.85 ± 765.49 in the control group, respectively. At 6 and 12 weeks after administration, the increase in the test group 2 was significant, but there was no statistical significance between groups (P = .8791 and .8333; Table 13). There were no statistically significant differences within each group.
Changes of Natural Killer Cell Activity at 6 and 12 Weeks After Administration, in FAS and PPS.

Abbreviations: FAS, full analysis set; PPS, per protocol set.
The baseline of natural killer cell activity in PPS was 269.59 ± 293.16 in test group 1, 195.87 ± 13.11 in test group 2, and 897.32 ± 977.11 in the control group, showing no statistically significant difference between groups (P = .9116). The amount of change after 6 and 12 weeks was 248.35 ± 335.37 and 477.72 ± 791.73 in test group 1, 568.06 ± 795.30 and 433.39 ± 362.70 in test group 2, and −145.42 ± 698.93 and −53.85 ± 765.49 in the control group, respectively. At 6 and 12 weeks, the increase in test group 2 was significant, but there was no statistical significance between groups (P = .4724 and .5666; Table 13). There were no statistically significant differences within each group.
Safety Result
The total number of adverse events that were expressed during the clinical trial period was 26, 100.0% (5/5 patients, 11 events) in test group 1, 66.7% (2/3 patients, 5 events) in test group 2, and 83.3% (5/6 patients, 10 events) in the control group. There was no statistically significant difference in the expression rate between groups (P = .6703). The number of adverse drug reactions evaluated to be related to the investigational clinical trial product was 4 events, 20.0% (1/5 persons, 1 event) in test group 1, and 33.3% (1/3 persons, 2 events) in test group 2, and 16.7% (1/6 persons, 1 event) in the control group. There was no statistically significant difference in the expression rate between groups (P = 1.0000). There were 2 serious adverse events, and 20.0% (1/5 patients, 2 events) were expressed only in test group 1. There was no statistically significant difference in expression rates between groups (P = .5714; Table 14).
Summary of the Occurrence of Adverse Events, in SS.

Abbreviation: SS, safety set.
The distribution of abnormal events by type was based on the number of events, and in the major category, 7 events of gastrointestinal disorders (4 events in test group 1, 2 events in test group 2, and 1 event in the control group) were investigated, and 6 infections and infestations (2 events in test group 1, 2 events in test group 2, and 3 events in the control group), followed by 3 eye disorders (1 event in test group 1, 1 event in test group 2, and 1 event in the control group).
In the subcategory, diarrhea (1 event in test group 1, 1 event in test group 2, 1 event in the control group) and paronychia (1 event in test group 1, 0 events in test group 2, 1 event in the control group) were most frequently expressed in 3 cases. Stomatitis (2 events in test group 1, 0 event in test group 2, and 3 events in the control group) and the upper respiratory tract infection (0 events in test group 1, 0 event in the group 2, and 2 events in the control group) were expressed.
The distribution of adverse drug reactions by type was based on the number of occurrences, and for gastrointestinal disorders, 1 event of diarrhea was expressed in test group 1 and the control group.
Nausea, decreased appetite of metabolism, and nutrition disorders were expressed 1 event each in test group 2. All recovered to NCI-CTCAE grade 1 or 2, and there was no AE above grade 3.
According to the distribution of severe abnormalities by type, based on the number of occurrences, for vascular disorders, 1 event of embolism and for nervous system disorders, 1 event of hemiparesis were expressed in test group 1. Group1 reported 4 adverse events, of which there were 1 case of vascular disorder, 1 case of embolism, 1 case of nervous system disorders, and 1 case of hemiparesis. These numbers are by events not the number of people.
One serious adverse event was found to be related to the subject’s underlying disease and not to the test drug. The subject had underlying diseases of hypertension and diabetes. After randomization, HAD-B1 was administered at a dose of 972 mg/day for 11 days and then stopped. About 15 days after the randomization and the drug administration, the patient reported having difficulty using a spoon with the right hand and appeared to have a significantly weak right arm. The patient was diagnosed with hemiparesis as well as reported as an adverse event. The patient was hospitalized and closely monitored. After a week, the patient regained arm strength, showing usual and even arm resistance and discharged. This serious adverse event was concluded to be related to the subject’s underlying disease and not to the test drug. After hospitalization, without another dose, cyanosis of the patient’s left finger was observed and was reported as embolism. After administering an anticoagulant, the symptoms gradually improved, and the symptoms disappeared and the patient was discharged. This was also determined to be not related to the experimental drug. There were no severe or expected drug reactions observed additionally.
Out of the 26 adverse events during the clinical trial period, 16 events were Grade 1, 9 events were Grade 2, and 1 event was Grade 3 was 1 event. In the causal relationship with HAD-B1, 22 events were unrelated, and 4 events were related. According to the measures of the abnormal event, 22 events of no action and 4 events of permanent suspension were investigated. Classifying adverse cases according to medicines and therapy, 6 events were not attributed to combination drugs/therapy and 20 events were attributed combination drugs/therapy.
In laboratory tests, there was no statistically significant difference in the amount of change in each group at the time of screening and 12 weeks after administration, so there was no problem with safety as the investigational drug did not affect liver and renal function.
Discussion
The second-generation EGFR TKI, afatinib, is an irreversible EGFR TKI which has more forceful EGFR inhibition and also targets other ErbB-family members. According to the LUX-Lung 3 and LUX-Lung 6 studies, afatinib had a significantly better response rate and more prolonged progression-free survival (PFS) than pemetrexed plus gemcitabine or plus cisplatin in patients with untreated advanced lung adenocarcinoma harboring activating EGFR mutations. 7 With the rare mutation pattern in patients, afatinib, the second-generation EGFR TKI, showed more significant benefit and longer PFS than the first-generation EGFR TKIs, erlotinib and gefitinib. Suppression of autophagy using 2 kinds of autophagy inhibitors, 3-MA and CQ, could significantly enhance afatinib-induced cytotoxicity as well as apoptosis in H1975 and H1650 cells. These observations showed the cytoprotective role of autophagy in afatinib-treated H1975 and H1650 cells, propounding that abolishing autophagy could enhance the anti-lung adenocarcinoma effect of afatinib in vitro. 16 This discovery is similar to that of the LUX-Lung clinical trials, in which afatinib showed clinical activity in patients with uncommon mutations G719X, S768I, and L861Q. 17 In addition, G719X and S768I mutations often coexist with other uncommon mutations, and NSCLC patients harboring these mixture mutations showed high rates of response and long response duration with afatinib. 18 These studies suggest that for NSCLC patients with G719X and S768I mutations afatinib is clinically effective. Although the majority EGFR-mutant NSCLC patients have a good response to EGFR-TKI at first, drug resistance is inescapable. Therefore, it is necessary to assure the gene status in patients with acquired drug resistance after the first generation of TKI drug treatment, as it can stipulate the direction of subsequent treatment.
Though afatinib showed better availability in patients with the rare mutation pattern, the benefit did not show lengthened OS when compared with gefitinib. Such findings are similar to those of the LUX-Lung 7 clinical trial, which verified no important difference in OS between afatinib and gefitinib. 19 Besides, rather than the expected profits of it, application of afatinib resulted in high occurrence of adverse effects such as diarrhea and rash and acquired resistance, which also eventuated when patients were cured with afatinib as first-line therapy.20,21
As complementary and integrative medicine access becomes significant in cancer care, a comprehensive strategy including lifestyle in addition to conventional medical treatments is acquiring importance. 22 Studies have shown that herbal medicine has advantageous effects on curing cancer, delaying cancer progression, reducing the complications caused by chemotherapy, and diminishing adverse events. 23
HAD-B1 is a mixed herbal extract composed of Panax Notoginseng Radix, Cordyceps militaris, Panax ginseng C. A. Meyer, and Boswellia carteri Birdwood. According to prior study, HAD-B1 obstructed solid tumors’ growth compared to a cisplatin-treated control group in an A549 cell xenograft mouse model. 24 A tumor growth experiment using H1975 tumor xenograft mice identified the synergic effect of combined treatment of afatinib and HAD-B1. 25 Panax Notoginseng is used to stop bleeding and relieve pain. 26 Panax ginseng C.A. Meyer is a widely known Korean medicine and its diverse biological actions include immunoregulatory, anti-aging, anti-cancer activity and neuroregulation. 27 Cordycepin, an important compound from Cordyceps militaris, brings about apoptosis and prevents proliferation of human H1975 lung cancer cells. 28 Therefore, we investigated the effective dose of HAD-B1 as a natural anticancer drug and evaluated its safety in subjects requiring more than 4 cycles (3 weeks/cycle) of afatinib drug treatment in EGFR mutation-positive local advanced or metastatic NSCLC.
In this study, the number of subjects required for each group was calculated as a total of 45 subjects, 15 subjects per group, taking into account the number of subjects that could be recruited during the study period, the minimum range for efficacy evaluation, and the dropout rate. Considering the dropout rate for each group as 30%, the number of subjects to be enrolled per group was 15 and for appropriate efficacy evaluation, and the total number was 66 in 3 groups. However, due to the short recruitment period, the small number of research institutes, and the limited number of subjects, the target number of subjects was not reached.
At 12 weeks after administration, which is the main evaluation in terms of the efficacy of HAD-B1 as a natural anticancer drug in subjects requiring more than 4 cycles (3 weeks/cycle) of afatinib treatment in locally advanced or metastatic NSCLC with EGFR mutation-positive of HAD-B1, there was no statistically significant difference in DCR in the FAS group (P = .4331). But CR and PR were evaluated as 1 patient in test group 1, and no subjects were evaluated as CR and PR in test group 2 and the control group. Likewise there was no statistically significant difference in DCR in PPS groups (P = .2532).
There were no clinically significant adverse events, adverse drug reactions, and serious adverse events in terms of safety, and there were no problems with safety from taking the test drug. A total of 26 abnormal cases were found during the study period, but no causal relationship with HAD-B1 was found. There were no clinically significant results in other safety evaluation items. In laboratory tests, there were no significant changes before and after the study, so it is considered that there is no problem with the safety of the liver and kidneys.
The results of this study show that in subjects requiring more than 4 cycles (3 weeks/cycle) of afatinib treatment in locally advanced or metastatic NSCLC with positive EGFR gene, the effective dose of HAD-B1 as a natural anticancer drug did not have a statistically significant difference in efficacy evaluation variables. Regrettably, there were no efficacy evaluation variables that showed statistically significant differences in the effective dose of HAD-B1 due to the small number of subjects. However CR and PR were demonstrated by 1 patient in test group 1, and there was no problem with significant safety.
Therefore, the results of this clinical trial are that HAD-B1 is partially effective as a natural anticancer drug in subjects requiring more than 4 cycles (3 weeks/cycle) of afatinib treatment in local advanced or metastatic NSCLC with positive EGFR gene. Afatinib + HAD-B1 972 mg/day was selected as the effective dose of the observed HAD-B1 test group 1, and based on this exploratory study, it is necessary to observe safety and efficacy through follow-up studies. In addition, further studies based on a number of subjects to determine the effective dose and safety in combination therapy with HAD-B1 and afatinib are expected in the future. There were no clinically significant adverse reactions in terms of safety, but since 26 adverse reactions and 4 adverse reactions related to HAD-B1 were observed, further studies are needed. In addition, when the study was initially planned, the target number of subjects was 66, but the number of subjects recruited was 14, which did not reach the planned target number, so the reliability of this study result may be limited. Therefore, in order to obtain reliable and more meaningful research results, additional research should be conducted by designing research institutes and recruitment periods so that subjects can be sufficiently recruited.
Conclusion
HAD-B1 test group 1 showed partial efficacy as a natural anticancer drug in subjects requiring more than 4 cycles (3 weeks/cycle) of afatinib treatment in EGFR gene-positive local advanced or metastatic NSCLC. The combination of afatinib and HAD-B1 972 mg/day was found to be the most effective dose. However, this study was conducted by recruiting only 14 out of 66 patients, which was originally planned, and the results may be limited.
Footnotes
Declaration of Conflicting Interests
The author(s) declared no potential conflicts of interest with respect to the research, authorship, and/or publication of this article.
Funding
The author(s) disclosed receipt of the following financial support for the research, authorship, and/or publication of this article: This research was supported by a grant from the Korea Health Technology R&D Project through the Korea Health Industry Development Institute (KHIDI) funded by the Ministry of Health & Welfare, Republic of Korea (grant number: HI15C0006 and HI19C1046).