
Abstract
Epidermal growth factor receptor mutation-positive non–small cell lung cancer is cared for mainly by target therapeutics in the clinical treatment at present. We investigated the antitumor effect of HangAmDan-B1 (HAD-B1) combined with afatinib on H1975 (L858R/T790M double mutation) lung cancer cells. The combined treatment of HAD-B1 with afatinib inhibited the proliferation of H1975 cells in a dose-dependent manner compared with the treatment of afatinib or HAD-B1 alone. The combined treatment group significantly induced early apoptosis and cell cycle arrest of the cells compared with afatinib- or HAD-B1-treated control group. Profile analysis of cell cycle proteins in H1975 cells treated with the combination of HAD-B1 and afatinib using InnoPharmaScreen antibody microarray showed downregulation of pERK1/2 and upregulation of p16 in the cells. In vivo tumor growth assay in xenograft animal model of human H1975 lung cancer cells revealed that the mean tumor volume in the group treated with the combination of HAD-B1 and afatinib showed a significant reduction compared with the control groups.
Introduction
Lung cancer is the most common malignancy worldwide and is ranked as the first cause of cancer-related mortality for both men and women. 1 Non–small cell lung cancer (NSCLC) accounts for up to 85% of all lung cancers and more than 40% of NSCLC patients are diagnosed with metastatic (Stage IV) disease. 2 In the past decade, the landscape of advanced NSCLC therapies has been rapidly evolving beyond chemotherapy with the discovery of oncogenic driver mutations. 3 Somatic epidermal growth factor receptor (EGFR) mutations are present in approximately 50% of patients in Asia and in 10% to 15% of Caucasian patients with metastatic NSCLC. 4 Most of these mutations are caused by deletion on the exon 19 or L858R point mutations on exon 21. 5 EGFR tyrosine kinase inhibitors (TKIs) such as erlotinib, gefitinib, and afatinib have demonstrated an improved tumor response rate and prolonged progression-free survival compared with standard chemotherapy. 6 However, despite an initial dramatic response to EGFR-TKIs, acquired resistance usually occurred when patients were treated with EGFR inhibitors for 10 to 14 months. 7 Much evidence identified that more than 50% of the EGFR-TKI resistance is caused by a T790M point mutation in the catalytic cleft of the EGFR tyrosine kinase domain. 8 Afatinib is an irreversible second-generation EGFR-TKI that inhibits all ErbB family members by forming covalent bonds to the receptors. 9 Its irreversible inhibition could be potentially effective in inhibiting EGFR T790M-derived signaling pathway and provide more improved clinical benefit than the reversible first-generation EGFR-TKIs.9-12 However, acquired resistance also occurred when patients were treated with afatinib as first-line therapy, 13 and adverse effects such as rash and diarrhea of grade ≥3 were significantly more frequent with afatinib therapy than with erlotinib or gefitinib therapy. 14 Therefore, it is necessary to discover adjuvant natural product drugs that have few side effects and high efficiency against NSCLC on account of the shortcomings of current drugs to overcome EGFR-TKI resistance and prolong the survival of patients with NSCLC. HangAmDan-B1 (HAD-B1), the upgraded version of HangAmDan-B (HAD-B), is used as an anticancer medication at the East West Cancer Center (EWCC; Dunsan Korean Medicine Hospital, Daejeon University, Korea). Several studies supported the anticancer effect of HAD-B in various cancer cells including human NSCLC cells.15-19 HAD-B1, a herbal aqueous extract, composed of 4 critical herbs (Panax Notoginseng Radix, Cordyceps militaris, Panax ginseng CA Mey, and Boswellia carteri Birdw), was developed to focus on lung cancer treatment. This study was conducted to investigate the anticancer effects of the HAD-B1 combined with afatinib on H1975 EGFR-L858R/T790M double mutation lung cancer cells with the biological mechanism and solid tumor growth in nude mice bearing a H1975 human lung cancer xenograft.
Materials and Methods
Preparation of HAD-B1 Extract
HAD-B1 was provided by the EWCC. A voucher specimen (#HAD-B-1-2014-10-HS) has been deposited at the Institute of Traditional Medicine and Bioscience in Daejeon University. The ingredients of the herb mixture (HAD-B1) were soaked for 18 hours in a soaking bath at 60°C of distilled water (DW) and the supernatant was obtained. The extracts were concentrated by using a rotary vacuum evaporator at 60°C for 2 hours and were dried on a flat evaporator at 60°C for 8 hours, and the powder produced was used for the experiments (Table 1). 20 The HAD-B1 was dissolved in DW.
Ingredients of HangAmDan-B1 (HAD-B1). 20

High-Performance Liquid Chromatography (HPLC) Analysis of HAD-B1
The HAD-B1 stock was prepared by extracting HAD-B1 powder with 1 mg of powder in 10 mL of DW at room temperature. The extract was then centrifuged at 1000 × g for 30 minutes and filtered and applied to the C18 column and eluted using acetonitrile mixed with DW. Figure 1 shows the results of HPLC of HAD-B1 fractions.
Cell Culture
H1975 (EGFR-L858R/T790M double mutation human lung cancer) cells were cultured in RPMI1640 containing 10% fetal bovine serum and 1X antibiotics (Welgene, Daejeon, Korea). The H1975 cells cultures were maintained at 37°C in a humidified atmosphere with 5% CO2.
In Vitro H1975 Cell Proliferation Assay
H1975 cells (2 × 10³ cells/well) were added to 96-well tissue culture plates coated with gelatin and allowed to adhere overnight. The cells were treated with HAD-B1 and afatinib that had been incubated for 72 hours. Then, 50 µL of a 1 mg/mL MTT solution was added to each well, and the cells were incubated for 2 hours at 37°C. After the supernatants had been discarded, the residual formazan crystals were dissolved in 100 µL of dimethyl sulfoxide. The absorbance was measured at 595 nm on an ELISA plate reader (EMax, Molecular Devices, San Jones, CA). The measurements were made in triplicate.
Annexin V/Dead Cell and Cell Cycle Analysis
The H1975 cells were treated with HAD-B1 for 24 hours and 48 hours, respectively. Cell viability and apoptosis were determined using the MUSE Annexin V and dead cell kit in accordance to the recommended protocol. Cell cycle analysis was measured with Muse cell cycle kit (Merck Millipore, Billerica, MA).
Caspase Activity Assay
The H1975 cells were collected by using trypsin-ethylenediaminetetraacetic acid (EDTA) after incubation with HAD-B1 and afatinib for 72 hours. Collected cells were centrifuged, the supernatant was discarded, and the remaining cell pellet was incubated with lysis-M solution on ice for 15 minutes. After incubation, the lysed cells were centrifuged, and the amount of protein in the supernatant was quantified. Protein, 100 µg/50 µL, was added into the wells in the 96-well plate, and a 1 M DTT (dithiothreitol) dilution was used to reach the final concentration of 0.1 M in each well. Then, 5 µL of LEHD-pNA was added to each well, and the plate was incubated at 37°C for 2 hours. The absorbance was measured at 405 nm by using a microplate reader.
Protein Extraction From H1975 Cells and the Fluorescence Labeling
H1975 cells were serum-starved by incubation in RPMI1640 for 4 hours. The cells were treated with or without HAD-B1. After 72 hours incubation, the cells were washed twice with phosphate-buffer saline (PBS) and harvested in 5-mM trypsin-EDTA. The harvested cells were centrifuged for 15 minutes at 1800 rpm. The pellets were washed with PBS and recentrifuged. H1975 cells were extracted with Lysis-M (Roche, Mannheim, Germany) mammalian cell extraction buffer. Each protein extract (100 mg, 1 mg/mL) was labeled with both Cyanine3 and Cyanine5 (GE Healthcare, Buckinghamshire, UK) as per the manufacturer’s instructions. Free dyes were removed with Sigma Spin columns (S5059, Sigma, St Louis, USA) and purified samples were stored at 4°C until use.
Preparation of InnoPharmaScreen (IPS)-Forward Phase Antibody Array (FPAA)
Forty-two distinct antibodies against the proteins involved in cell proliferation were spotted onto IPS antibody arrays in duplicate (Figure 3C). The detailed procedure for the array analysis has been described elsewhere. 17
Profile Analysis of Cell Cycle Proteins Using IPS-FPAA
The fluorescence-labeled cell lysates were applied to the antibody array and incubated for 1 hour at 37°C in the dark. The slides were washed 3 times with phosphate-buffered saline with tween (PBST), dried with N2, and analyzed by using a fluorescence microarray scanner. The antibody array slides were scanned by using a GenePix 4100A microarray scanner (Axon Instruments, Union City, CA) with 532- and 635-nm lasers. Image analysis was performed for each spot by using the manufacturer’s software package (GenePix 6.0, Axon Instruments). The internally normalized ratios of all spots were calculated by using a procedure that is described elsewhere. 21
Western-Blot Analysis
H1975 cells were incubated with HAD-B1 and with afatinib in RPMI1640 (2%
In Vivo Tumor Growth Assay in Xenograft Animal Model of Human H1975 Lung Cancer Cells
H1975 cells were injected subcutaneously to generate a xenograft model in mice. Once the tumor size reached 100 mm3, HAD-B1 and afatinib were administered orally once daily for 30 days, during which time the tumor size and body weight were checked daily. Blood biochemical tests were carried out using an automatic biochemical analyzer (HITACHI, Tokyo, Japan). All care and handling of the animals were performed according to the Guide for the Care and Use of Laboratory Animals (HTRC-16-37(1)).
Statistical Analysis
All data are expressed as the mean ± standard deviation, and statistical comparisons were performed using a Student’s t test. Caspase activity data were compared using 1-way analysis of variance with post hoc Dunnett’s test. Statistical analyses were performed using Microsoft Office Excel version 2007 (Microsoft Corporation, Redmond, WA). P < .05 was considered to indicate a statistically significant difference.
The combination index (CI) is widely used to quantify drug synergism based on the multiple drug effect equation of Chou-Talalay.22,23 The CI values were determined for each concentration of afatinib, HAD-B1, and their combination in cell proliferation assays using CompuSyn (ComboSyn, Inc, Paramus, NJ; Table 2). CI < 0.9 indicates synergism, CI = 0.9 to 1.10 indicates additive interaction, and CI > 1.10 indicates antagonism. 22
Combination Index (CI) Analysis of HAD-B1 Combined With Afatinib at a Nonconstant Ratio in H1975 Cells a .

Data are values from Figure 2.
CI = 1.00, additive; CI < 1.00, synergistic; CI > 1.00, antagonistic.
Results
Profiling of Major Components in HAD-B1 Using on HPLC Analysis
HAD-B1 is an anticancer medication developed to focus on lung cancer treatment. It is composed of 4 herbs that have positive effects on lung cancer. The 3-dimensional HPLC analysis of HAD-B1 showed the presence of 6 critical compounds including cordycepin, R1, Rg1, Rb1, α-boswellic acid, and β-boswellic acid (Figure 1).
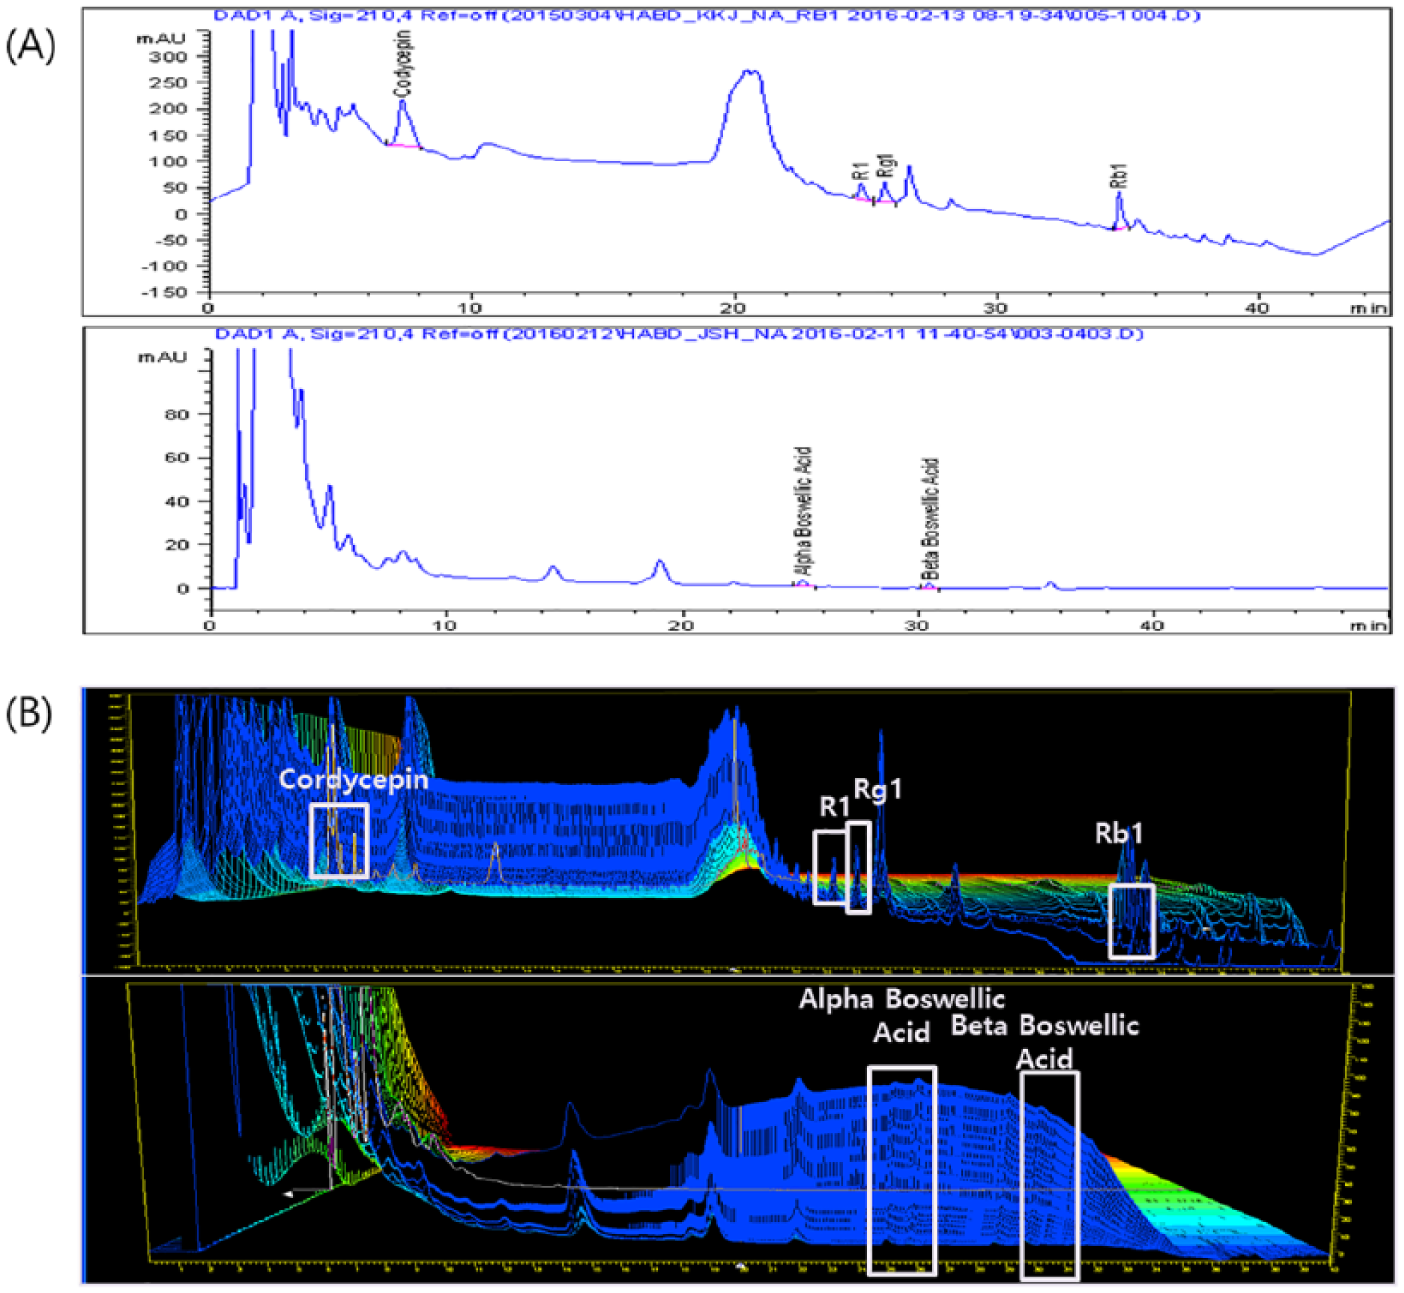
HPLC profile of major components in HAD-B1. For the quantitative analysis of 1 tablet of HAD-B1, methanol extract of HAD-B1 was applied to the octadecylsilylated silica gel column on HPLC and eluted by acetonitrile mixed with distilled water (A). The 3-dimensional HPLC profile of HAD-B1 (B). HAD-B1 detected the presence of 6 compounds: cordycepin, R1, Rg1, Rb1, α-boswellic acid, and β-boswellic acid.
Inhibition of H1975 Cell Viability by HAD-B1
To examine the synergistic antiproliferative effects of combined treatment with HAD-B1 and afatinib on H1975 cells, we employed H1975 cell viability assay using MTT assay. The combination of HAD-B1 and afatinib inhibited the viability of H1975 cells in a dose-dependent manner. Half-maximal inhibition of H1975 cell viability by the combined treatment was observed at a concentration of 0.05 M and 0.03 ± 0.02 mg/mL (P < .05, .01; Figure 2C) whereas the IC50 values of afatinib or HAD-B1 alone were 0.057 ± 0.015 mM (Figure 2A) or 0.128 ± 0.064 mg/mL (Figure 2B), respectively. Cordycepin, one of the major components of HAD-B1, also inhibited the viability of H1975 cells and half-maximal inhibition of H1975 cell viability by cordycepin was observed at a concentration of 0.021 ± 0.006 mg/mL (P < .05, .01) but R1 and Rb1 showed no effects (Figure 2D). The CI values showed the synergistic effect of the combined treatment of HAD-B1 with afatinib (COMTHA) in the cell proliferation data (Table 2). These data demonstrated that HAD-B1 appeared to be synergistically effective in suppressing the cell viability by the combined administration of afatinib.

Cell-based viability assay using H1975 lung cancer cells treated with HAD-B1 in combination with afatinib. H1975 cells incubated with different concentrations of afatinib (A); HAD-B1 (B); combined treatment with afatinib (50 nM) and HAD-B1 (C); and cordycepin, a major compound of HAD-B1 (D) for 72 hours. Data shown are the means ± SD, and statistical analysis was performed using the Student’s t test (n = 3; *P < .05, **P < .01, and ***P < .001, vs control).
Expression Profiling of Cell Cycle Proteins in H1975 Cells Treated With the Combination of HAD-B1 and Afatinib Using IPS FPAA
To investigate the molecular mechanism of the antiproliferative effect of HAD-B1 on H1975 cells, we performed the proteomic analysis of endogenous cell signaling proteins in H1975 cells treated with HAD-B1, using protein chip–based antibody microarray. Based on the data analysis, we found that HAD-B1 increased the expression of p16 (Figure 3E) whereas it decreased the expression of pERK1/2 protein (Figure 4). The expression data were validated by immunoblot analysis. These findings indicated that the inhibitory effect of HAD-B1 on H1975 cell proliferation was due to blocking ERK1/2-mediated cell survival signaling and enhancing p16.

Differential expression profiling of cell cycle proteins in H1975 cells treated with the COMTHA using the IPS Forward Phase Antibody Array chip. Schematic diagram of protein expression profiling in H1975 cells treated with HangAmDan-B1 (HAD-B1) by using an antibody microarray on IPS Proteochip (A). Graded image of the Cy5:Cy3 ratios from the COMTHA-treated H1975 cells (B). Map of the antibody array chip (C). Graphical representation of the Cy5:Cy3 ratios on the antibody from H1975 cells treated with the COMTHA (D). Validation of the antibody microarray data based on an immune blot analysis (E).
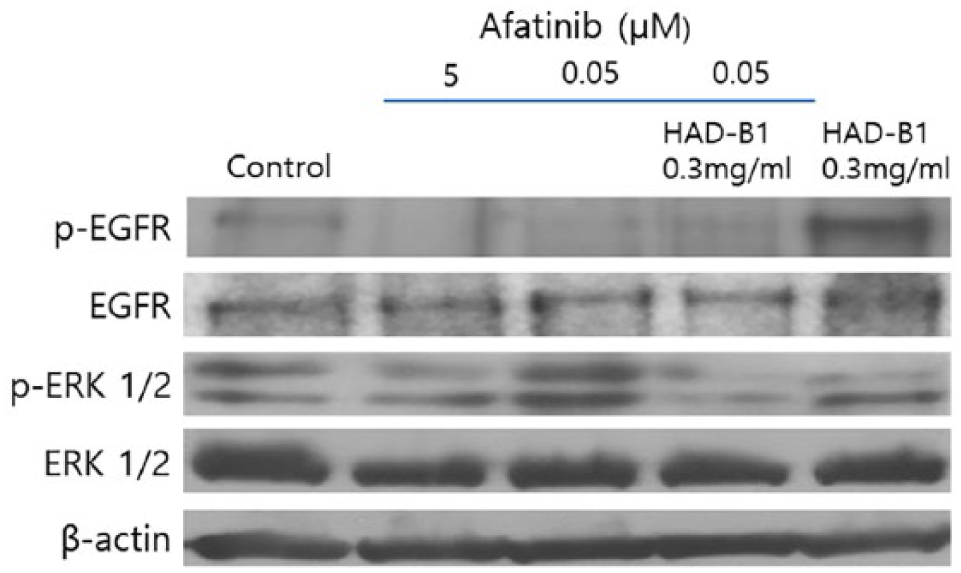
Inhibitory effect of epidermal growth factor receptor signaling in H1975 cells treated with the COMTHA. Western blot analysis of cell lysates from H1975 cells treated with the COMTHA for 24 hours.
Cell Cycle Analysis and Apoptosis Induction in H1975 Cells Treated With the COMTHA
To further investigate whether the inhibition of the cell survival by the treatment with HAD-B1 and afatinib on H1975 cell is closely related with the cell cycle arrest, we carried out cell cycle analysis using MUSE cell analyzer. The combined treatment with HAD-B1 and afatinib was dosed in the cells for 24 hours and 48 hours, respectively. The cell apoptosis and cell cycle were analyzed using Muse cell cycle kit and Annexin V and dead cell kit. The early apoptosis rate was markedly increased in the COMTHA-treated cells compared with empty vehicle-treated control group (Figure 5), G0-G1 phase arrest (Figure 6) was increased in the COMTHA-treated cells.

Apoptosis of H1975 cells treated with the COMTHA. The H1975 cells were treated with the COMTHA for 24 hours and 48 hours, respectively. Apoptosis was assessed by Annexin and 7-AAD double staining using Mini Flow Cytometry Muse Cell Analyzer.
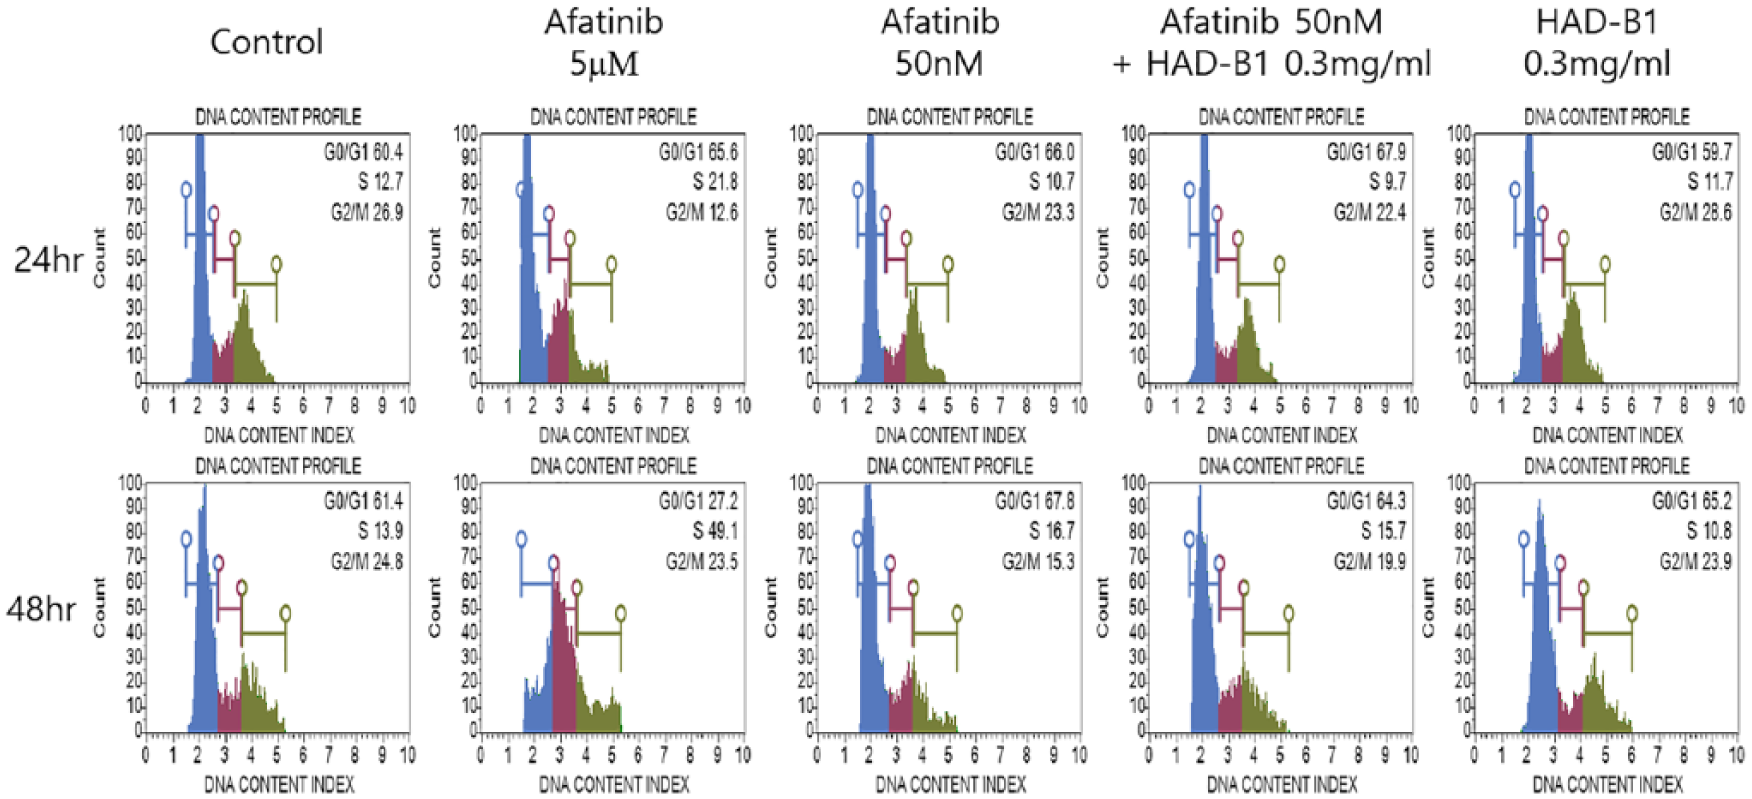
Cell cycle of H1975 cells treated with the COMTHA. H1975 cells were treated with the COMTHA for 24 hours and 48 hours, respectively. Cell cycle distribution was analyzed by Muse cell cycle kit (Merck Millipore, Billerica, MA).
Activation of Caspase-3, -8, and -9 in H1975 Cells Treated With the COMTHA
To confirm the induction of apoptosis in H1975 cells treated with the COMTHA, we carried out caspases (caspase-3, -8, and -9) activity assay in vitro. H1975 cells were treated with the COMTHA for 72 hours (Figure 7). Based on the results, the COMTHA appeared to be more effective in enhancing the caspase activities compared with afatinib alone.

Analysis of caspase-3, -8, and -9 activities in H1975 cells treated with the COMTHA. The H1975 cells were treated with the COMTHA for 72 hours. The bar graph showed caspases activities compared with vehicle control as percentages. Afatinib was used as positive control. Data shown are the means ± SD, and statistical analysis was performed using 1-way analysis of variance with a post hoc Dunnett’s test (n = 3; *P < .05, **P < .01, vs control).
Inhibitory Effect of the COMTHA on the Tumor Growth in H1975 Xenograft Mice
To further demonstrate the anti–lung cancer effect of the COMTHA in vivo, we conducted a solid tumor growth assay using an H1975 cell–xenograft mouse model. Briefly, human lung cancer H1975 cells (1.0 × 10⁶) were injected into the skin of nude mice and grown to a mass of approximately 100 mm3 (Figure 8B). The tumor growth was inhibited in a dose-dependent manner when the COMTHA combined treated was orally administered once daily to the mice. Moreover, the mean tumor volume in the group treated with the COMTHA (afatinib, 10 mg/kg; and HAD-B1, 400 mg/kg) was markedly reduced compared with those of the control groups treated with afatinib (10 mg/kg) alone (Figure 8A). Immunohistochemical analysis of the tumor tissues revealed downregulation of p-ERK and upregulation of p16 in COMTHA-treated group (Figure 8C and D). This result was consistent with the data of proteomic analysis in H1975 cells. Biochemical blood analysis of alanine aminotransferase, aspartate transaminase, alkaline phosphatase, blood urea nitrogen, and creatinine levels did not reveal any significant changes in the COMTHA-treated group (Figure 9). These data demonstrated that HAD-B1 has potential for use as an inhibitor of solid tumor growth developed by H1975 lung cancer cells without any side effects.
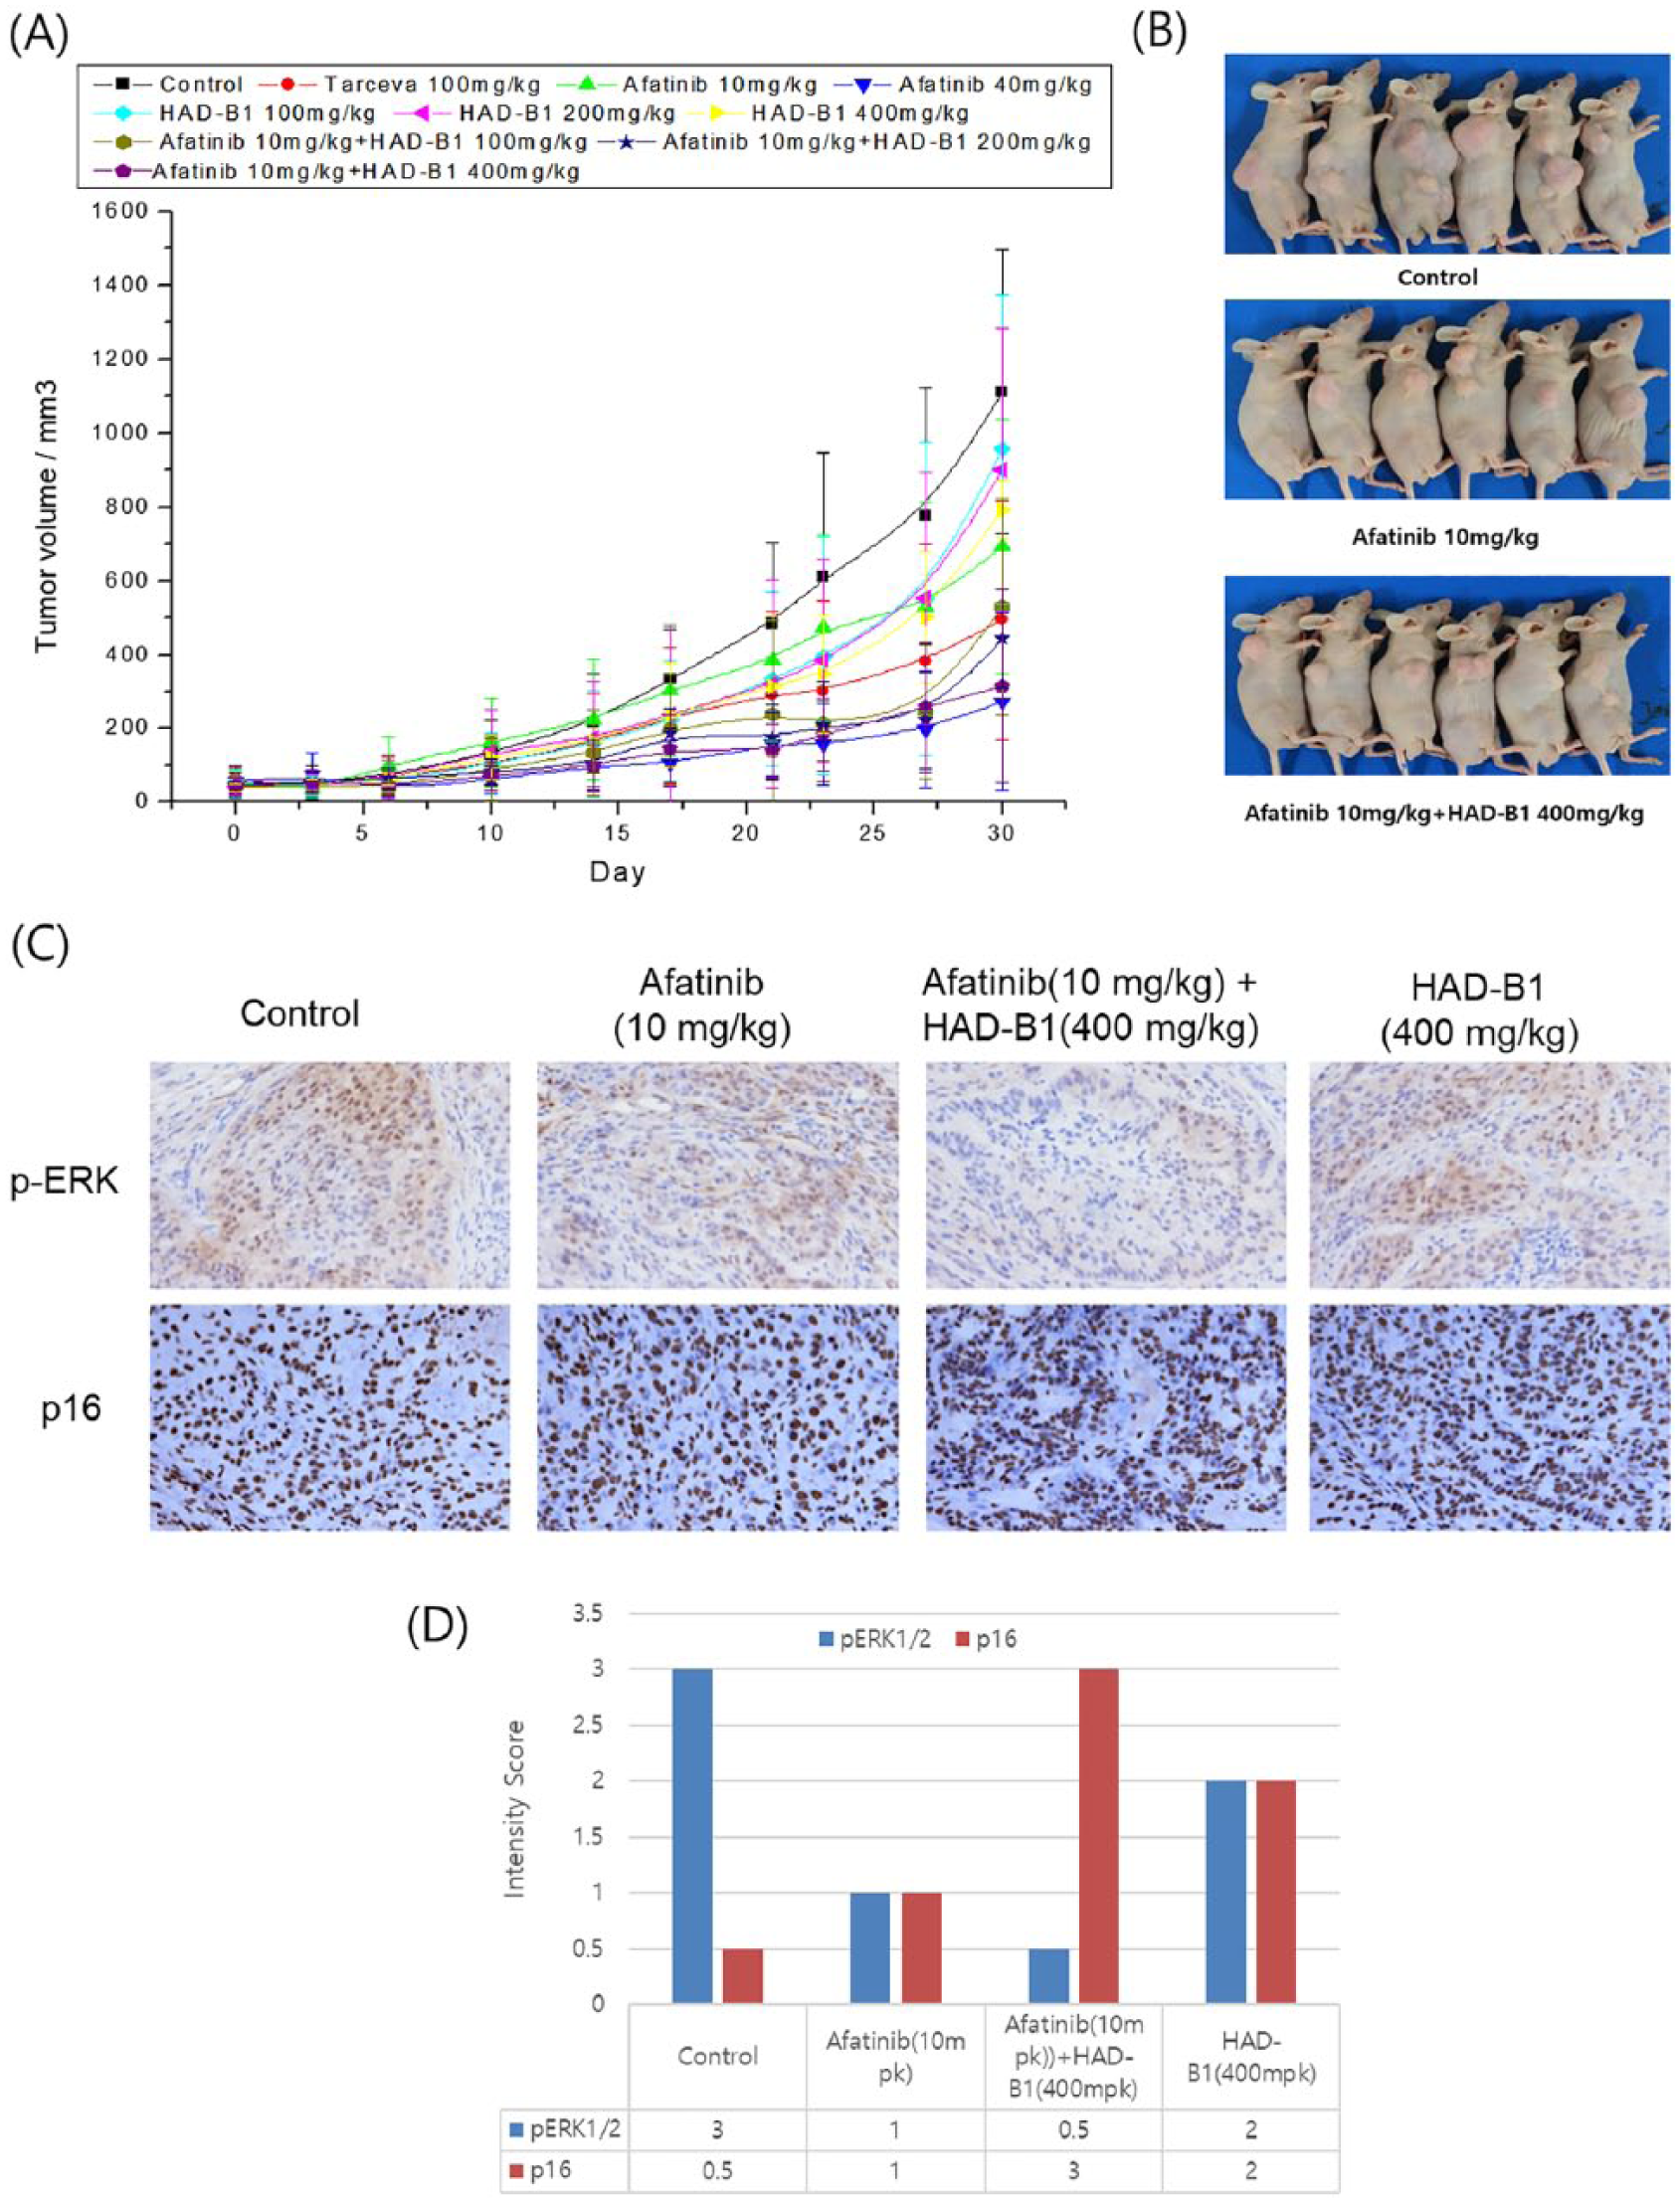
Inhibitory effect of HAD-B1 on solid tumor growth of H1975 lung tumor–cell xenograft animals. H1975 cells (1.0 × 10⁶) were injected subcutaneously into nude mice to generate a xenograft model (n = 8). When tumor growth reached ~100 mm3, HAD-B1 was orally administered at the indicated concentrations for 30 days once daily (A). Representative images of H1975 cells xenograft nude mice treated with the COMTHA (B). Immunohistochemical staining of p-ERK and p16 (C). Quantitative analysis of p16 and pERK1/2 in tumor tissues using the staining intensity score (3, high; 2, middle; 1, low; and 0, control) (D). The images were taken at 400× magnification. Data shown are the means ± SD, and statistical analysis was performed using the Student’s t test (n = 3; *P < .05, **P < 0.01, and ***P < .001, vs control).
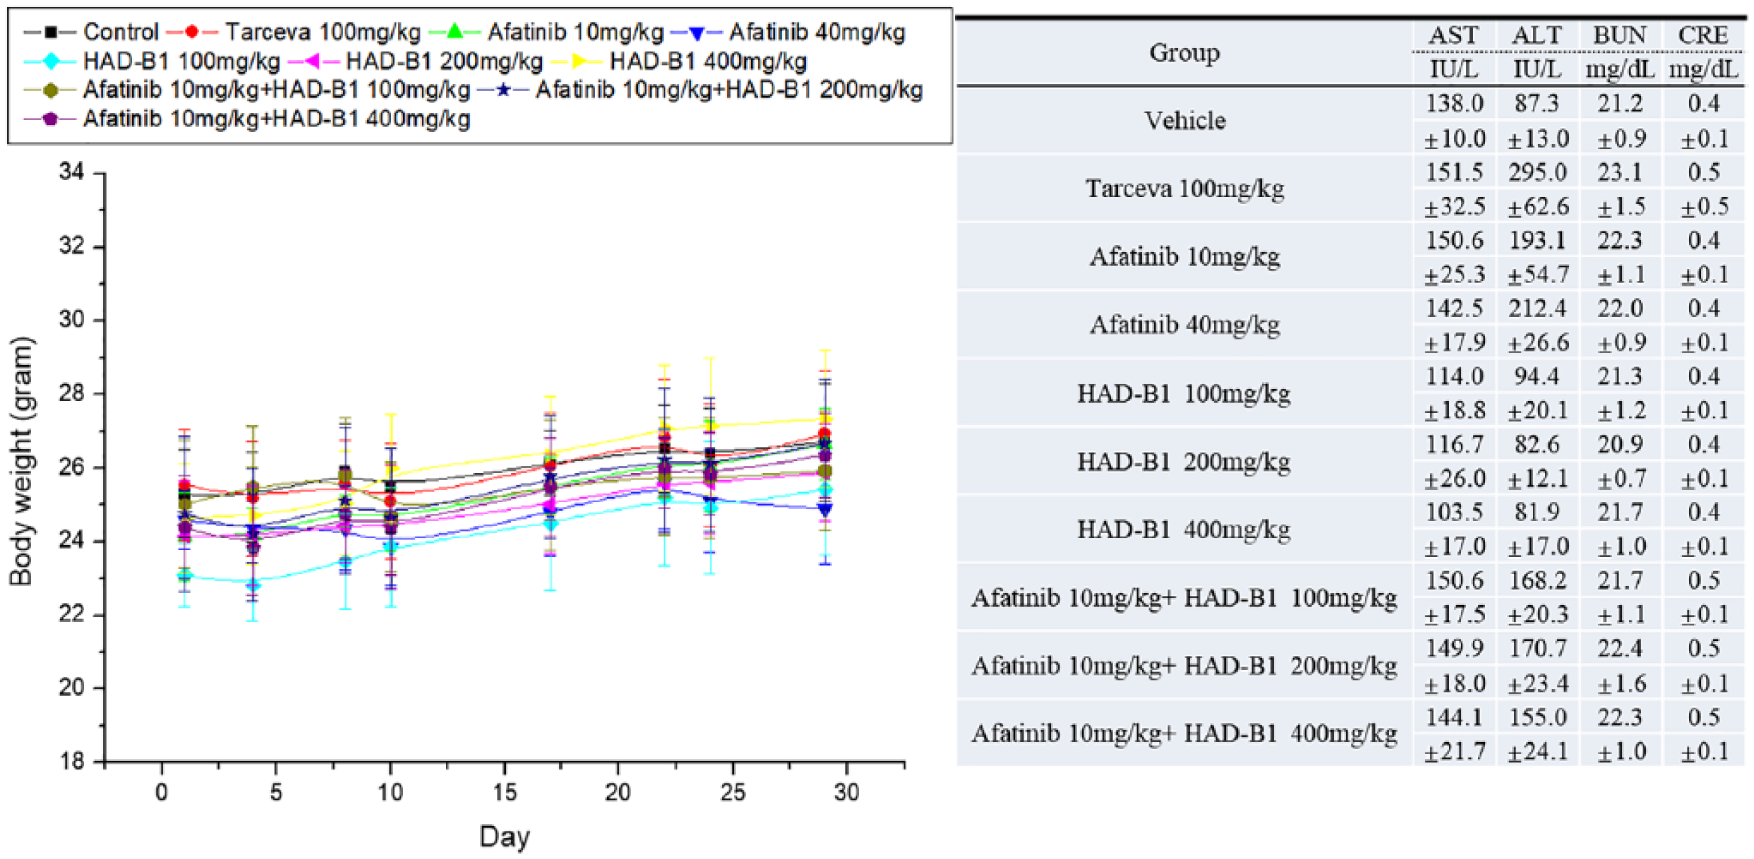
Toxicity analysis in H1975 lung tumor cell–xenograft animals treated with the COMTHA. Body weights (A) and blood chemistry analysis of H1975 tumor-bearing mice (B).
Discussion and Conclusion
Afatinib showed activity in tumors resistant to first-generation EGFR-TKIs, including tumors harboring the EGFR L858R/T790M double mutant. 24 Nevertheless, application of afatinib brought about a high occurrence of adverse effects. 14 Therefore, it is necessary to discover natural product drugs that have few side effects and high efficiency against NSCLC on account of the shortcomings of current drugs in overcoming EGFR-TKIs resistance. HAD-B1 is an anticancer medication developed to focus on lung cancer treatment. It is composed of 4 herbs that have positive effects on lung cancer. The 3-dimensional HPLC analysis of HAD-B1 showed the presence of 6 critical compounds including cordycepin, R1, Rg1, Rb1, α-boswellic acid, and β-boswellic acid (Figure 1). Cordycepin, an important compound from Cordyceps militaris, induces autophagy mediated c-FLIPL degradation and leads to apoptosis in human NSCLC cells. 25 Notoginsenoside R1 from Panax notoginseng suppresses cancer metastasis by inhibiting cell migration, invasion, and adhesion, and by regulating expression of metastasis-associated signaling molecules. 26 Major ginsenosides including Rg1, Rb1 from mountain ginseng induced apoptosis in lung cancer cells via extrinsic apoptotic pathway by increasing the expression of caspase-3 and caspase-8. 27 Boswellic acids from Boswellia serrata induced apoptosis through caspase activation, increased Bax expression, NF-κB downregulation, and induction of poly(ADP)-ribose polymerase cleavage. 28 In this study, we demonstrated anticancer effect by reducing the dose of afatinib and combining treatment with HAD-B1. In the in vitro H1975 cell viability assay, combined treatment with HAD-B1 and afatinib appeared to be more effective than afatinib or HAD-B1 alone (Figure 2). Also, cordycepin inhibited the viability of H1975 cells in a dose-dependent manner but R1 and Rb1 did not. These results suggest that cordycepin may significantly contribute to the antiproliferation effect on H1975 cells. One study reported that cordycepin induces apoptosis and inhibits proliferation of human H1975 lung cancer cell. 29 Proteomic analysis of H1975 cells treated with HAD-B1 revealed molecular mechanisms of anti–lung cancer activity of HAD-B1 with increasing p16 and decreasing pERK1/2 protein expression (Figures 3 and 4). The p16 gene is an important tumor-suppressor gene, involved in the G1 to S phase transition of the cell cycle 30 and regulation of cell cycle progression by inhibiting the S phase. 31 Expression of p16Ink4a maintains the Rb family members in a hypophosphorylated state, which promotes binding to E2F1 and leads to G1 cell cycle arrest. 29 ERK1/2 is serine/threonine protein kinase and member of the mitogen-activated protein kinase family.32,33 The active ERK1/2 can regulate gene expression, cell proliferation, differentiation, cell matrix interactions, and cell migration, and has been shown to inhibit apoptosis. In contrast, inhibition of ERK1/2 promotes apoptosis.34,35 Our data showed that the COMTHA appeared to be more effective in suppressing caspase-3, -8, and -9 activities compared with afatinib alone (Figure 7). In addition, the COMTHA-treated cells increased early apoptosis (Figure 5) and G0-G1 phase arrest (Figure 6). These results indicated that upregulation of p16 and downregulation of ERK1/2 in H1975 cells combined treated with the COMTHA resulted in stimulation of caspase-mediated apoptosis and G0-G1 phase cell cycle arrest in the cells.
The tumor growth experiment using H1975 tumor xenograft mice confirmed the synergic effect of combined treatment of HAD-B1 and afatinib. The growth of solid tumor in the COMTHA-treated group was remarkably suppressed in a dose-dependent manner compared with the empty vehicle-treated control groups (Figure 8A). Collectively, we observed that the COMTHA has an anticancer effect against H1975 lung cancer cells containing EGFR-L858R/T790M double mutation. Therefore, these findings suggest that HAD-B1 could be an effective and safe drug for treatment of NSCLC patients acquired resistance to TKIs.
Footnotes
Declaration of Conflicting Interests
The author(s) declared no potential conflicts of interest with respect to the research, authorship, and/or publication of this article.
Funding
The author(s) disclosed receipt of the following financial support for the research, authorship, and/or publication of this article: This study was supported, in part, by a grant of the Traditional Korean Medicine R&D Project, Korea Health Industry Development Institute, Republic of Korea (HI14C-0849-000014), and the Basic Science Research Program through the NRF funded by the Ministry of Education (NRF-2016R1D1A1A09919185).