
Abstract
Introduction
Alzheimer’s disease is a chronic neurodegenerative disease, and it tends to progress slowly and steadily over time. It is the most common neurodegenerative disease among the elderly. AD was discovered 100 years ago, and intensive research to figure out its symptoms, causes, and cure was done in the last decades. Although many facts about AD have been revealed, many precise biological changes that affect individuals at different rates need to be discovered. The common early symptom of AD is forgetting new information as a result of malfunctioning of the brain cells that are responsible for forming new memories. These changes happen gradually and affect other different parts of the brain causing many new symptoms such as Ref. 1: (1) memory loss, (2) facing difficulties in planning or solving problems, (3) challenges in performing daily duties at home or work, (4) getting confused with time or place, (5) less participation in social events. AD has three stages. Firstly, normal (no impairment): the subjects in this stage do not face any memory problems. Also, medical assessment does not give any indication of dementia. Secondly, mild cognitive impairment (MCI): in this stage, careful medical assessments and clinical examinations should be held on the suspected subjects to detect clear symptoms. Lastly, AD stage: subjects in this stage face problems in interacting with their environment, such as: making a conversation with others and controlling movement. As a result of these deficiencies, they will need help from caregivers for their life activities.
The pursuit of identifying and uncovering novel biomarkers for the early detection of Alzheimer’s disease (AD) has emerged as a focal point of extensive research in the fields of neuroimaging and genetics. Alzheimer’s disease (AD) currently lacks a known cure, and it imposes a huge economic burden on individuals and societies and is one of the ten leading causes of death in the United States. 2 By detecting the disease at an early stage, it may be possible to intervene earlier and provide insight into why the disease is occurring. The neurodegenerative processes leading to AD start many years before the symptoms appear. 3 AD detection is one area where computer algorithms could potentially be able to provide an assessment that is more precise compared to that of healthcare professionals (including radiologists).4-6
Related Work
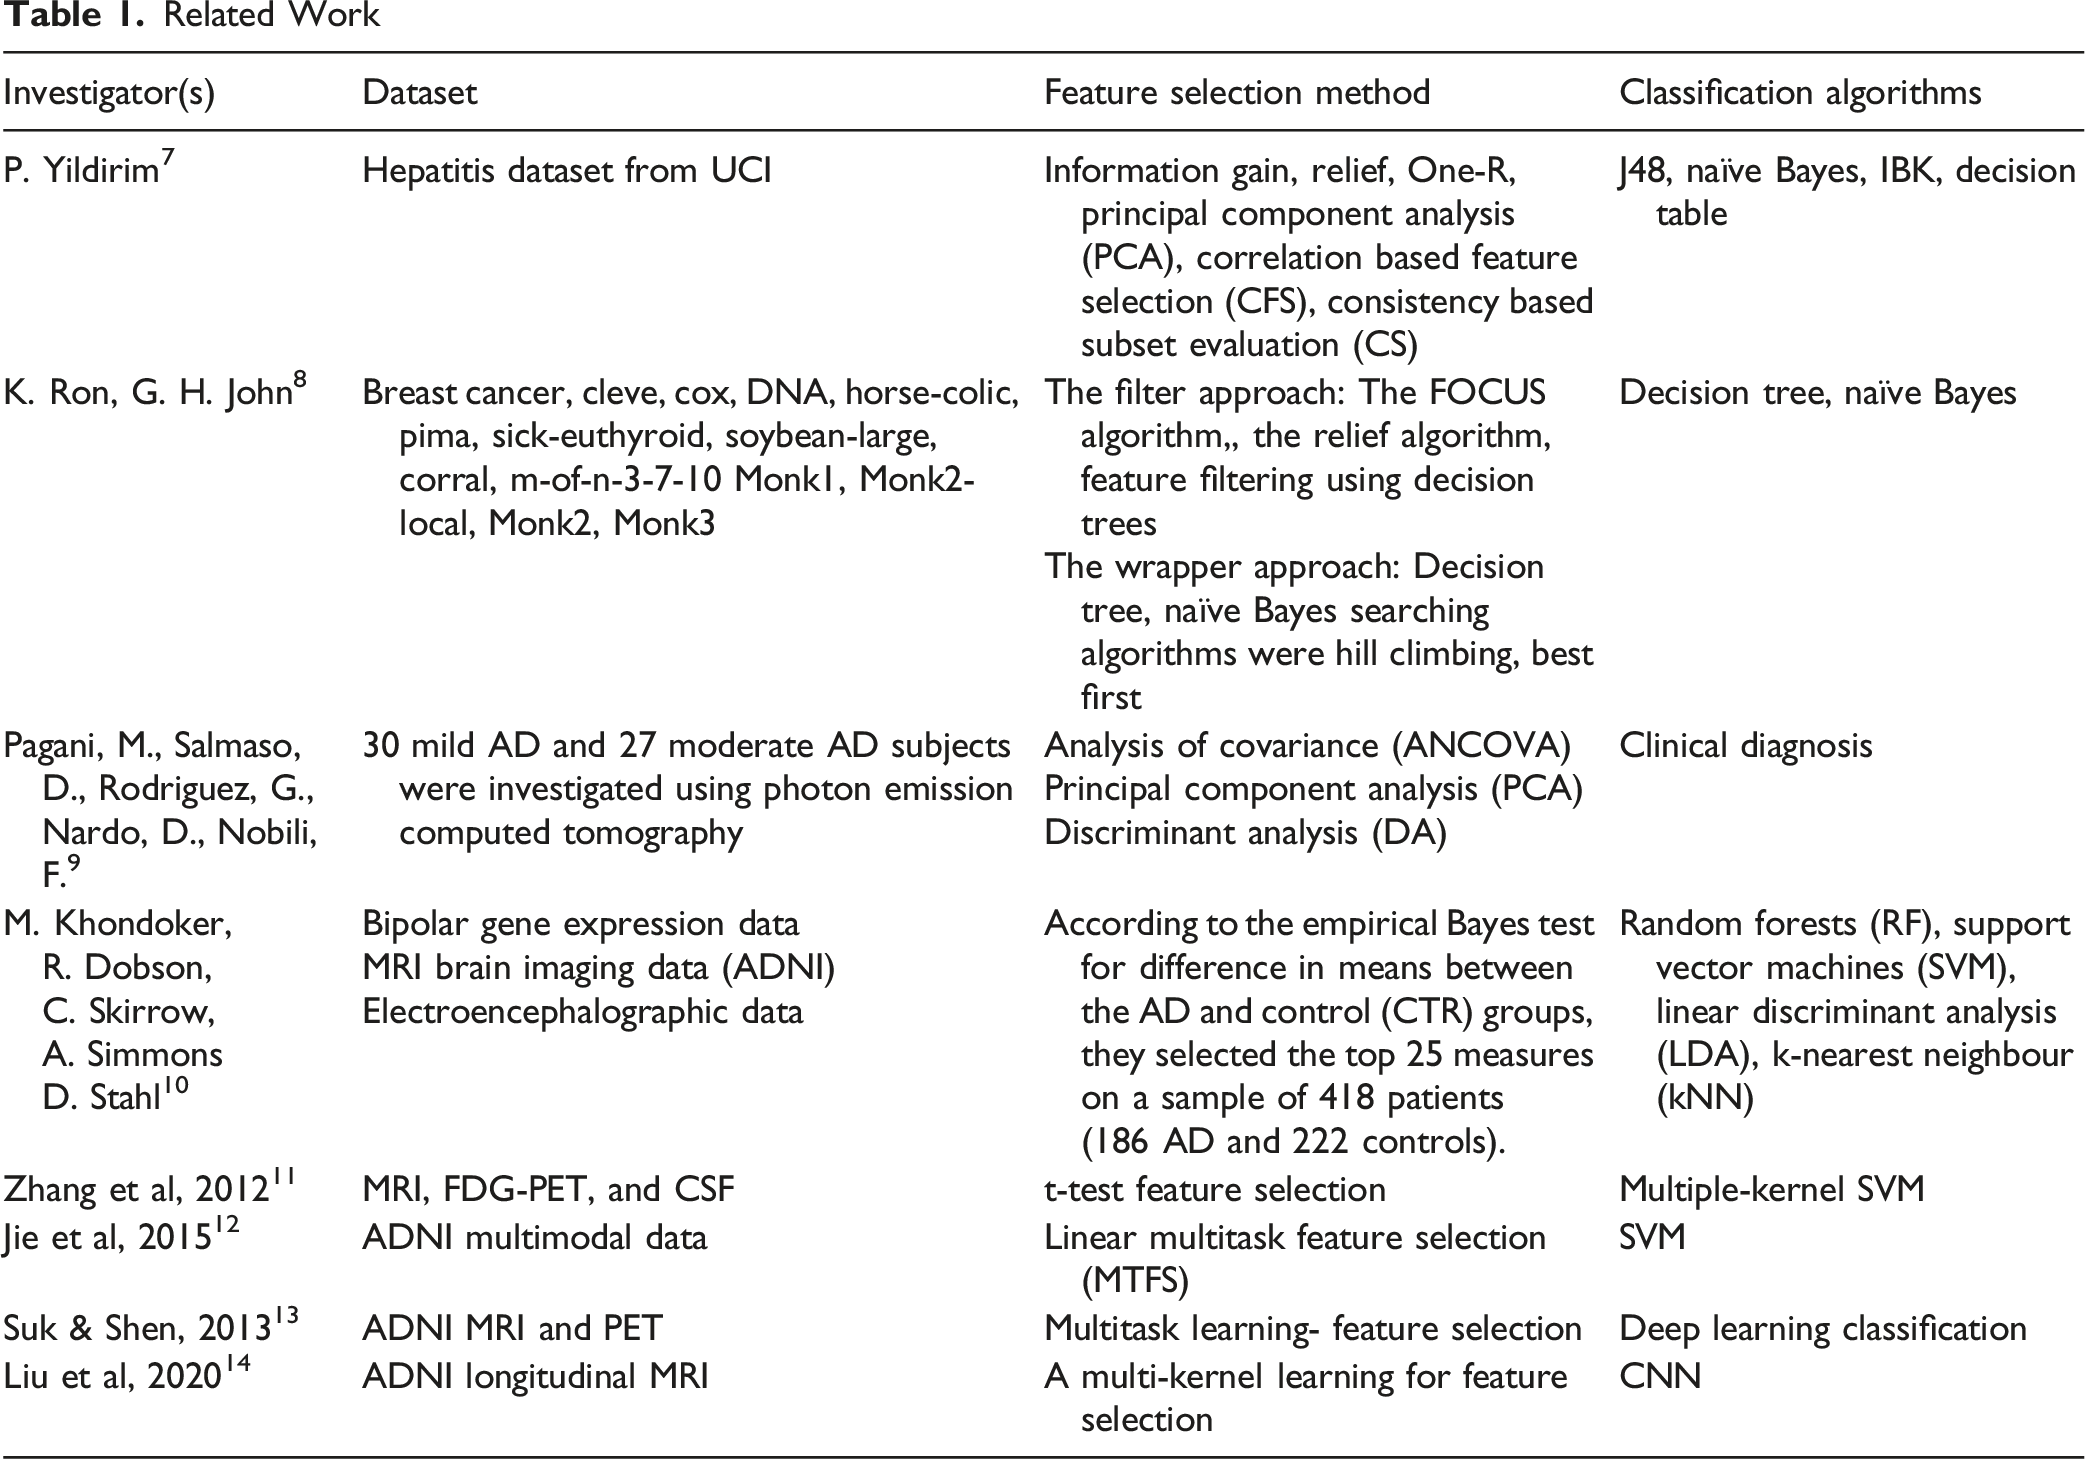
Datasets derived from neuroimaging and clinical assessments of Alzheimer’s disease can contain a vast number of variables. While these rich data sets provide valuable insights, they also introduce challenges such as redundancy, noise, and computational overload. There are many of these features that may not contribute meaningfully to the process of determining disease stages, and this could compromise the efficiency and accuracy of diagnostic models. Feature selection helps address this issue by identifying the most relevant and informative features while eliminating those that are less useful. This process not only simplifies the data and speeds up analysis but also improves the interpretability and reliability of machine learning models.
In this study we implemented various feature selection approaches on a dataset related to Alzheimer’s Disease. Typically, these techniques serve as a preliminary step with classification algorithms to augment prediction accuracy. They possess the capability to identify sets of significant features that effectively distinguish between various classes within a dataset. AD dataset usually is high dimensions as a result of detecting different measurements periodically from different modalities. The main goal behind this work is to examine the best features subset that are capable of diagnosing AD and to find this subset, feature selection algorithms were applied to the AD dataset.
Methodology and Dataset
The whole system structure is represented in Figure 1, in the first stage of the system the data were downloaded from the ADNI website
9
and some preprocessing operations were done such as replacing missing values with zero and removing redundant measurements, for instance ‘diagnosis group at screening’ was discarded because it is already given in ‘population number’. System structure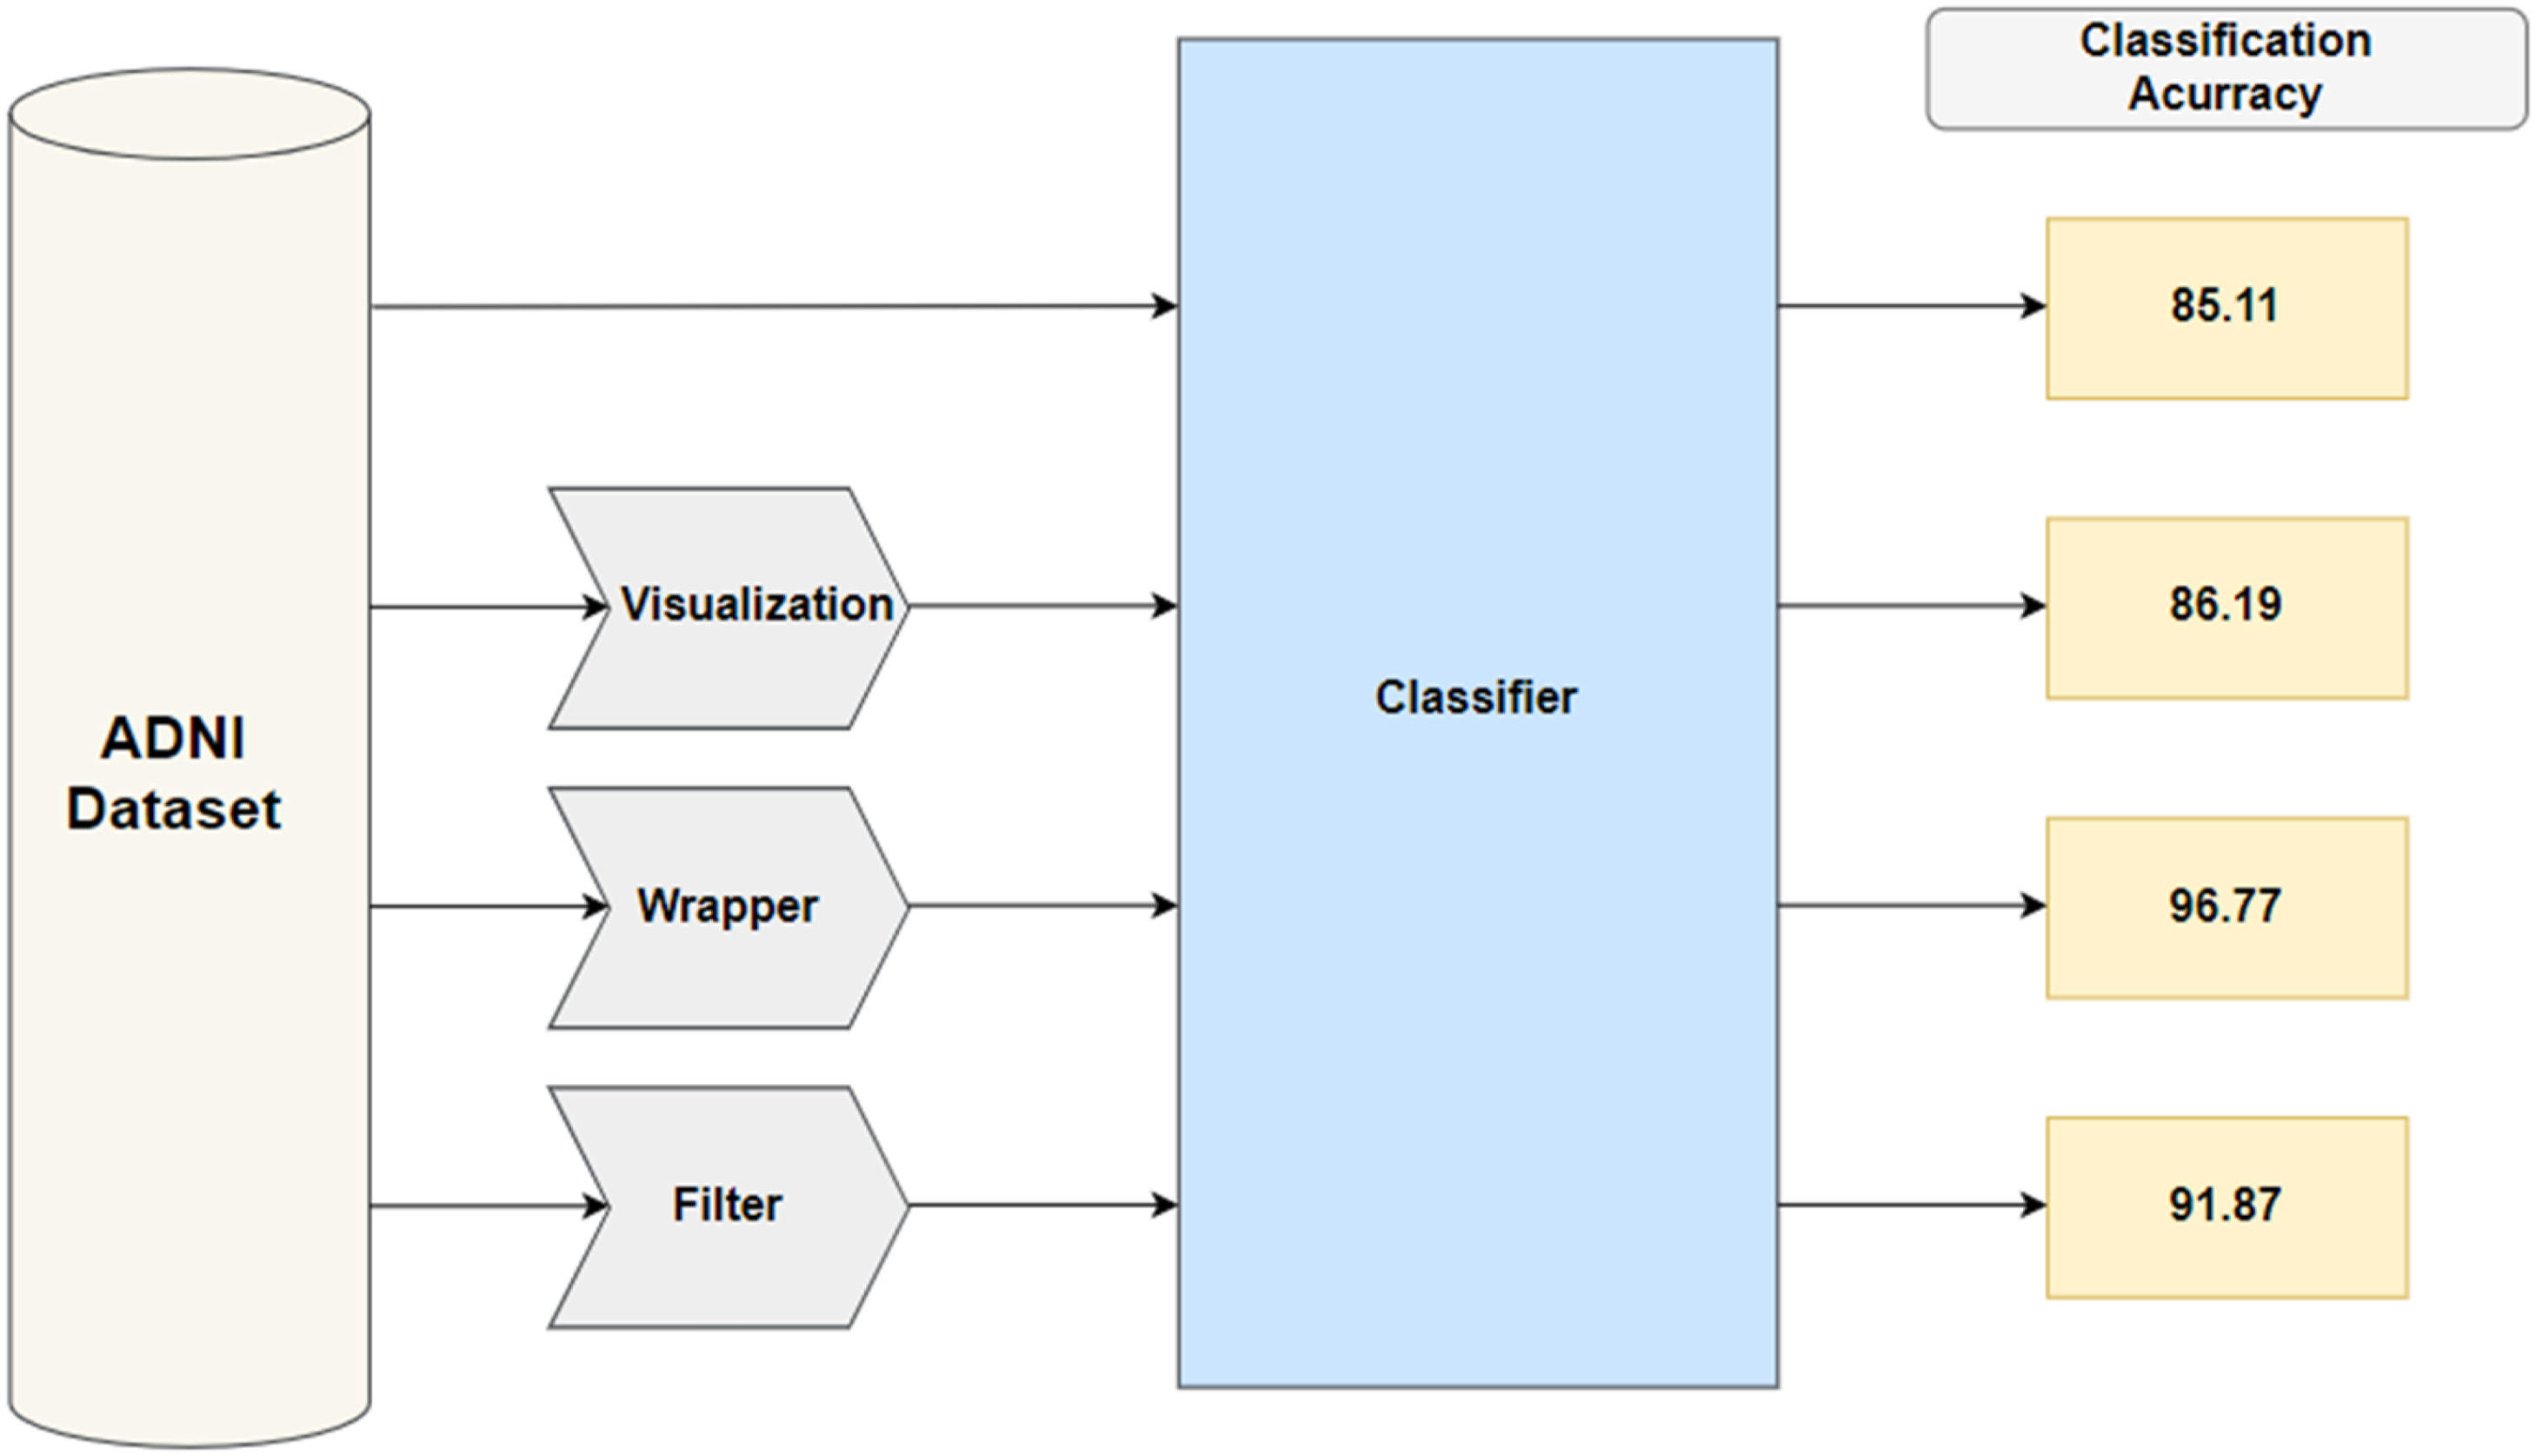
In the second stage, three different methods for feature selection were applied and their resulting feature subsets along with the original ADNI dataset were plugged into the selected classification algorithm. Then in the third stage, the naive Bayes (NB) classifier was applied to the resulting feature subsets from the previous stage. NB is characterized by its simplicity and good results obtained in most cases.
Data Source
Data used in the preparation of this article were obtained from the Alzheimer’s Disease Neuroimaging Initiative (ADNI) database (adni.loni.usc.edu). ADNI was launched in 2003 as a public-private partnership, led by Principal Investigator Michael W. Weiner, MD. The primary goal of ADNI has been to test whether serial magnetic resonance imaging (MRI), positron emission tomography (PET), other biological markers, and clinical and neuropsychological assessment can be combined to measure the progression of mild cognitive impairment (MCI) and early Alzheimer’s disease (AD). 15
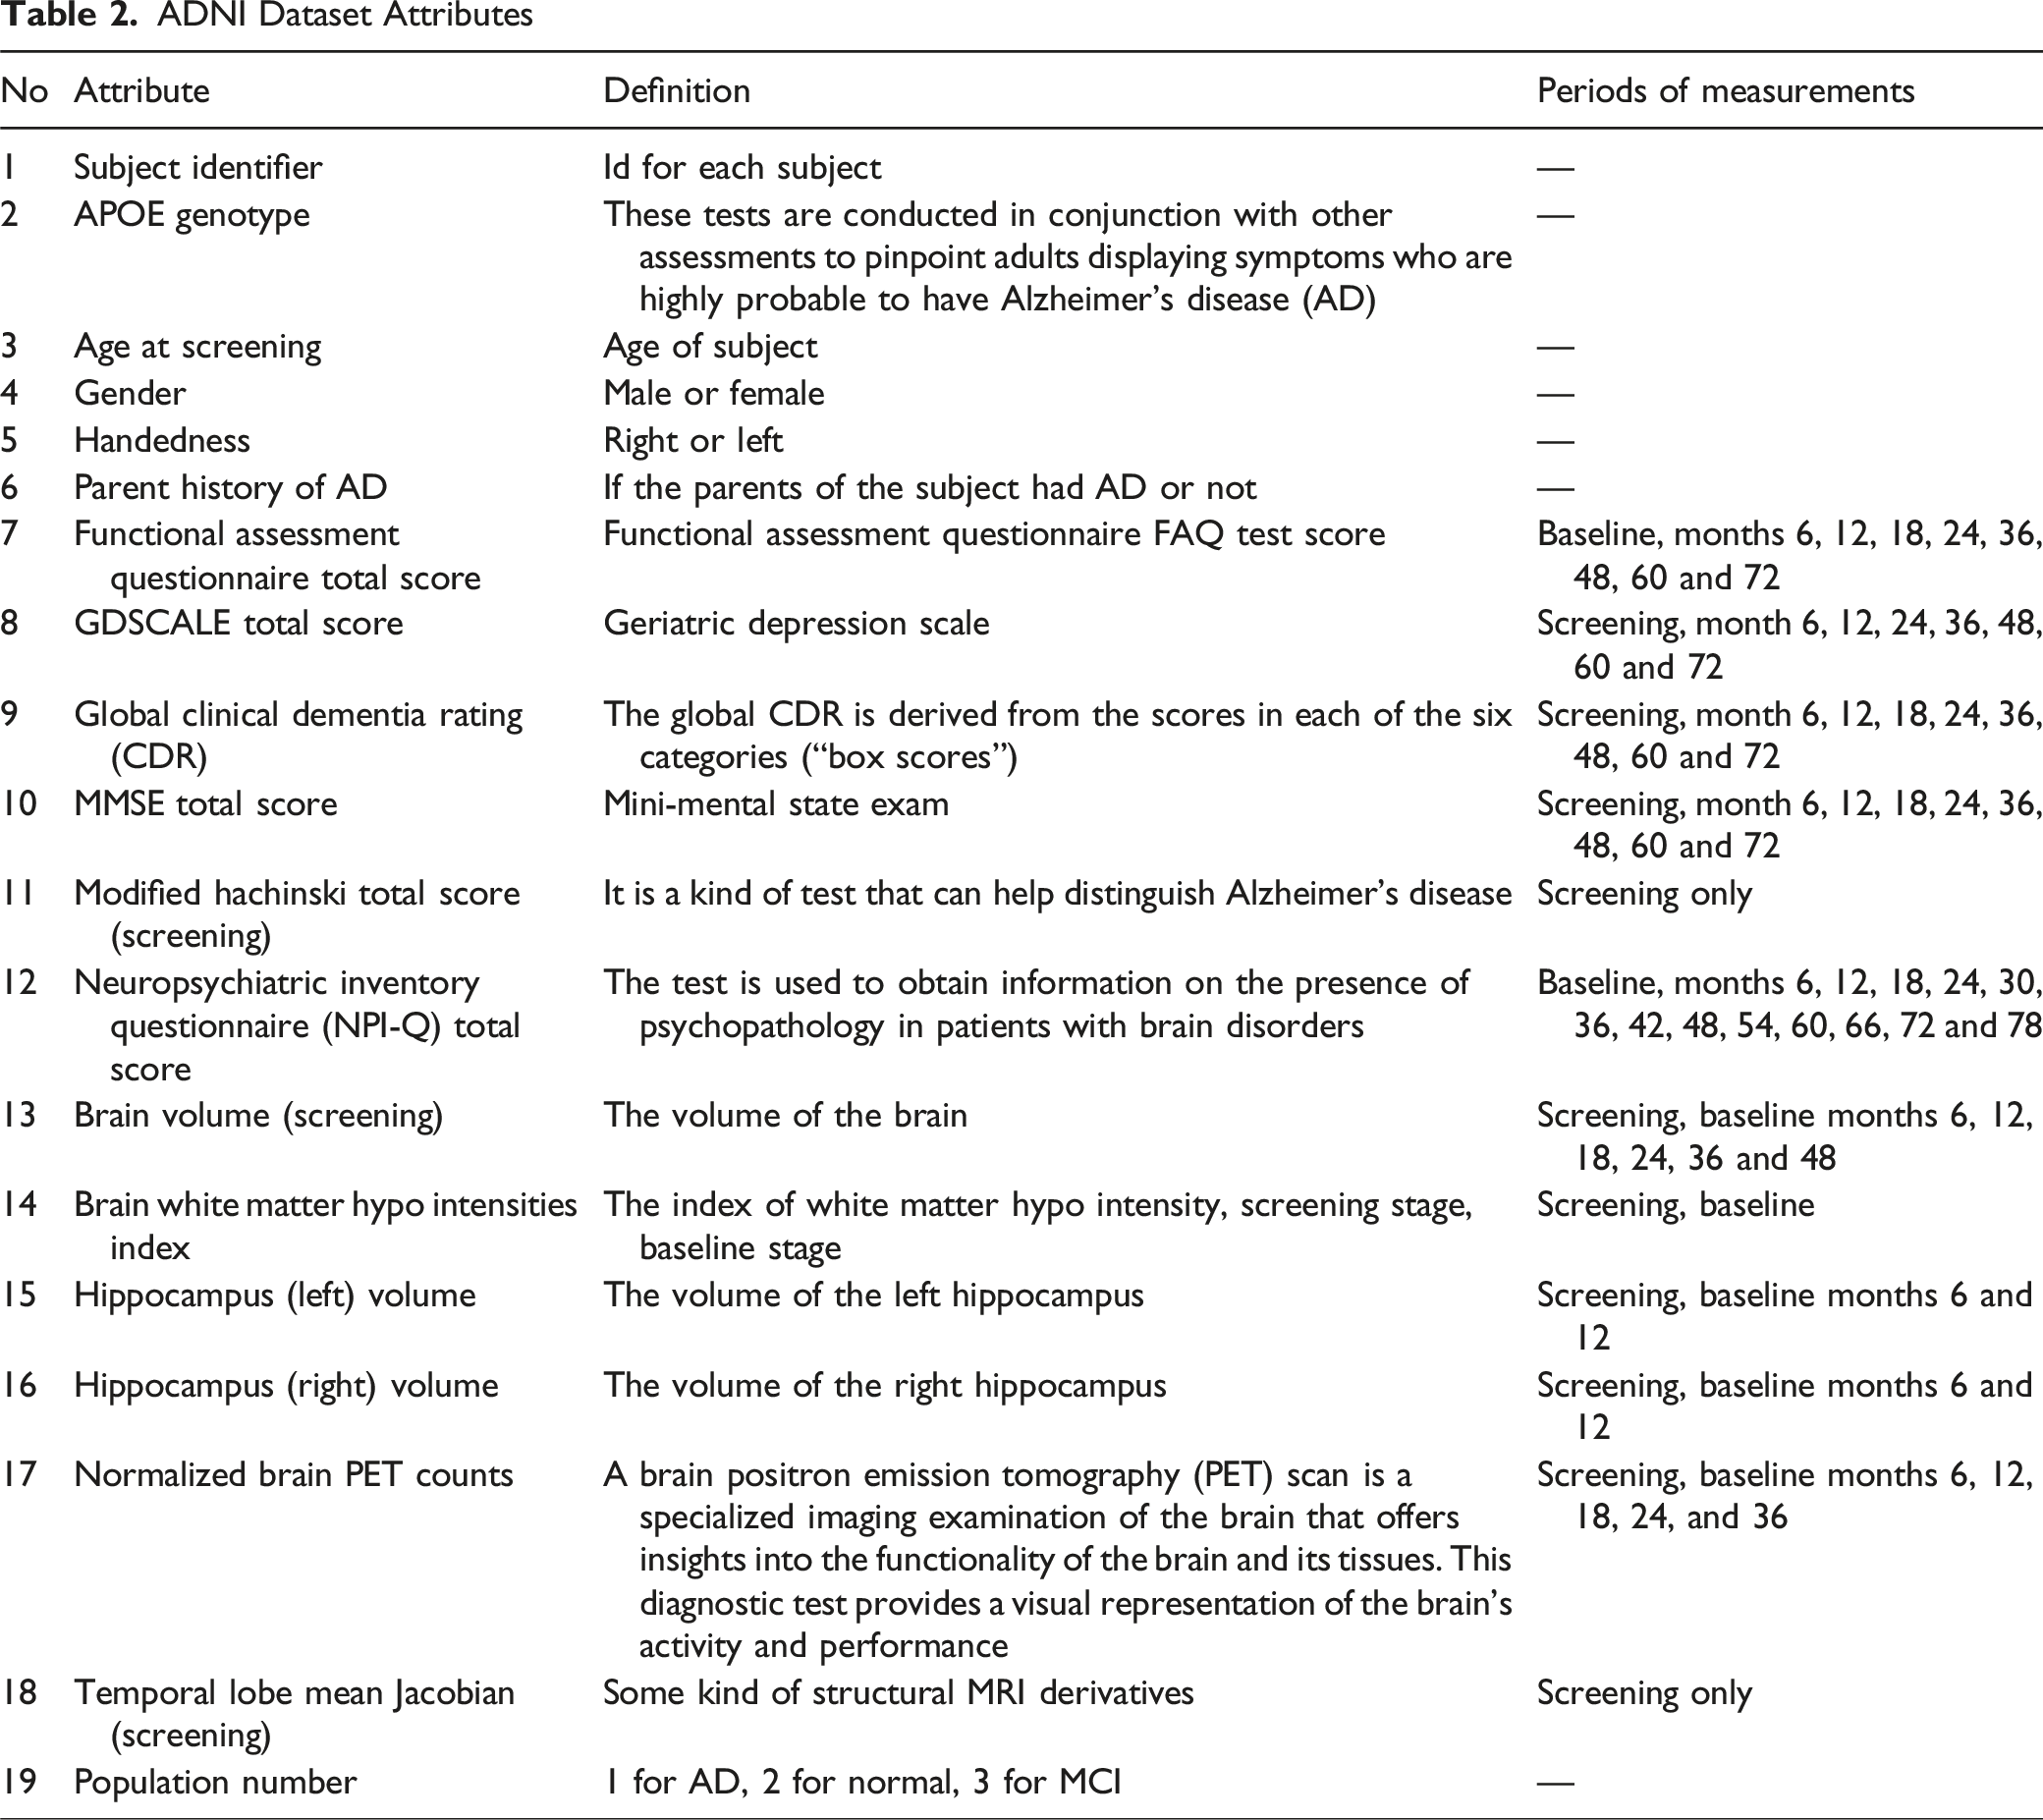
Features
ADNI Dataset Attributes
Feature Selection Approaches
To address the high dimensionality of the ADNI dataset, three complementary feature-selection strategies were applied: (1) visualization-based exploratory analysis, (2) filter-based selection, and (3) wrapper-based subset evaluation. The goal of combining these methods was to reduce redundancy, identify the most informative features, and enhance classifier performance while preserving interpretability.
Visualization-Based Exploratory Analysis
In this study, visualization was incorporated as an exploratory and diagnostic step within the feature-selection workflow. It is important to note that this stage did not involve manually choosing or discarding features. Instead, visualization techniques—such as correlation heatmaps, scatter-matrix plots, and PCA projections—were used to inspect redundancy patterns, assess potential multicollinearity, and observe preliminary class separability within the ADNI dataset.
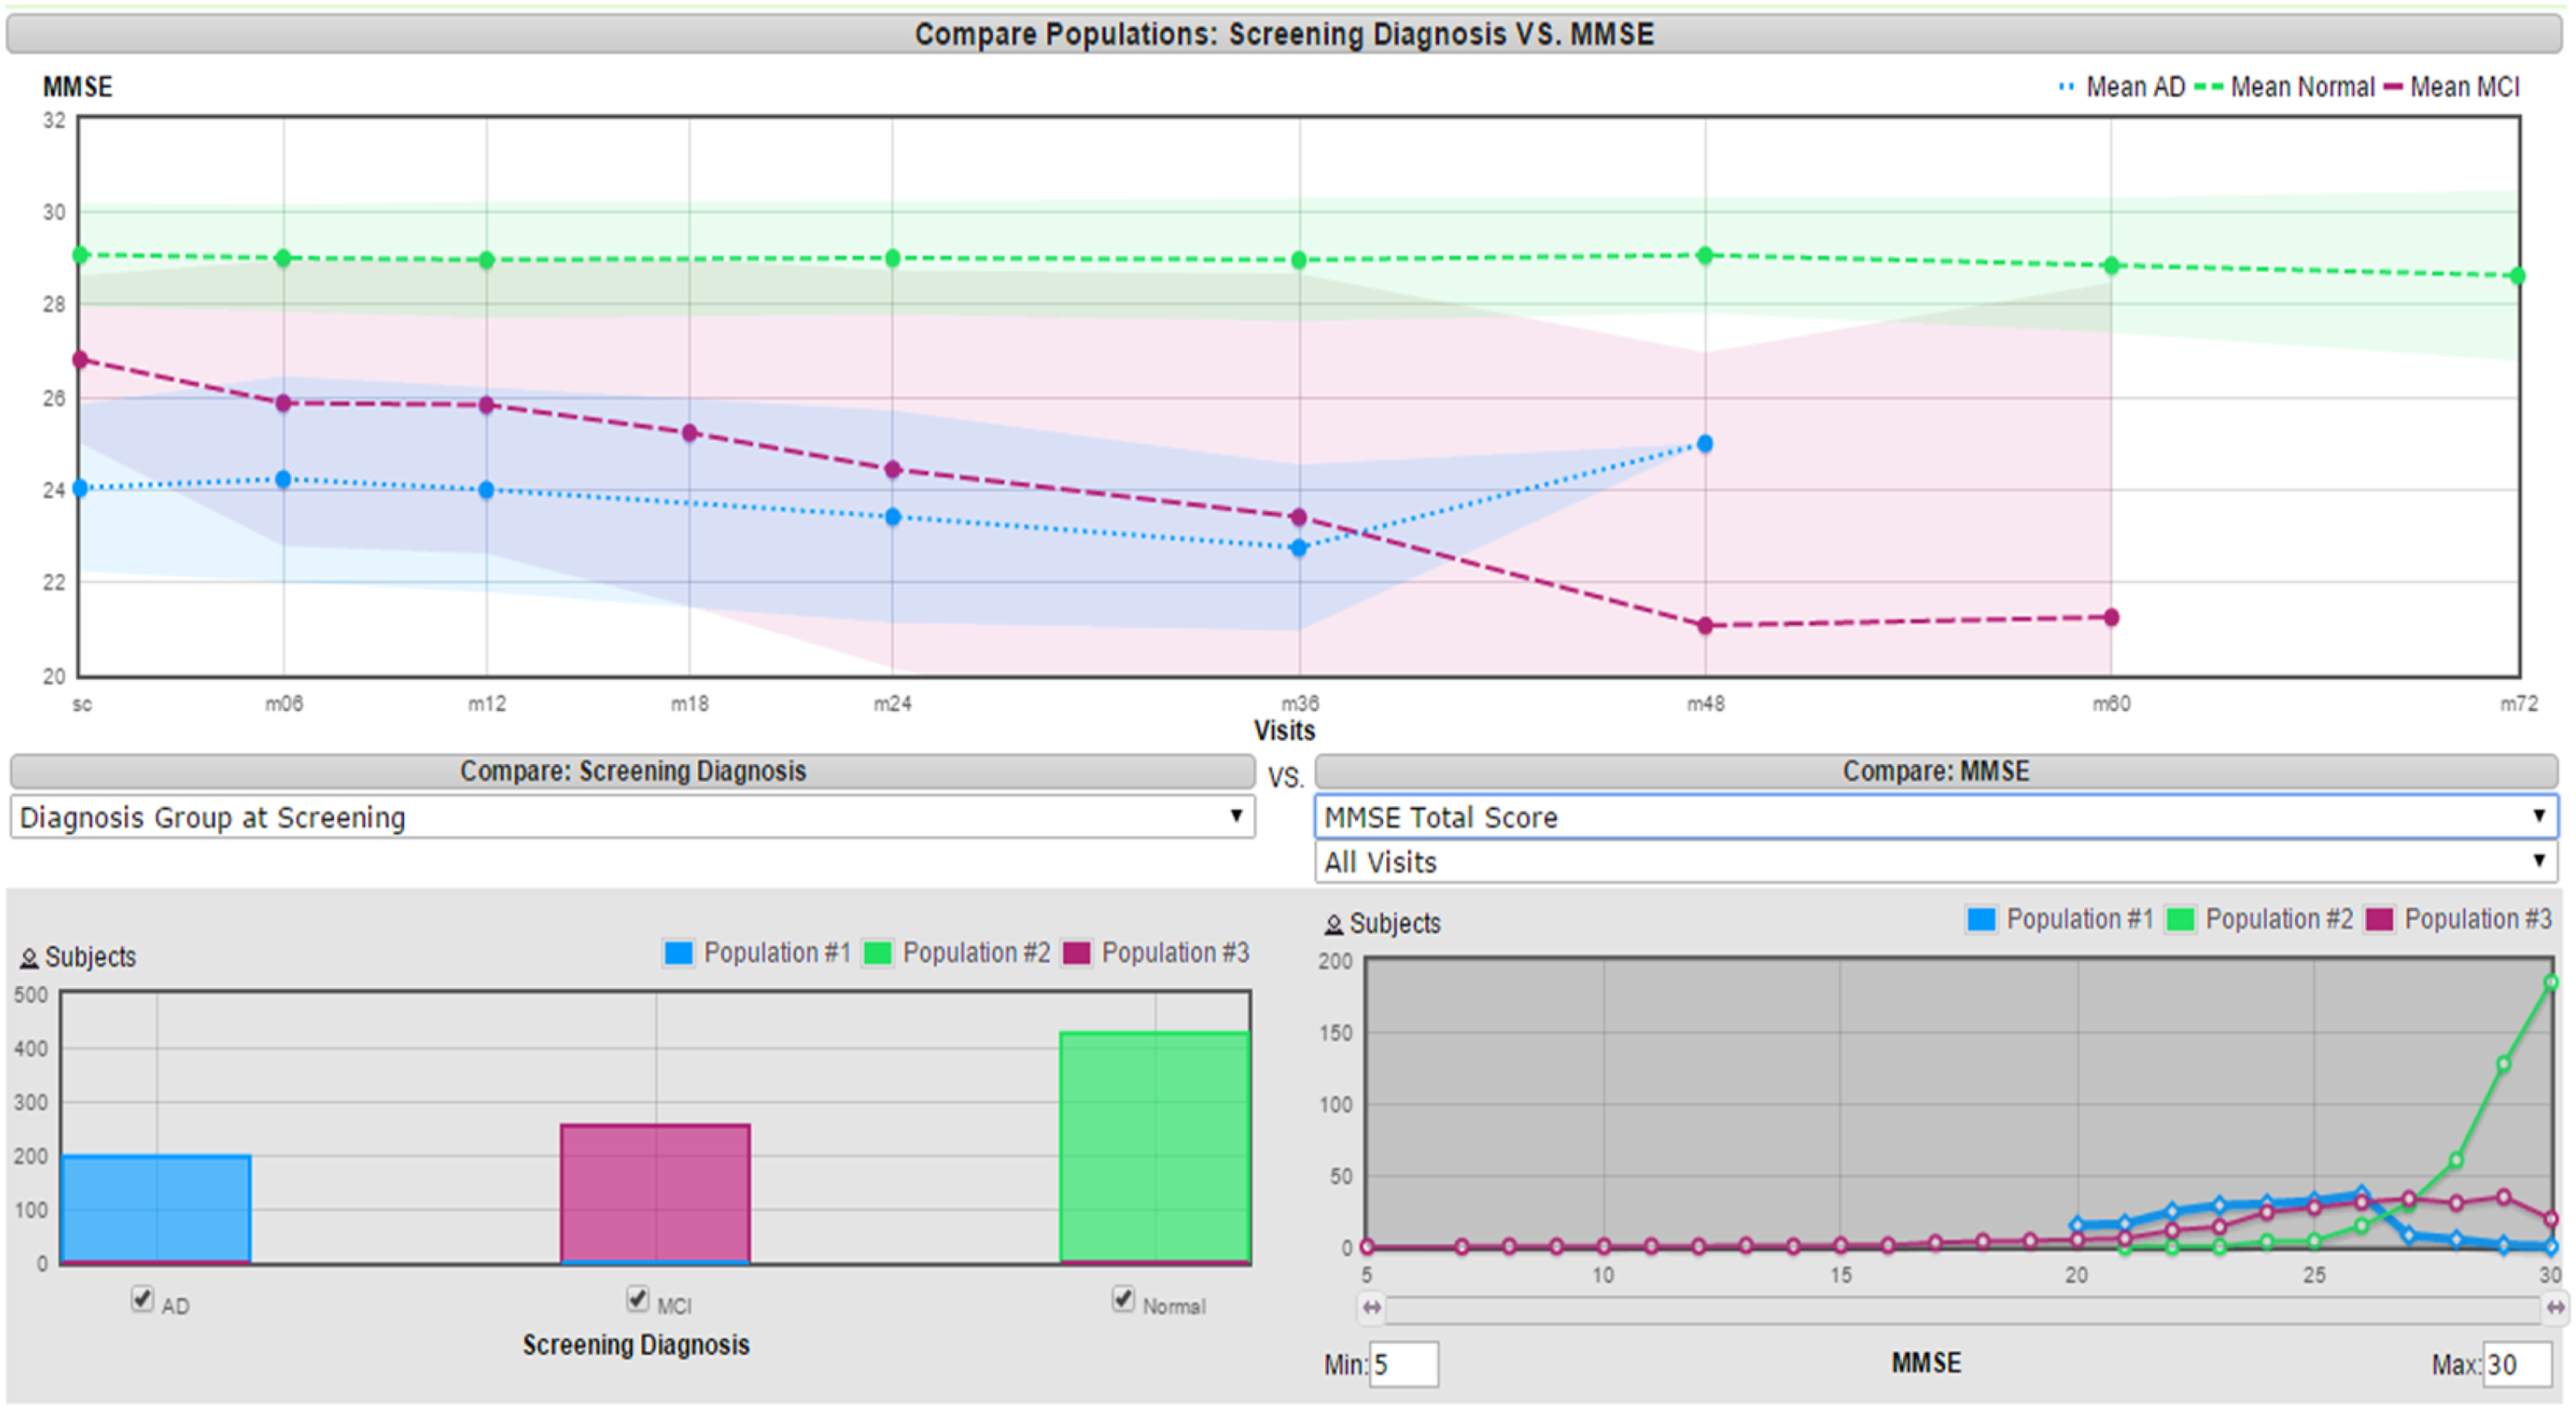
The insights gained from these visual analyses supported the interpretation of results produced by the quantitative feature-selection methods (filter ranking and wrapper-based subset evaluation). Visualization therefore served as a complementary interpretability tool, ensuring that the features identified by automated methods were consistent with known clinical and statistical characteristics of Alzheimer’s disease data. Figure 2 represents an example of a useful feature that can distinguish between the AD classes in a good manner since there is not too much overlapping. The features that were selected based on this approach are the Functional Assessment Questionnaire Total Score (baseline), Global CDR (6 months), MMSE Total Score (screening), and MMSE Total Score (6 months). Visualization of MMSE feature
15
Filter-Based Feature Selection
The filter approach provides an initial, classifier-independent screening of attributes based on their statistical relevance to the class label. In this study, filter selection was conducted in WEKA using the InfoGainAttributeEval evaluator in combination with the Ranker search method.
InfoGainAttributeEval
Information Gain measures the reduction in entropy of the class variable achieved by conditioning on each individual feature. This method is computationally efficient and well-suited to the heterogeneous mix of clinical, demographic, and cognitive variables present in the ADNI dataset. • WEKA Evaluator: InfoGainAttributeEval • Parameters: Default settings (no user-modified parameters)
The evaluator outputs an information-gain score for each attribute independently.
Ranker Search Method
The Ranker method orders features according to their Information Gain scores and allows the user to select the most relevant attributes. • WEKA Search Method: Ranker • Parameters: ◦ threshold = 0.0 ◦ numToSelect = −1 (rank all attributes)
A threshold of 0.0 ensured that no feature was prematurely removed. This was especially important because Alzheimer’s biomarkers may exhibit subtle effects. All ranked features were subsequently evaluated in classification experiments to determine their contribution to Naive Bayes performance.
Wrapper-Based Feature Selection
While the filter method evaluates features individually, the wrapper approach considers feature interactions and their direct effect on classifier performance. This method typically yields more accurate and problem-specific feature subsets, albeit at higher computational cost.
Wrapper selection was performed in WEKA using WrapperSubsetEval with Naive Bayes as the embedded classifier and BestFirst as the search strategy.
WrapperSubsetEval
The evaluator assesses candidate feature subsets by training and testing the Naive Bayes classifier on each subset. This allows the method to directly optimize predictive performance. • WEKA Evaluator: WrapperSubsetEval • Parameters: ◦ classifier = NaiveBayes ◦ evaluation = cross-validation ◦ folds = 5 ◦ seed = 1 ◦ Default values for remaining options
A 5-fold cross-validation protocol was selected to balance evaluation stability and computational efficiency. The use of Naive Bayes ensured methodological consistency, as it was also the final classifier used in the study.
BestFirst Search Method
The BestFirst algorithm performs greedy hill-climbing combined with backtracking, enabling efficient exploration of the feature-subset space. • WEKA Search Method: BestFirst • Parameters: ◦ direction = forward ◦ stale = 5 (stop after 5 non-improving expansions) ◦ Default caching enabled
A forward search strategy begins with an empty set and incrementally adds attributes that improve classification accuracy, which is appropriate when many irrelevant or redundant features exist—as is typical in ADNI’s high-dimensional structure. The “stale” parameter prevents overfitting by stopping the search when no further improvement is observed.
Results
The obtained results using the previous different approaches were 85.1% for the entire dataset without applying any feature selection approach and this is due to that any classifier can hardly cope with large amounts of irrelevant features. Then three different feature selection approaches have been implemented on the ADNI dataset.
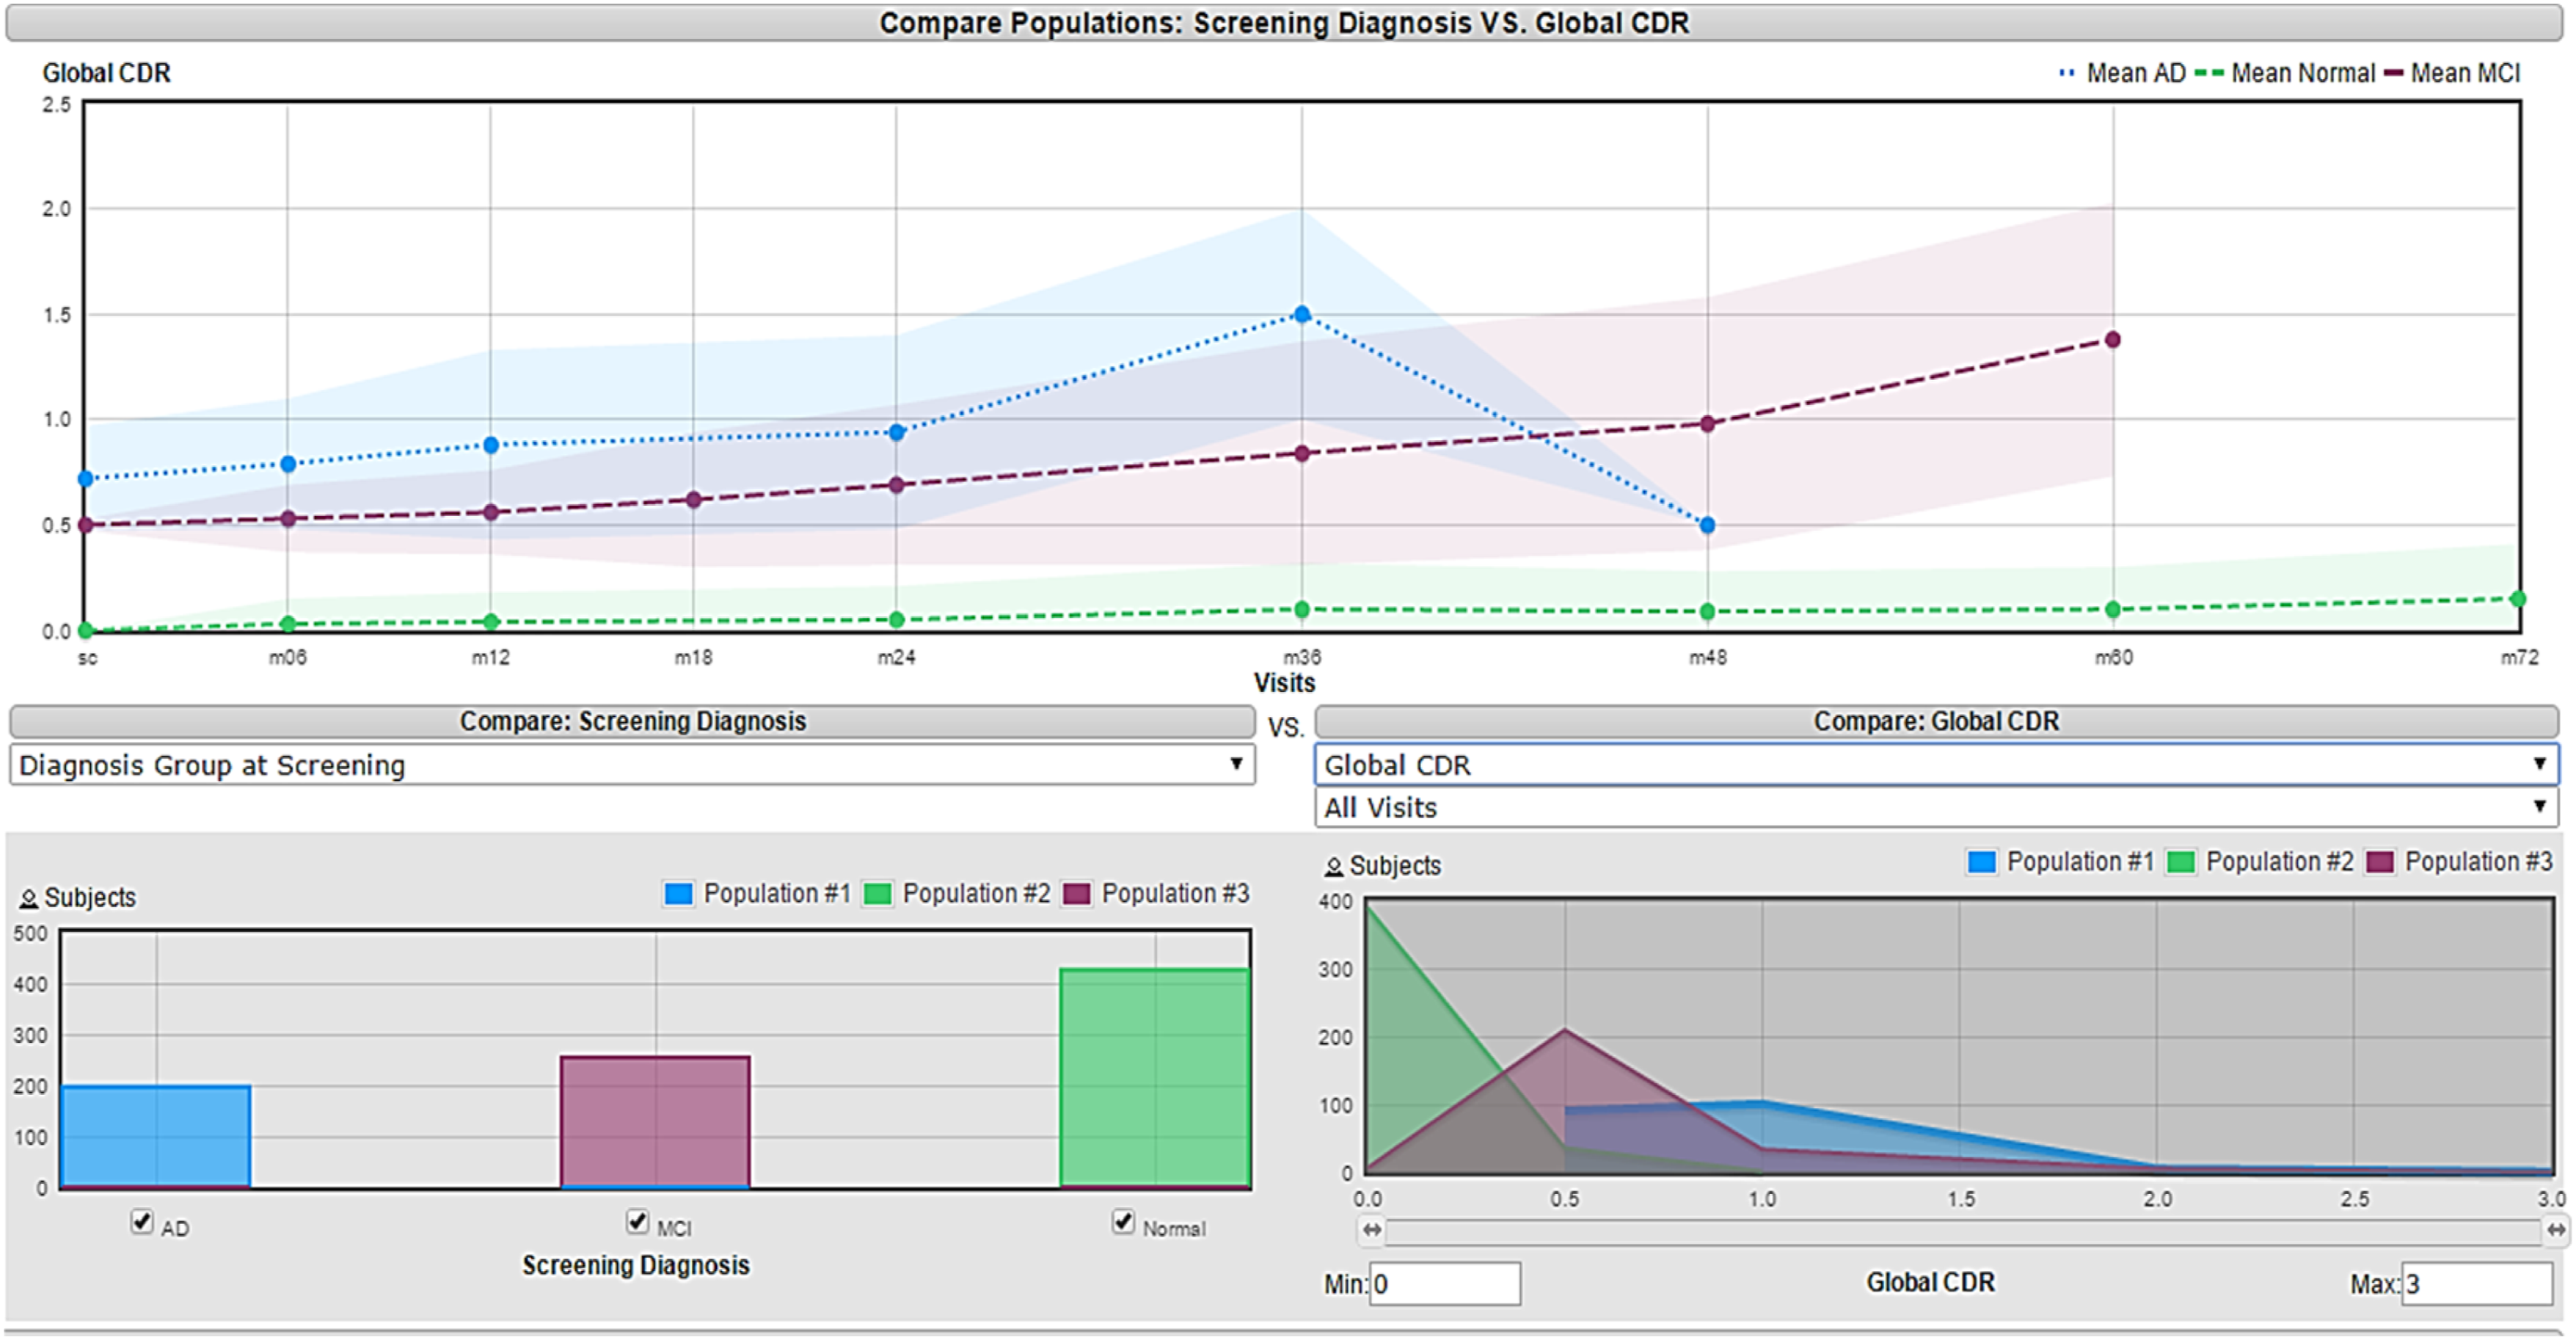
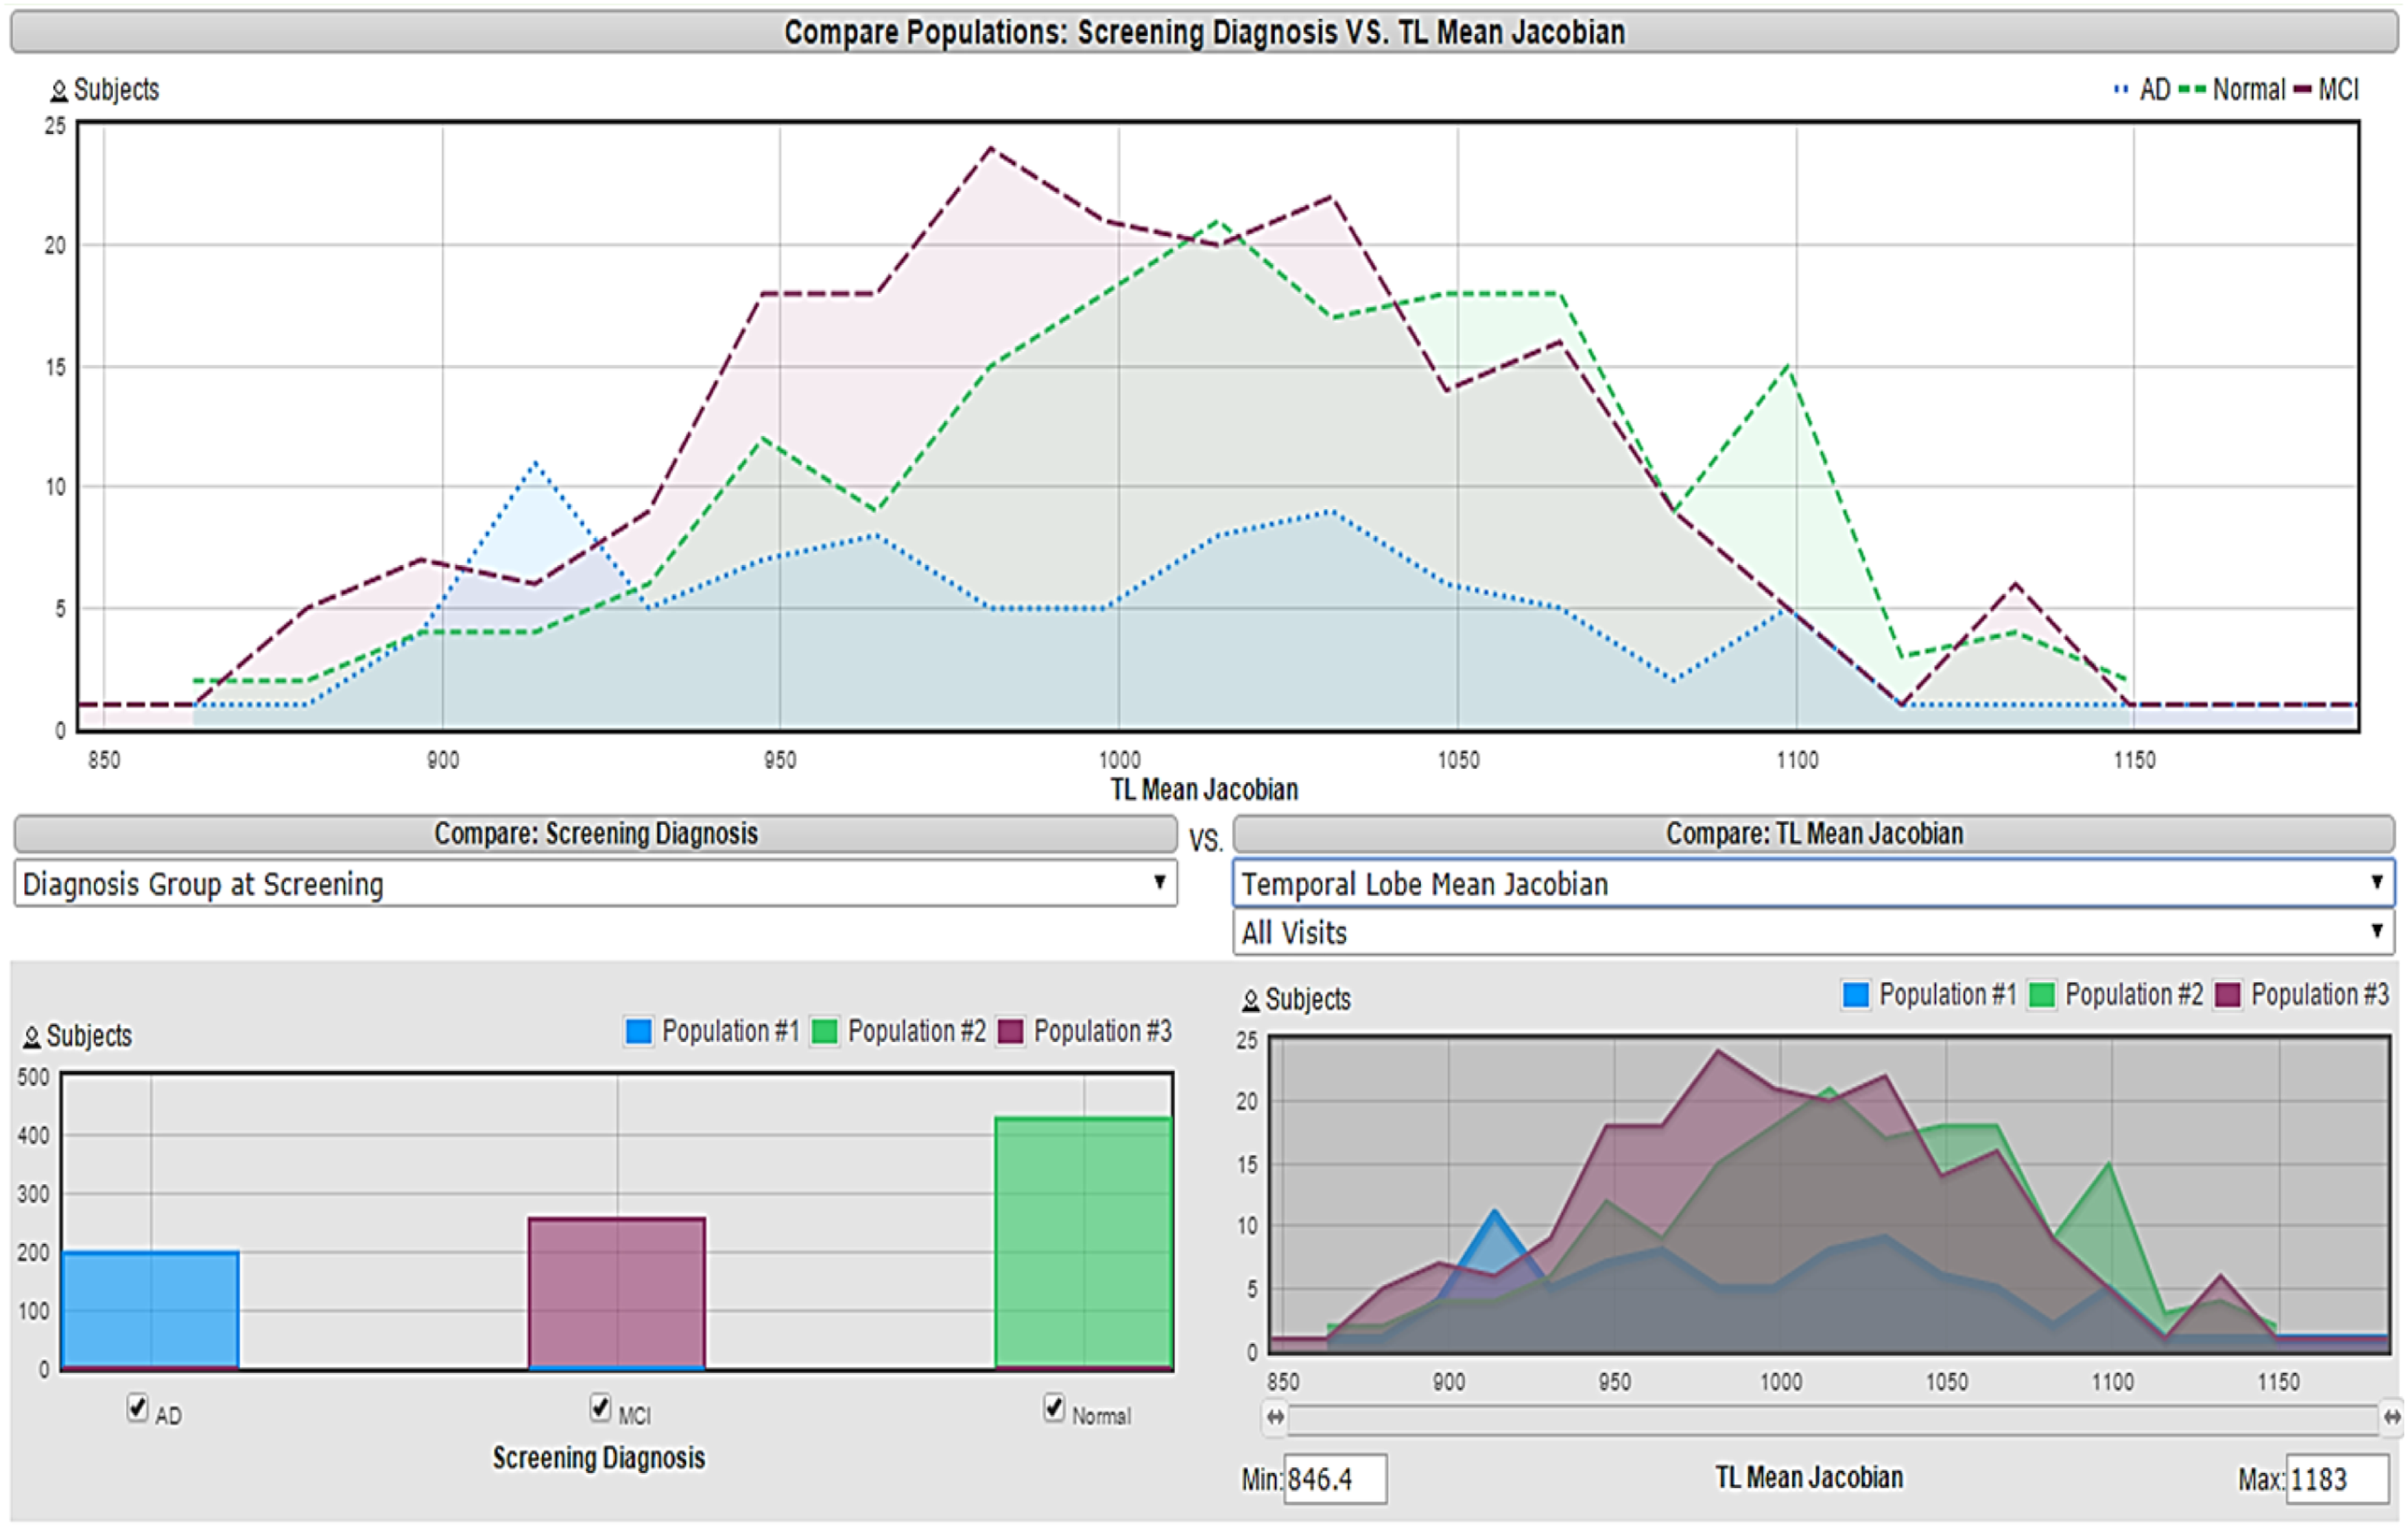
Visualization approach in which each feature’s histogram is presented vs the three target classes and the criterion for eliminating the feature depends on the amount of overlapping. This method slightly enhanced the accuracy obtained to 86.19%. An example of a selected feature using a visualization approach is shown in Figure 3, which is the global CDR since its histogram does not show a lot of overlap between the three classes. Figure 4 represents a Temporal Lobe Mean Jacobian, the histogram in the bottom right corner shows high overlapping between the three classes, making it difficult to be used for classification purposes. Visualization of global CDR feature
15
Visualization of Temporal Lobe Mean Jacobian feature
15
The filter approach improves the accuracy to 91.87% furthermore, the wrapper approach enhances the performance, and its classification accuracy is the best with 96.77%. This high accuracy resulted from the wrapper approach because the internal evaluator for the feature subset is NB so it leads to selecting the features that are highly fitted to NB which is the classification algorithm in the system.
The obtained results show that only 7.5% of the available features were sufficient in building a reliable classifier for the ADNI dataset. This implies that only six out of the 80 features are considered useful – this result is verified by high classification accuracy. Another conclusion is that the wrapper technique for feature selection provided competitive performance as compared to the other approaches. Moreover, some features were common between different approaches which are: Global CDR, Functional Assessment Questionnaire, Total Score, and MMSE Total Score which reflect the importance of these features in the diagnosis of AD. Also, this project aims to inspire researchers in the AD community to investigate more deeply to discover the hidden relationship between these features and the early stages of AD.
Future work will focus on validating our feature subset in new subjects. Also, using filter and wrapper approaches with new configurations such as changing the evaluator, search method and threshold for the filter. Implementing feature extraction methods, such as Principal Component Analysis (PCA), transforms features into a low-dimensional space.
Conclusions
The purpose of this study was to explore how important it is for classifiers to select features effectively, especially with complex, high-dimensional datasets such as ADNI. Think of it like sifting through a mountain of data to find the most valuable nuggets. Using a combination of visual exploration, filtering methods, and wrapper-based approaches, we managed to shrink the feature space by an impressive 92.5%. The exciting part is that we still achieved a high classification accuracy of 96.77% using a Naive Bayes classifier. Upon comparing these different methods of feature selection, it became clear that the chosen technique can affect the classification results. Furthermore, we pinpointed four features that consistently stood out across all methods. The power of strategic feature reduction lies in its ability to make the designed models more efficient without sacrificing the accuracy of their predictions. In conclusion, our findings imply that careful feature selection is not just a nice-to-have but an essential component of optimizing machine learning workflows in high-dimensional biomedical data applications. Smart data management is all about focusing on what truly matters.
Footnotes
Acknowledgements
Data collection and sharing for this project was funded by the Alzheimer’s Disease Neuroimaging Initiative (ADNI) (National Institutes of Health Grant U01 AG024904) and DOD ADNI (Department of Defense award number W81XWH-12-2-0012). ADNI is funded by the National Institute on Aging, the National Institute of Biomedical Imaging and Bioengineering, and through generous contributions from the following: AbbVie, Alzheimer’s Association; Alzheimer’s Drug Discovery Foundation; Araclon Biotech; BioClinica, Inc.; Biogen; Bristol-Myers Squibb Company; CereSpir, Inc.; Cogstate; Eisai Inc.; Elan Pharmaceuticals, Inc.; Eli Lilly and Company; EuroImmun; F. Hoffmann-La Roche Ltd and its affiliated company Genentech, Inc.; Fujirebio; GE Healthcare; IXICO Ltd.; Janssen Alzheimer Immunotherapy Research & Development, LLC.; Johnson & Johnson Pharmaceutical Research & Development LLC.; Lumosity; Lundbeck; Merck & Co., Inc.; Meso Scale Diagnostics, LLC.; NeuroRx Research; Neurotrack Technologies; Novartis Pharmaceuticals Corporation; Pfizer Inc.; Piramal Imaging; Servier; Takeda Pharmaceutical Company; and Transition Therapeutics. The Canadian Institutes of Health Research is providing funds to support ADNI clinical sites in Canada. Private sector contributions are facilitated by the Foundation for the National Institutes of Health (![]() ). The grantee organization is the Northern California Institute for Research and Education, and the study is coordinated by the Alzheimer’s Therapeutic Research Institute at the University of Southern California. ADNI data are disseminated by the Laboratory for Neuro Imaging at the University of Southern California.
). The grantee organization is the Northern California Institute for Research and Education, and the study is coordinated by the Alzheimer’s Therapeutic Research Institute at the University of Southern California. ADNI data are disseminated by the Laboratory for Neuro Imaging at the University of Southern California.
Ethical Considerations
This study involves secondary analysis of existing public data obtained from the Alzheimer’s Disease Neuroimaging Initiative (ADNI).
Consent to Participate
The original collection of the data was approved by the institutional review boards of all participating institutions. Informed consent was obtained from all participants involved in the study. This secondary analysis did not involve direct interaction with human participants, and therefore, no additional ethical approval was required for this study.
Author Contributions
Conceptualization, Farah M., and Abeer A.; Methodology, Farah M., Abeer A; Writing—original draft preparation, Farah M., Abeer A., and Wisam A.; Writing—review and editing, Farah M., Abeer A., and Wisam A.; Project administration, Farah M., Abeer A., and Wisam A.
Funding
The authors disclosed receipt of the following financial support for the research, authorship, and/or publication of this article: Data collection and sharing for this project was funded by the Alzheimer’s Disease Neuroimaging Initiative (ADNI) (National Institutes of Health Grant U01 AG024904) and DOD ADNI (Department of Defense award number W81XWH-12-2-0012).
Declaration of Conflicting Interests
The authors declared no potential conflicts of interest with respect to the research, authorship, and/or publication of this article.
Data Availability Statement
Data used in preparation for this article was obtained from the Alzheimer’s Disease Neuroimaging Initiative (ADNI) database (adni.loni.usc.edu). As such, the investigators within the ADNI contributed to the design and implementation of ADNI and/or provided data but did not participate in analysis or writing of this report. A complete listing of ADNI investigators can be found at: ![]() .
.