
Abstract
Handwriting is a preferred identifier in detecting Alzheimer’s disease that enables diagnosis about people. The aim of this study is to evaluate the handwriting and make the early detection and diagnosis of Alzheimer’s disease with the highest possible prediction rates. In this regard, 9 machine learning algorithms were used. Seven feature selection methods were used to determine the most effective features for Alzheimer’s disease prediction to eliminate unnecessary ones and increase model prediction performance. The models were trained and tested on the DARWIN dataset with both train - test split and cross-validation methods. According to the results, it has been evaluated that the highest performance criterion values are generally achieved when the SHAP is used as the feature selection method. According to the results, the appropriate model that achieved the highest performance values was determined as the hybrid SHAP-Support Vector Machine model with 0.9623 accuracy, 0.9643 precision, 0.9630 recall and 0.9636 F1-Score.
Introduction
Diseases that originate from factors such as lifestyle, head trauma, and aging 1 often resulting in cognitive problems, have been frequently encountered in recent years. Since it is known that life expectancy is increasing, it is thought that these diseases will become more common in the future. 2 Alzheimer’s disease is the most common form of dementia, which is an important cognitive problem and accounts for 60% of it. It is known that the main risk factor for Alzheimer’s disease, which starts quite insidiously and progresses slowly, is old age. 3 Alzheimer’s is an extremely challenging neurological disorder that causes patients to become so severe that they cannot fulfill their daily needs. 4 It is known that the preclinical period of this chronic disease, in which neurons undergo structural deterioration, is approximately 20 years, and the clinical period is 8-10 years. 5 It is also considered a community disease, as 1 person is diagnosed with the disease every 3 seconds. 6 Although there is no definitive treatment for this disease, which has a high incidence, early diagnosis can slow down the disease. 4 Early diagnosis has become very important, especially due to the complexity in the treatment processes of neurodegenerative diseases. This is known to reduce the severity of the disease and improve the quality of life of patients who have problems in the pre-symptomatic phase. 7 For this reason, developing strategies for early diagnosis has become popular and interest in this field has increased. 8
When considering Alzheimer’s disease, diagnostic methods such as identification of blood-based protein biomarkers, 9 odor identification screening 10 and analysis of MR images11-14 can be used. In addition, handwriting, which requires fine motor skills, is considered an important determinant of Alzheimer’s disease because it is sensitive to age-related impairments in cognitive functioning. When it comes to Alzheimer’s, individuals’ handwriting differs from healthy individuals. Examining handwriting is of interest to researchers in different fields such as physicians, neuroscientists, psychologists and computer scientists and is an important subject of interdisciplinary study. In addition, thanks to developing technologies, there are changes in data collection processes and both static and dynamic data about handwriting can be collected. In this way, real-time diagnosis and monitoring of the disease is possible. 15 Therefore, analysis of handwriting data is thought to facilitate the diagnosis, detection and monitoring of Alzheimer’s disease. 16
Machine learning algorithms have been successfully applied in medicine and healthcare17-20 to extract useful and understandable information and develop automated solutions. Thanks to its flexibility and scalability, machine learning has the feature of being a useful method for many purposes in the field of healthcare, such as risk classification, analyzing various types of data, diagnosis and classification, and survival predictions. 21 In particular, by automating the analysis process, it contributes to early diagnosis, allowing timely medical interventions and providing a more in-depth understanding of Alzheimer’s disease. 22 The success of this method in classification applications has been proven to be quite high. 23 However, the development of technology has enabled the production of large volumes of data, which has caused the data size and complexity to gradually increase. 24 The most important step in a machine learning modeling process is to use data that is clean. Because the performance of machine learning models depends significantly on the quality of the data obtained. 25 Feature selection is also 1 of the critical data preprocessing tasks used to improve data quality. 26 This task is the process of creating a subset of features by determining the features that are effective on the result among the features in the dataset. 27 Feature selection methods are basically divided into 2 categories: filters and wrappers. Wrapper-based methods, which provide better results than filters by considering the relationships of features, have recently achieved significant success in feature selection tasks. 28
The aim of this study is to evaluate the handwriting and make the early detection and diagnosis of Alzheimer’s disease with the highest possible prediction rates. The DARWIN dataset
29
was used for handwriting data for the accurate identification of patients with and without Alzheimer’s disease. The main contributions of this review article can be summarized as follows: 1. Seven different optimization methods adapted to the feature selection task were used to remove irrelevant and unnecessary features from the process in order to improve classification results and increase the performance of the models by reducing model complexity. 2. Nine different supervised machine learning algorithms, 6 single (Bayes Point Machine, Averaged Perceptron, Logistic Regression, Support Vector Machine, Neural Network, nu- Support Vector Machine and Decision Tree) and 2 ensemble (Boosted Decision Tree, Random Forest, and Decision Jungle), were used to obtain classification prediction results. 3. A total of 72 (9 machine learning models × (7 feature selection algorithms + all features)) classifier models were trained and their performances were evaluated to determine the optimal feature selection method-machine learning algorithm combination and to examine the effects of feature selection methods.
After presenting the introduction, similar studies in the literature are described in the Related Work section. The Methodology and Methods section explains the study design and methods. Experimental Results are then presented, followed by the Explainability Metrics and Interpretability of the Model section. Finally, the paper concludes with the Results and Discussion and Conclusion sections.
Related Work
Handwriting is a characteristic element that allows making certain comments about people. Handwriting, which is a very complex function, varies depending on age and health status. Therefore, analyzing it will guide researchers. This subject, which appeals to a very wide field of study, has become an important research topic for data analysts and computer scientists, especially in health sciences. It is possible to early detect and diagnose Alzheimer’s disease, a very important neurological disease, by examining the handwriting of individuals, especially those in the older age group. For this reason, researchers are interested in diagnosing Alzheimer’s disease through handwriting.
Dhanusha et al 7 stated that labeled data is not always available when using clinical data, and they used an unsupervised deep learning model for the early diagnosis of Alzheimer’s disease. It has been stated that more successful clustering results are achieved with the proposed optimization-based clustering model than with other standard models. Another study stated the difficulties of data collection 30 and used a data augmentation method increase the data size. It was stated that the classification model developed with a convolutional neural network on this data set was successful with 87.04% accuracy, 85.19% precision and 88.89% recall results. In the machine learning study conducted by Önder et al 31 to diagnose Alzheimer, 4 classification methods, XGBoost, GradientBoost, AdaBoost, and voting, are used on the dataset obtained from the University of California. A prediction accuracy of 85% was achieved equally with the XGBoost and Gradient Boost algorithms, contributing to the diagnosis.
Studies Carried Out on the DARWIN Dataset

De Gregorio et al 8 carried out an application with a data set containing 175 participants performing 25 different handwriting and drawings to distinguish between healthy individuals and individuals with Alzheimer’s disease. In this study, 6 machine learning algorithms were used and by combining the best classifier results for the tasks, an overall accuracy of 91% was achieved. In the study conducted by Borra et al 22 3 different machine learning-based prediction models were developed and their performances were compared. It was found that the Extra Trees Classifier model, 1 of the models tested on the DARWIN dataset, showed an accuracy of 0.849 in Alzheimer’s diagnosis. Additionally, the results are thought to guide measures to prevent the disease. However, since there is a very high number of attributes in the DARWIN dataset with 450 attributes, there are also studies that focus on feature selection methods in the data pre-processing processes in order to increase the performance of the models developed on this dataset. In the study conducted by Subha et al 23 the importance of feature selection was emphasized, and a Particle swarm optimization feature selection-based hybrid machine learning model was developed in the diagnosis and prediction of Alzheimer’s disease. Results of the application with the DARWIN dataset, show that the best performance was achieved with the Random Forest algorithm, with an accuracy of 0.9057, using 20 features. In the study conducted by Gattulli et al 6 using the DARWIN data set, 9 different classification models were developed, and it was stated that the proposed model revealed cases that were incorrectly predicted by other classification models. In the study conducted by Ngnamsie et al 32 researchers addressed the problem known as the curse of dimensionality caused by the large number of features in the handwritten data set. The study that the proposed method was successful in increasing the performance in the early detection of Alzheimer’s disease. While the dataset maintains its popularity in the detection of Alzheimer’s disease, it has also been used in studies33,35,36 in recent years with single and ensemble different machine learning algorithms and feature selection methods.
Even though former research shows pathways on feature selection methods used, including forward and backward feature selection, and Particle Swarm Optimization, they are still limited. In order to fill this gap in the literature, this study aims to examine the effects of 6 different nature-inspired wrapper feature selection optimization algorithms (Particle Swarm Optimization, Gray Wolf Optimization, Dragonfly Optimization, Harris Hawks Optimization, Genetic Optimization and Gravitational Optimization) and game theory-based SHAP algorithm on machine learning models.
Methodology and Methods
The methodology proposed in the study for Alzheimer’s diagnosis and detection is presented in Figure 1. The developed methodology basically consists of 5 steps. First, the DARWIN dataset, which was developed for the early prediction of Alzheimer’s disease, was obtained. Then, the data transformation process was applied in the data pre-processing step. Six feature selection methods were applied separately on the dataset ready for analysis, resulting in new dataset refined from unnecessary features. In the model development step, 9 different machine learning models for Alzheimer’s disease prediction are built, using the dataset containing all features and the datasets refined by feature selection methods. The modeling stage was carried out in 2 different approaches. First, the dataset was randomly split and classified using the training-test split method, with 70% allocated for training and 30% for testing. Second, the models were trained by applying k-fold cross-validation for bias and robustness assessment. In the step 5, Alzheimer’s disease prediction models were trained using 9 different two-class classification algorithms on the dataset containing all features and datasets obtained by feature selection methods. In the last step, the performances of the developed models were evaluated with accuracy, precision, recall and F1-Score performance criteria, and the best-performing feature selection-machine learning algorithm combination was selected. In the last step of the study, the evaluation and interpretation of the models were performed. Cross-validation and confidence intervals were used for model evaluation and SHAP analysis was used for interpretability. Methodology of the Study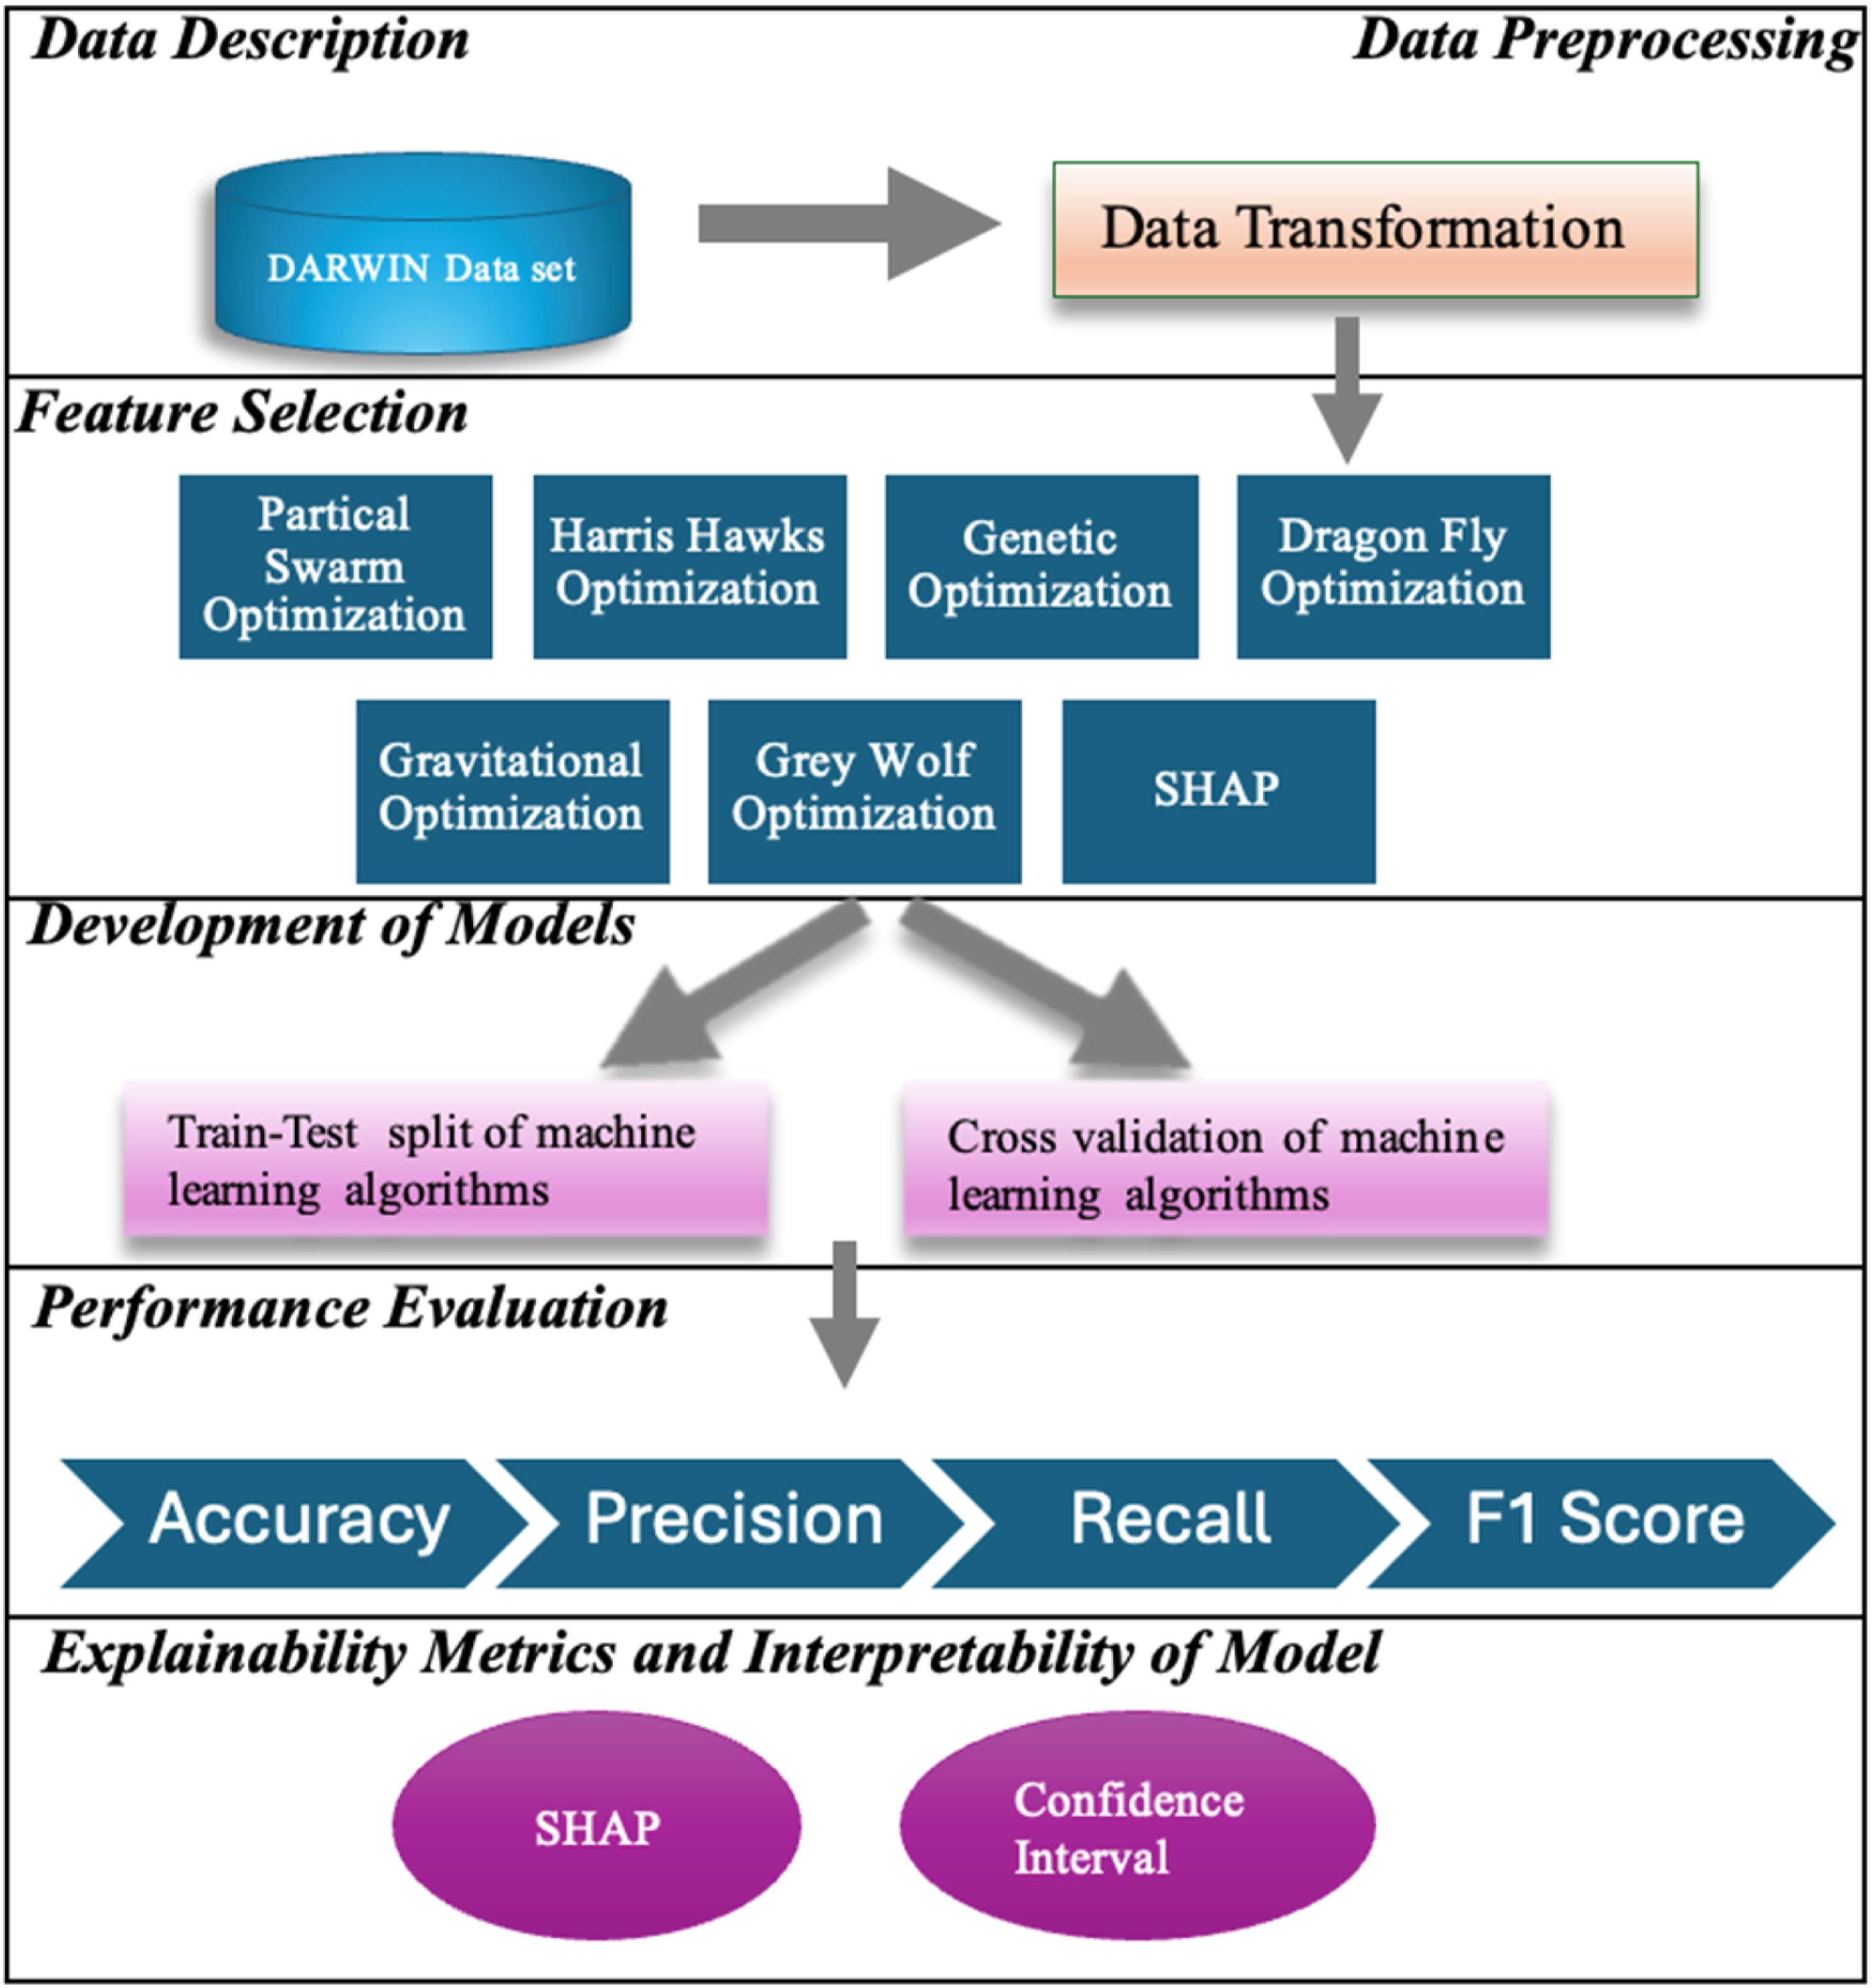
Data Description
The dataset to be used in the study was obtained from the UCI machine learning data repository. The reason for creating the DARWIN dataset is due to its richness in including biological, genetic and clinical data, 29 for both individuals with Alzheimer’s disease and the control group. This comprehensive data set allows us to see the variation across individuals’ handwriting information and classify them with machine learning algorithms. The data set contains data from a total of 174 participants; (i) 89 of these individuals with Alzheimer’s disease, and (ii) 85 are healthy individuals. During data collection, individuals engaged with 25 tasks that belong to the categories of graphic tasks, copy tasks, memory tasks, and dictation tasks. In this study, the DARWIN dataset and its associated tasks were selected because they are frequently used in clinical settings to evaluate early signs of cognitive and motor decline, particularly in individuals with neurodegenerative diseases. Their inclusion enhances the clinical relevance of the dataset. Additionally, feature selection and interpretable modeling techniques were employed to increase model transparency and interpretability, thereby supporting the reliability and reproducibility of the study—especially considering the limited number of available samples.
In the feature selection phase of Cilia (2022)
29
study from the data for the tasks, 18 features with continuous values were created for each task, as shown in Figure 2. In this way, a total of 450 input features were obtained. The data set also contains a two-class output attribute called ‘class’, which indicates whether each sample is a healthy (H) or patient (P) individual. Features of the DARWIN Dataset
The features in the DARWIN dataset are also grouped into 3 main feature sets: time-based features, movement-focused features, and pressure-related features. Time-based features include the time it takes for an individual to complete a task and the time it takes to hold the pen in the air, providing clues about cognitive processing speed. These times can be observed to be longer in Alzheimer’s patients. Movement-related features are criteria that evaluate motor functions such as average writing speed, acceleration, and tremors during writing. Slowing or irregularities in such parameters may indicate cognitive or motor impairments. Pressure-based features analyze the regularity and variation of the force applied by the pen to the surface, which may reveal deteriorations in motor skills. The grouping of features by themes is as follows.
36
• Time-related: total_time, air_time, paper_time • Movement-related: mean_speed_on_paper, mean_speed_in_air, mean_acc_on_paper, mean_acc_in_air, mean_jerk_in_air, gmrt_on_paper, gmrt_in_air, mean_gmrt, num_of_pendown, max_x_extension, max_y_extension, disp_index • Pressure-related: pressure_mean, pressure_var
Data Preprocessing
Data preprocessing is the cleaning, coding, and transformation processes performed on the data to increase the consistency and success of the model’s result value.
37
In this step, data transformation was applied as data pre-processing. The values of the input features in the dataset vary in quite different ranges. For this reason, the MinMax normalization method, 1 of the data transformation methods, was applied to all input attributes using equation (1), and the input features were transformed to take values in the [0–1] range. Here, X denotes the attribute value to be normalized, Xn denotes the new normalized value, Xmin denotes the minimum value of the attribute, and Xmax denotes the maximum value of the attribute.
Feature Selection
The feature selection process aims to increase accuracy and shorten calculation time by removing irrelevant variables from the dataset. 38 Applying feature selection methods, can overcome the overfitting problem, reduce the cost of obtaining attributes, and increase model interpretability. After the data was ready for analysis, 6 wrapper optimization algorithms and a SHAP algorithm based on cooperative game theory were used to determine the most effective features for predicting Alzheimer’s disease. These methods, which are 6 wrapper optimization algorithms inspired by nature, are Particle Swarm Optimization (PSO), Gray Wolf Optimization (GWO), Dragonfly Optimization (DFO), Harris Hawks Optimization (HHO), Genetic Optimization (GO) and Gravitational Optimization (GVO) algorithm. The method based on game theory is the SHAP method. Each feature selection method was applied independently and their results were compared to assess their individual impact on classification performance.
PSO
It is a meta-heuristic method based on swarm movements and has a very simple structure and the number of parameters it requires is small. It is stable because it uses local and global search capabilities together. 39 As a working principle, after a certain number of particles are placed in the search area, each particle evaluates the objective function according to its position. Particles determine their movements according to the particles in the swarm. The process ends when each particle completes its movement and a new iteration begins. 40
GWO
This optimization method is a type of swarm intelligence algorithm. It is based on the hunting processes of wolf packs. These processes consist of pursuit, containment and attack stages. 41 The working principle is based on solving each stage: alpha, beta and delta. 42 The algorithm is highly preferred because it is parameter-free, user-friendly, and is designed with flexible and adaptable features. 41
DFO
This method, which is based on the static and dynamic swarm movements and swarming behaviors of dragonflies in nature, is stated to be more effective and efficient than other metaheuristic algorithms. 43 While their hunting behavior refers to static movements, their one-way flying behavior during migration refers to dynamic movements. 44 The algorithm determines movements by searching for solutions based on 5 basic behaviors: separation, alignment, adaptation, attraction to food sources, and distraction towards the enemy. 45
HHO
This algorithm was developed based on the hunting behavior of Harris Falcons, 1 of the most intelligent birds. 46 In this method, which uses the tracking styles that emerge while tracking the prey, hawk groups show candidate solutions and the location of the prey shows the optimum candidate solution. 47 It is frequently preferred by researchers due to the successes achieved in different range of problems. 48
GO
Genetic optimization, a computational method based on the principles and processes in natural genetics, begins its search activities with a random solution set. Then, assignments are made to the objective function and a new population is obtained by applying generation, crossover and mutation operations to the solution population. Due to its high adaptability, it can be easily applied to real-life problems and offers a global perspective. 49
GVO
This algorithm is based on the theory of gravity. It is a heuristic optimization algorithm that is successful in producing solutions to multimodal problems. 50 It is subject to the laws of gravity and motion. 51
SHAP
This method is a concept influenced by game theory, SHAP is a feature selection method that determines how much each feature affects the prediction result in machine learning models.52,53 After the original dataset is entered into the model, the method calculates the contribution value by measuring the importance of each feature, then ranks each feature to find the importance order. 54 This method, which offers a more consistent and comprehensive approach to evaluating feature importance than classical metrics, aims to determine a small number of meaningful features that most affect the model’s decisions.52,55
The feature selection steps were implemented in Python 3.6.13 using the Spyder 3.1 development environment. At this stage, the open source ‘zoofs’ library was used. In applying the optimization algorithms, the ‘LightGBM’ Python library 56 was used for the LightGBM machine learning algorithm. For the parameters of the LightGBM model, the number of leaves was determined as, 31 the learning rate was 0.1, and the number of estimators was 100. As a result of the experiments, the number of input attributes in the dataset was decreased to 202 with PSO, 24 with GWO, 206 with DFO, 82 with HHO, 128 with GO, and 216 with GVO and 20 with SHAP.
Model Development
For this research, a total of 72 machine learning models were developed by applying 9 different supervised machine learning algorithms separately on the features determined by feature selection methods and on full features, in order to obtain the classifier model that will enable the prediction of Alzheimer’s disease from handwritten information. The two-class classification algorithms used are Bayes Point Machine (BPM), Averaged Perceptron (AP), Logistic Regression (LR), Gradient Boosted Decision Tree (BDT), Support Vector Machine (SVM), Neural Network (NN), Random Forest (RF), nu-Support Vector Machine (nu-SVM) and Decision Tree (DT).
SVM
This kernel-based algorithm, which emerged in 1992, is a supervised learning model and is based on statistical learning theory. In addition, a strong aspect of this algorithm is that it can be used in the development of both classification and regression models. The algorithm that performs analysis on input data recognizes relationships in the hyperplane space. As a working principle, it focuses on speed rather than accuracy.57,58
BPM
Based on the Bayes principle, this algorithm applies a Bayesian approach using the Support Vector Machine algorithm for linear classification. Therefore, it turns into a non-linear classifier that does not adapt to the training data. 59
NN
The neural network, which mimics the brain structure, has a network structure consisting of interconnected layers. The neuron, which forms the layers and is the basic unit of the algorithm, takes inputs and creates the output through a function. If the model run in the network structure is repeated with sufficient time, very successful results can be obtained. 60
AP
This algorithm is the simplest form of a neural network and generates output in response to inputs based on a linear function. The output is created by combining various weights obtained from the feature vector. Despite its simpler structure compared to neural networks, this algorithm has the advantage of producing faster solutions. 61
GBDT
Decision trees are a frequently preferred approach with their easily interpretable structures, used to produce results from existing data. 62 Boosted Decision Tree is an ensemble model created to reduce the errors of decision trees. The possibility of visually presenting the results obtained from this model increases the understandability of the algorithm, and therefore it is frequently preferred.59,60
RF
In this method used for classification and prediction, a series of decision trees are combined, and the decision is made according to the voting principle, and the result of the decision tree that receives the most votes is valid. In this process, tests are performed separately on all tree classes, and the process continues by increasing the tree structure level until the result is produced at the leaf node. 57
DT
Decision trees, which are a very practical method that recursively divides the sample space, consist of root, intermediate and leaf nodes.63,64 The operation of the algorithm starts from the root node and progresses through intermediate nodes to leaf nodes. Leaves represent classes, and there is only 1 path to each leaf. 65 Instances are classified from the root to the leaf as a result of tests on this path; the class prediction of the resulting leaf node can be expressed in the form of a rule. 66 Decision trees can also be reconstructed with rule sets in the IF-THEN format and can handle both nominal and numerical features.64,66
nu-SVM
This method is an alternative SVM variant to C-SVM (C-Support Vector Machine) proposed by Schölkopf et al (2000). 67 nu-SVM introduces a parameter called nu, which directly controls both the upper bound of the support vectors and the upper bound of the training errors. This approach increases the flexibility of the model in classification and regression problems, while also facilitating hyperparameter tuning. The ν parameter helps prevent over-learning of the model by adjusting the balance between margin (boundary width) and slack variables (elasticity margin). 68 It has shown better generalization performance, especially in imbalanced datasets and noisy environments. 69
LR
This algorithm, based on statistics, is based on estimating the probability of events occurring. This algorithm, which provides probabilistic analysis for categorical data, performs the prediction task through independent variables that directly affect the dependent variable. It also examines the effects of variables on the result by explaining the relationships and interactions through parameter extraction. 70
The modeling and training procedures were carried out using Python, which is widely used for machine learning applications, along with libraries such as scikit-learn, LightGBM, and zoofs. The models were trained using train - test split and cross-validation. Moreover, cross-validation was applied to assess data bias and improve model robustness. The performance results obtained from the train - test split and cross-validation approaches were compared to evaluate the consistency and generalizability of the models.
Train - Test Split
Hyperparameter Values Determined for the Train - Test Split Models

Cross Validation
Hyperparameter Values Determined for the Cross Validation Models

Performance Evaluation
The performance criteria to be used to evaluate and compare the performances of the different models were determined as accuracy, precision, recall and F1-Score, which are widely used for classification models in the literature. Performance measures were calculated using equations (2)-(5).
79


Here, TP refers to the number of diseased samples predicted as patient, and TN refers to the number of healthy samples predicted to be healthy. FP is the number of healthy individuals predicted to be patients, FN is the number of diseased individuals predicted to be healthy.
Experimental Results
Train and Test Split Results
Figure 3 presents the accuracy values obtained from 9 different machine learning algorithms that are trained using a train - test split for on both full feature sets and features selected by feature selection methods. It can be seen that the SVM model, which is trained on the features selected with the SHAP algorithm, provides the highest accuracy value, with a value of 0.9623. The lowest accuracy value, with a value of 0.4528, was obtained with the AP model trained on all features. Accuracy Values of the Train/Test Models
Precision values of the 72 classifier models developed are presented in Figure 4. When the values are analyzed, it is seen that the highest precision value, 0.9643, was obtained by using the SHAP feature selection method and SVM classification algorithm hybridly. The second highest precision value was reached as 0.9443 when the PSO and DFO algorithm was used as the feature selection method and the RF algorithm was used as the classifier algorithm. The lowest precision performance was seen as 0.2353 when the AP algorithm with all features. Precision Values of the Train/Test Models
Figure 5 demonstrates the recall performance criterion values obtained for all prediction models trained in the study. The results show that the highest recall value, 0.963, was obtained with SVM trained using the values of the features selected with the SHAP method. The second highest precision value was reached as 0.9443 when the PSO and DFO algorithm was used as the feature selection method and the RF algorithm was used as the classifier algorithm. The lowest precision performance was seen as 0.4615 when the AP algorithm with all features. Recall Values of the Train/Test Models
Finally, Figure 6 presents the F1-Score values for the prediction results of the models. The highest F1-Score result, with a value of 0.9636, was achieved by using the SHAP feature selection method and the SVM algorithm together. The second-best prediction performance in terms of F1-Score, with a value of 0.9436, was achieved by using the PSO algorithm feature selection methods and the RF prediction algorithm. F1-Score Values of the Train/Test Models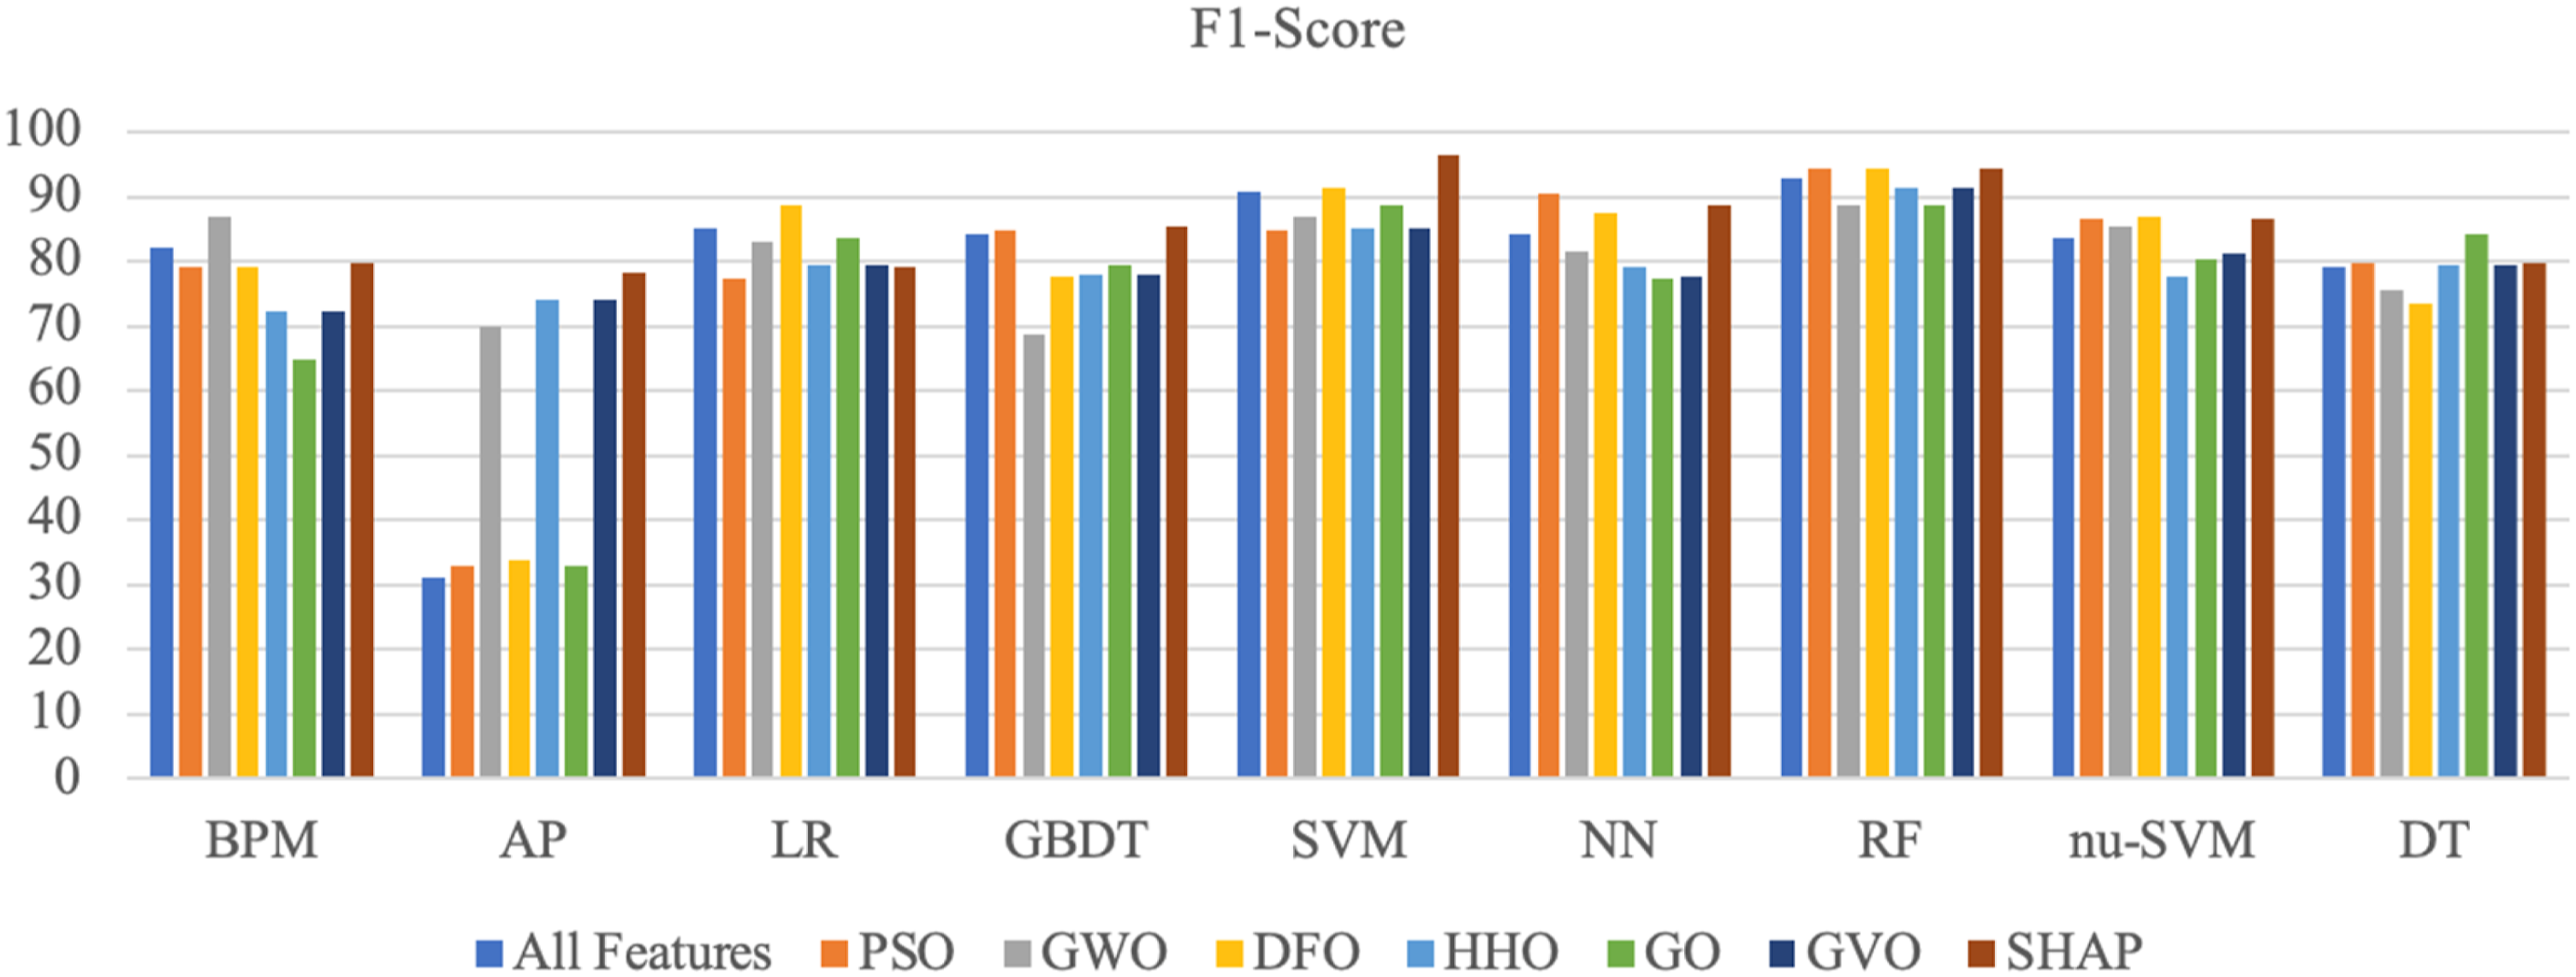
Cross Validation Results
Figure 7 presents the mean accuracy values obtained by testing classifiers that are trained using cross- validation models developed with 9 different machine learning algorithms on all features and on features selected by feature selection methods. It is observed that the SVM model, trained on features selected using the SHAP algorithm, yields the highest mean accuracy value, at 0.9313. The lowest mean accuracy value, with a value of 0.4773, was obtained with the AP model trained on the features selected with the PSO algorithm. Mean Accuracy Values of the Cross-Validation Models
Confidence Intervals of Accuracy Values

Mean precision values of the classifier models developed are presented in Figure 8. The highest mean precision value, 0.9347, was obtained by using the SHAP feature selection method and SVM classification algorithm together. The second-highest mean precision value was achieved at 0.9443 when the GO algorithm was used as the feature selection method and the SVM algorithm was used as the classifier algorithm. Mean Precision Values of the Cross-Validation Models
Confidence Intervals of Precision Values

Mean recall values of the classifier models developed are presented in Figure 9. The results show that the highest mean recall value of 0.9318, was obtained with a SVM Machine trained using the values of the features selected with the SHAP method. The Averaged Perceptron algorithm with the DFO method showed the lowest performance. Mean Recall Values of Cross-Validation Models
Confidence Intervals of Recall Values

Mean F1-Score values of the classifier models developed are presented in Figure 10. The highest mean F1-Score result with a value of 0.9332, was achieved by using the SHAP feature selection method and the SVM algorithm together. The second-best mean F1-Score, with a value of 0.9142, was achieved by using the HHO and GO and SVM algorithm. Mean F1-Score Values of Cross Validation Models
Confidence Intervals of F1-Score Values

Explainability Metrics and Interpretability of Model
SHAP analysis was used to quantify the impact of features on the outcome. In addition, the statistical reliability of the model’s performance was evaluated by calculating 95% confidence intervals for accuracy, precision, recall, and F1 score. Thus, the model was examined in terms of both explainability and reliability.
Explainability Metrics
In this study, the SHAP algorithm was used to increase the interpretability of the classification model. SHAP is an effective explanation method that quantitatively measures the contributions of individual features to the model and thus makes the decision-making process. 80 This method was also used for feature selection in the study.
Selected Features and Descriptions

Importance Values for Selected Attributes With SHAP Analysis

The attribute ‘num_of_pendown19’, which contributed the most to the result, is under the movement-related category. This category signals that the patient has a cognitive and motor skill disorder. 36 Detection of motor skill disorders, such as tremors in Alzheimer’s patients, is extremely important for early diagnosis and intervention. Detection of this attribute paves the way for holistic approaches that can slow down the progression of the disease. 82 Moderate physical activities can support cognitive and motor functions. Therefore, programs that combine physical and cognitive exercises can be offered to individuals affected by the identified attribute, contributing to the preservation and development of motor skills.83,84
Time-related features are critical as they reflect cognitive slowdown, attention deficit, and executive function impairments in the early stages of Alzheimer’s disease. These features are not only a diagnostic tool, but can also guide the construction of individualized digital intervention systems. 85 The time spent in the air (air_time) reflects the cognitive load of the individual in the process of planning and initiating the next movement. Prolongation of this time has been associated with a slowdown in executive functions and distraction. 86 An increase in time on paper (paper_time) indicates psychomotor slowdown and regression in motor skills. Significant prolongation of task completion times (total_time) is parallel to impairments in decision-making, sequence tracking, and attention maintenance processes in Alzheimer’s patients. 87 Such time-based data provides diagnostic support in the early stages by capturing cognitive dysfunctions in an objective and task-based manner.
Pressure-related features reveal subtle changes in motor skills in Alzheimer’s disease. Increased pressure variance (pressure_var) in Alzheimer’s patients indicates loss of control in the hand muscles. 84 This causes the writing activity to become more irregular and weak. Pen pressure levels (pressure_mean) can clearly show how mental decline is reflected in movements. 85 By monitoring these variables, Alzheimer’s disease can be diagnosed early, and personalized prevention approaches can be offered
Interpretability of Model
To minimize the bias caused by the small-size data set and to enhance models’ robustness, cross-validation is recommended. 88 Cross-validation reduces the risk of over-fitting. 89 Since the size of the DARWIN data set considered in the study is relatively small, cross-validation is used instead of the train - test split method. Although the results obtained with the initial 70% train - 30% test data split showed that the models performed at a reasonable level, the cross-validation application did not provide a significant increase in accuracy. It is possible for cross-validation to show poor performance measurements, but even in this case, it provides important insight into the generalization abilities of the models. 90 In this study, the confidence intervals of the performance metrics are calculated through 5-fold cross-validation. SHAP and SVM, run with 70% train - 30% test separation, achieved superior performance with accuracy 96.23%, precision 96.43%, recall 96.30%, and F1 score: 96.36%. The 95% confidence intervals for performance metrics with 5-fold cross-validation are as follows: accuracy [0.891, 0.971], precision [0.8928, 0.9766], recall [0.8943, 0.9694], and F1-Score [0.8936, 0.9729].
Conclusion
A definitive treatment has not yet been developed for Alzheimer’s disease, which is generally known as the disease of the elderly and can cause dementia by damaging brain cells. However, it is known that accurate monitoring of symptoms can prevent the progression of the disease process. This makes early diagnosis of Alzheimer’s disease an important element. Managed by the brain, handwriting is an ability that is affected by neurodegenerative diseases. Because neurodegenerative diseases such as Alzheimer’s, Schizophrenia, Parkinson’s disease, and cognitive disorders affect kinetic movement and result in some changes in an individual’s handwriting. For these reasons, handwriting, which contains individual characteristics, is used as an important determinant for the diagnosis of Alzheimer’s disease. This research was carried out using the DARWIN data set, which was developed for Alzheimer’s disease prediction and obtained during the performance of handwriting tasks. The main objective of the study was to determine the most appropriate feature selection method-machine learning algorithm combination in order to achieve the highest performance for Alzheimer’s disease prediction. In this regard, 7 different optimization-based algorithms were used to determine the most suitable features. In addition, 9 different classification algorithms were used for training purposes in the developed models.
The performance of models was compared using both train - test split and cross-validation methods. The evaluation phase was carried out according to the performance criteria of accuracy, precision, recall and F1-Score. In addition, SHAP was used to determine the importance levels of the features on the prediction results. Confidence intervals were used to evaluate the statistical validity, consistency and reliability of the model. When the resulting performance criteria were examined (Figures 3-10), it was seen that the feature selection methods generally increased the performance of the models. The most successful results were obtained with SHAP and SVM models across all performance metrics using the train/test split method. When the performance metrics were evaluated; • Accuracy is a performance metric that is quite important when the classes are balanced and measures the overall accuracy rate. For the model, the accuracy was 0.9623. • The precision metric, which expresses the accuracy of positive predictions — in this study, the ratio of patients prediction to have Alzheimer’s disease who have Alzheimer’s disease — is 0.9643. • The recall metric value, which shows the detection rate of true positives, the correct detection of Alzheimer’s patients, is 0.9630. • The F1-score, which balances between the accuracy of the model and the errors, is 0.9636.
The findings are consistent with recent studies in the field.6,23,32 Similar to the approach adopted by Ahmed et al (2025), 81 20 key features were selected in this study. Furthermore, consistent with other research,84-87 the results emphasize that handwriting-based indicators—such as temporal delays, reduced pressure variability, and spatial irregularities—can effectively distinguish healthy individuals from those with early-stage Alzheimer’s disease. The high predictive accuracy and interpretability obtained from the proposed model suggest that handwriting-based machine learning systems may serve as low-cost, non-invasive screening tools suitable for use in primary care or remote settings. Additionally, the integration of SHAP not only enhances model transparency but also supports the development of personalized monitoring and intervention systems by identifying clinically relevant features.
The study contributes to the literature in multiple ways. First, the study develops a highly accurate machine learning model for Alzheimer’s disease prediction, which contributes to the early diagnosis. Second, the SHAP feature selection technique is integrated into the machine learning prediction model to increase the model’s explainability with less number of features. The reduction in the number of features in disease prediction reduces the time and the cost of prediction. Third, bias and robustness effects, which are often overlooked in prediction models, have been taken into account through cross-validation.
These contributions may enable the acceleration of early diagnosis processes in clinical applications and the making of correct decisions. However, in order for the obtained results to be used more efficiently in clinical applications, it is aimed to collect and analyze real-time data as suggested in the study conducted by Vessio, 15 test the effectiveness of the model in clinical applications, and provide personal support by developing individual clinical support applications.
Footnotes
Funding
The authors received no financial support for the research, authorship, and/or publication of this article.
Declaration of Conflicting Interests
The authors declared no potential conflicts of interest with respect to the research, authorship, and/or publication of this article.