
Abstract
Chemotherapy is a mainstay of therapy for advanced gastric cancer (GC); however, owing to drug resistances, the effectiveness of chemotherapy is not satisfactory for some patients with GC. Therefore, identification of a marker that predicts treatment response is beneficial to patients. Hypermethylation of transcription factor activating enhancer-binding protein 2∊ (TFAP2E) has been implicated in chemotherapy resistance to fluorouracil-based chemotherapy in patients with colorectal cancer, but its role in GC is still unknown. In this study, we investigated TFAP2E as a predictor of treatment response in GC. We used methylation-sensitive high-resolution melting analysis to study the methylation of TFAP2E in 141 GC tissue specimens and 45 adjacent nontumor tissue specimens. In vitro experiments, we analyzed the expression and methylation of TFAP2E and to examine the sensitivity of GC cell lines to 5-fluorouracil (5-FU). The TFAP2E methylation occurred at a significantly higher incidence rate in tumor tissues compared to adjacent nontumor tissues (chi-square [χ2] = 38.919, P < .001). Hypermethylation of TFAP2E occurred more frequently in tumors with lower differentiation grades (P < .001) and was significantly associated with nonresponse to fluorouracil-based chemotherapy (P = .010). Hypermethylation was also associated with decreased expression of TFAP2E (P < .01) and nonresponse to 5-FU exposure in vitro (P < .001). Hypermethylation of TFAP2E was associated with lack of response to fluorouracil-based chemotherapy, indicating that it might be a potential predictor of treatment response in patients with GC.
Introduction
Gastric cancer (GC) is the second leading cause of cancer-related mortality globally, and it is also one of the most common types of cancers in several Asian countries including China, South Korea, and Japan. 1,2 Surgery is the primary treatment for GC, although chemotherapy is required for unresectable advanced GC. 3 Several chemotherapeutic agents including fluoropyrimidines, irinotecan, doxorubicin, platinum, and taxanes are now available for systemic chemotherapy for patients with GC, 4 these agents prolong the survival time of some patients. However, because of drug resistances, the effectiveness of chemotherapy is insufficient for parts of patients with GC. Therefore, identification of a marker that predicts response to chemotherapy is very necessary and could lead to the development of individualized treatment plans for patients with GC.
Epigenetic alteration in genomic DNA is a key process in carcinogenesis. Aberrant gene methylation, which is one kind of epigenetic alteration, can regulate gene expression and change the sensitivity of patients with GC to chemotherapy drugs. A recent report indicated that the epigenetic and expression status of bone morphogenetic protein 4 (BMP4) may be a promising biomarker for cisplatin resistance in GC, and targeting BMP4 may sensitize GC cells to cisplatin. 5 Furthermore, DNA methylation and expression of microtubule-associated protein τ are critical factors in the chemoresistance of GC to paclitaxel. 6 Methylation of Bcl-2/adenovirus E1B, 19-kDa protein-interacting protein 3, and death-associated protein kinase can predict lower response to chemotherapy and poor prognosis in patients with GC. 7
The activating enhancer-binding protein 2 (AP2) transcription factor family has 5 members (TFAP2A, TFAP2B, TFAP2C, TFAP2D, and TFAP2E). This protein family plays important roles in cancer biology, cell proliferation, differentiation, and apoptosis. These proteins can bind to keratin promoters and act as heterodimers or homodimers. 8,9 TFAP2E, the fifth member of the family, shares a high level of sequence similarity with other members of the family in its DNA binding and dimerization domains but is only weakly similar in its N-terminal domain. 10 TFAP2E is located on chromosome 1p34 and has 2 cytosine-phosphate-guanine (CpG) islands, which underscores the potential for regulation of gene expression by CpG methylation. 11 TFAP2E is considered a candidate human tumor suppressor gene 12 and has been found to be hypermethylated in prostate and colorectal cancer. 13 A recent study indicated that hypermethylation of TFAP2E was associated with clinical nonresponsiveness to fluorouracil-based chemotherapy in patients with colorectal cancer, the probability of response was approximately 6 times higher in patients with hypomethylation compared to all samples. 11
Fluoropyrimidines are widely used as chemotherapeutic agents for GC, but the epigenetic alterations that regulate response to fluoropyrimidines in patients with GC are still unknown. In this study, we analyzed the association between TFAP2E methylation level and response to fluoropyrimidine therapy by examining the methylation status of TFAP2E in patients with GC treated with fluoropyrimidine-based chemotherapy and GC cell lines intervened with 5-fluorouracil (5-FU).
Materials and Methods
Patients and Tissue Samples
We obtained samples from 141 patients with GC who underwent surgical resection or gastroscopic biopsies at the First People’s Hospital of Huai’an, affiliated with Nanjing Medical University, between January 2010 and December 2013. Among the 141 patients with GC, 43 were patients with stage IV and resection was not possible. For these unresectable patients, fluorouracil-based regimens were treated to improve survival and prognosis, and responses to treatment were assessed according to Response Evaluation Criteria in Solid Tumors (RECIST). Moreover, 45 adjacent nontumor tissues from patients with GC were collected for this study. All tumor and adjacent nontumor tissues were fixed in formaldehyde and paraffin embedded. Extent of the primary tumor (T), lymph node involvement (N), and metastasis (M) were classified according to the seventh American Joint Committee on Cancer staging system. The Research Ethics Committee of Nanjing Medical University approved this study. Written informed consent was obtained from all patients before enrollment in the clinical trial.
Cell Culture and 5-Aza-2-deoxycytidine Treatment
The GC cell lines MGC803, SGC7901, and BGC823 were obtained from the School of Public Health at Nanjing Medical University. Cells were cultured in RPMI 1640 medium (Gibco; Life Technologies, Carlsbad, California) containing 10% fetal bovine serum (Gibco; Life Technologies), 100 U/mL penicillin, and 0.1 mg/mL streptomycin (Invitrogen; Life Technologies) in a humidified incubator at 37°C in 5% CO2. The cells were treated with or without 5 and 10 μmol/L 5-aza-2-deoxycytidine (Sigma, St Louis, Missouri). The culture medium was changed daily for 3 days with addition of 5-aza-2-deoxycytidine. After 3 days, the cells were harvested for protein extraction with radioimmunoprecipitation assay (RIPA) buffer (Beyotime, Shanghai, China).
Genomic DNA Extraction and Bisulfite Modification
Genomic DNA was extracted from tumor tissues, adjacent nontumor tissues, and GC cell lines using a standard phenol–chloroform extraction procedure. DNA was quantified using a NanoDrop 2000 spectrophotometer (Thermo Fisher Scientific, Waltham, Massachusetts). Genomic DNA of 1 µg was bisulfite modified using an EpiTect Fast DNA Bisulfite Kit (Qiagen, Limburg, Netherlands), according to the manufacturer’s instructions, to convert all unmethylated cytosines to uracil while leaving methylcytosines unaltered. Bisulfite-modified DNA was eluted twice with 20 μL elution buffer and stored at −20°C.
Methylation Analysis of TFAP2E and Primer Design
Methylation-sensitive high-resolution melting analysis (MS-HRM) was performed on a LightCycler 480 (Roche, Basel, Switzerland) with precision melt analysis software to analyze the methylation status of TFAP2E in tissues and cell lines. EpiTect Control DNA, unmethylated (human; Qiagen) and EpiTect Control DNA, methylated (human; Qiagen) were used as 0% and 100% control DNA, respectively. Methylation standards were constructed by diluting 100% methylated DNA in a pool of unmethylated control DNA at levels of 100%, 75%, 50%, 25%, 10%, 1%, and 0%. Primers (Invitrogen; Life Technologies) for TFAP2E for MS-HRM were as follows: forward, 5′-GTTTTATTTTAGAAGCGGTTTT-3′ and reverse, 5′-CGAACGCTTACCTACAATCA-3′. The amplicon was located at the second CpG island of the TFAP2E gene in intron 3, as previously reported. 11,14 The polymerase chain reaction (PCR) mixture was prepared in a final volume of 20 μL and contained 10 μL LightCycler 480HRM Master Mix (Roche), 2 μL of 25 mmol/L MgCl2, 10 μmol/L of each primer, 50 ng bisulfite-modified DNA template, and ribonuclease-free ddH2O. The LightCycler 480 cycling protocol for MS-HRM analysis was initial denaturation at 95°C for 10 minutes followed by 50 cycles at 94°C for 10 seconds, annealing temperature for 15 seconds, and extension at 72°C for 10 seconds, followed by an MS-HRM step of 95°C for 1 minute, 40°C for 1 minute, and continuous acquisition between 65°C and 97°C at 1 acquisition per 0.2°C. Standard curves with known methylation ratios were included in each assay, and they were used to deduce the methylation ratio of each tissue and cell line. All samples in this study were tested in duplicate.
Western Blot Analysis
Cells were washed with phosphate-buffered saline and lysed in RIPA lysis buffer containing phenylmethylsulfonyl fluoride (Beyotime). A bicinchoninic acid Protein Assay Kit (Beyotime) was used to quantify protein amounts. A total of 40 μg of protein was mixed with sodium dodecyl sulfate (SDS) polyacrylamide gel electrophoresis sample loading buffer, boiled at 100°C for 5 minutes, and then loaded onto 12% polyacrylamide gels. Samples were then subjected to SDS electrophoresis at 150 V for 2 hours. Proteins were transferred to polyvinylidene fluoride membranes (Millipore, Billerica, Massachusetts) by electroblotting at a current of 250 mA for 40 minutes. The membranes were then blocked with 5% nonfat milk in Tris-buffered saline with Tween (TBST: 10 mmol/L Tris-HCl, 150 mmol/L NaCl, 0.25% Tween 20, pH 7.5) for 4 hours then incubated overnight with rabbit polyclonal anti-TFAP2E antibody (Abcam, Cambridge, England; at a concentration of 1.25 µg/mL in 5% skim milk, 1:800 dilution) and rabbit monoclonal anti-dickkopf homolog 4 (DKK4) antibody (Abcam, Shanghai, China; diluted with 5% skim milk at 1:1000). After washing in TBST 3 times for 30 minutes in total, the membranes were incubated with secondary antirabbit antibody (Santa Cruz, Dallas, Texas; 1:15 000 dilution) for 1 hour at room temperature and then washed as described previously. Anti-ACTB (ActinBeta) antibody (β-actin; Santa Cruz; 1:1500 dilution) was used to evaluate equal protein loading. Proteins were visualized using an enhanced chemiluminescence kit, and images were analyzed using a Bio-Rad gel imaging system (Bio-Rad, Hercules, California).
RNA Isolation and Real-time Fluorescent Quantitative PCR Analysis
Total RNA was extracted from GC cell lines and tissues from 43 patients with available clinical response data, and RNA was reverse transcribed into complementary DNA (cDNA) using a reverse transcription kit (Invitrogen; Life Technologies) following the manufacturer’s instructions. Expression of TFAP2E in cell lines and tissues and expression of excision repair cross-complementation group 1 (ERCC1) and thymidylate synthase (TS) in tissues were assessed by real-time fluorescent quantitative PCR by mixing cDNA with SYBR Green Supermix (Bio-Rad), ribonuclease-free water, and primers for TFAP2E (Sangon, Shanghai, China), ERCC1, and TS (Invitrogen, Life Technologies). The reaction for TFAP2E was carried out under the following conditions: 1 cycle of 95°C for 15 minutes and 40 cycles of 95°C for 10 seconds, followed by 60°C for 32 seconds. For ERCC1 and TS, the reaction conditions were as follows: 1 cycle of 94°C for 30 seconds and 40 cycles of 94°C for 30 seconds, followed by 60°C for 80 seconds. Each experiment was performed in duplicate, and the results were standardized to glyceraldehyde 3-phosphate dehydrogenase (GAPDH). Data were expressed as the fold change relative to the control. Primer sequences were designed with Primer Premier 5.0 software (Premier Biosoft, Palo Alto, California). The primers used in this study were TFAP2E, 5′-CAGAGAGAAGTGGGCAGGAG-3′ (forward) and 5′-AGGACAGACAGCAACAGGACT-3′ (reverse); ERCC1, 5′-GGGAATTTGGCGACGTAATTC-3′ (forward) and 5′-GCGGAGGCTGAGGAACAG-3′ (reverse); TS, 5′-GCCTCGGTGTGCCTTTCA-3′ (forward) and 5′-CGTGATGTGCGCAATCATG-3′ (reverse); and GAPDH, 5′-CGGAGTCAACGGATTTGGTCGTAT-3′ (forward) and 5′-AGCCTTCTCCATGGTGGTGAAGAC-3′ (reverse).
Cell Survival Assays After 5-FU Exposure
The GC cell lines were divided into 3 groups based on 3 different concentrations of 5-aza-2-deoxycytidine (0, 5, and 10 μmol/L). After 3 days of exposure to 5-aza-2-deoxycytidine, all groups were seeded into 96-well plates (8000 cells per well). After 48 hours of treatment with distinct concentrations of 5-FU (0, 10, 20, 40, 80, 160, and 320 μg/mL; Sigma), cell proliferation was measured using Cell Counting Kit-8 (CCK8) assays (Dojindo, Kumamoto, Japan) according to the manufacturer’s protocol. Absorbance values were determined at 450 nm by a microplate reader (Thermo Scientific, Waltham, Massachusetts).
Statistical Analysis
To determine the optimal cutoff value for the percentage of TFAP2E methylation and to distinguish between TFAP2E hypermethylation and hypomethylation in samples, we applied receiver–operating characteristic (ROC) curve analysis using Medcalc statistical software (Ostend, Belgium). As a result, values above 35% were considered to indicate hypermethylation, while values below 35% indicated hypomethylation. Chi-square (χ2) tests were used to analyze the correlation between TFAP2E methylation status and GC clinicopathological parameters. Correlations between response to treatment and TFAP2E methylation level or other clinicopathological factors were evaluated using χ2 tests. Binary logistic regression and partial correlation were used to estimate the probability of TFAP2E hypermethylation at the value of the independent variable in patients with fluorouracil resistance. Differences in TFAP2E methylation levels and TFAP2E, ERCC1, and TS expression levels were evaluated with regard to responsiveness using Mann-Whitney U tests. For in vitro studies, differences in protein expression and cell survival rates between the control group and the 5-aza-2-deoxycytidine intervention group were compared using Dunnett test. GraphPad Prism software (California, USA) was used for artwork creating SPSS 19.0 statistical software (IBM Corp, Armonk, New York) was used for data analysis. All tests were 2-sided, and P values <.05 were considered statistically significant.
Results
The Frequency of TFAP2E Methylation in Tumor and Adjacent Nontumor Tissues
Genomic DNA from 141 primary tumor tissues and 45 adjacent nontumor tissues from patients with GC was analyzed for TFAP2E methylation using MS-HRM. The incidence rates of TFAP2E methylation in tumors and adjacent nontumor tissues were 99.3% (140 of 141 samples) and 71.1% (32 of 45 samples), respectively. The incidence rate of TFAP2E methylation was significantly higher in tumor tissues compared to adjacent nontumor tissues (χ 2 = 38.919, P < .001).
Percentage of methylation (PM) value was calculated according to a previously described formula. 14 In this study, we used ROC curve analysis to determine the optimal cutoff value of PM to distinguish between TFAP2E hypermethylation and hypomethylation in tumor tissues. The area under the curve was 0.817, and the Youden index was 35.29% (Figure 1). Therefore, methylation levels of at least 35% were considered to indicate hypermethylation, whereas levels below 35% were classified as hypomethylation. In primary tumor tissues, DNA from 102 of the 141 (72.34%) patients with GC was classified as hypermethylated, while DNA from 39 (27.66%) of the 141 patients was hypomethylated. In 45 adjacent nontumor tissues, the methylation level of 21 cases was below 35%, while 24 cases were hypermethylated.

Receiver–operating characteristic (ROC) curve analysis of percentage of methylation (PM) values for transcription factor activating enhancer binding protein 2 epsilon (TFAP2E) from 45 patient-matched gastric cancer tissues and adjacent nontumor tissues. The area under the ROC curve was 0.817 (95% confidence interval, 0.731-0.904). The optimal PM cutoff value was 35.29% according to the Youden index.
The Relationship Between TFAP2E Methylation Status and GC Clinicopathological Characteristics
We analyzed the methylation status of TFAP2E in 141 samples. The samples came from 80 males and 61 females, with a median age of 59 years (range, 30-82 years). Commonly noted clinicopathological characteristics of patients with GC include age, gender, primary tumor site, lymphatic metastasis, depth of invasion, degree of differentiation, clinical stage, and distant metastasis. Hypermethylation of TFAP2E occurred more frequently in tumors with lower grades of differentiation (P = .000), none of other parameters correlated with TFAP2E methylation status (Table 1).
Clinicopathological Parameters of Patients With Gastric Cancer and Their Correlation With TFAP2E Methylation Status in Tumor Tissues.

Abbreviations: TFAP2E, transcription factor activating enhancer binding protein 2 epsilon; TNM, tumor-node-metastasis.
aG1, poorly differentiated, G2, moderately differentiated, and G3, well or highly differentiated.
Hypermethylation of TFAP2E and Chemotherapy Resistance
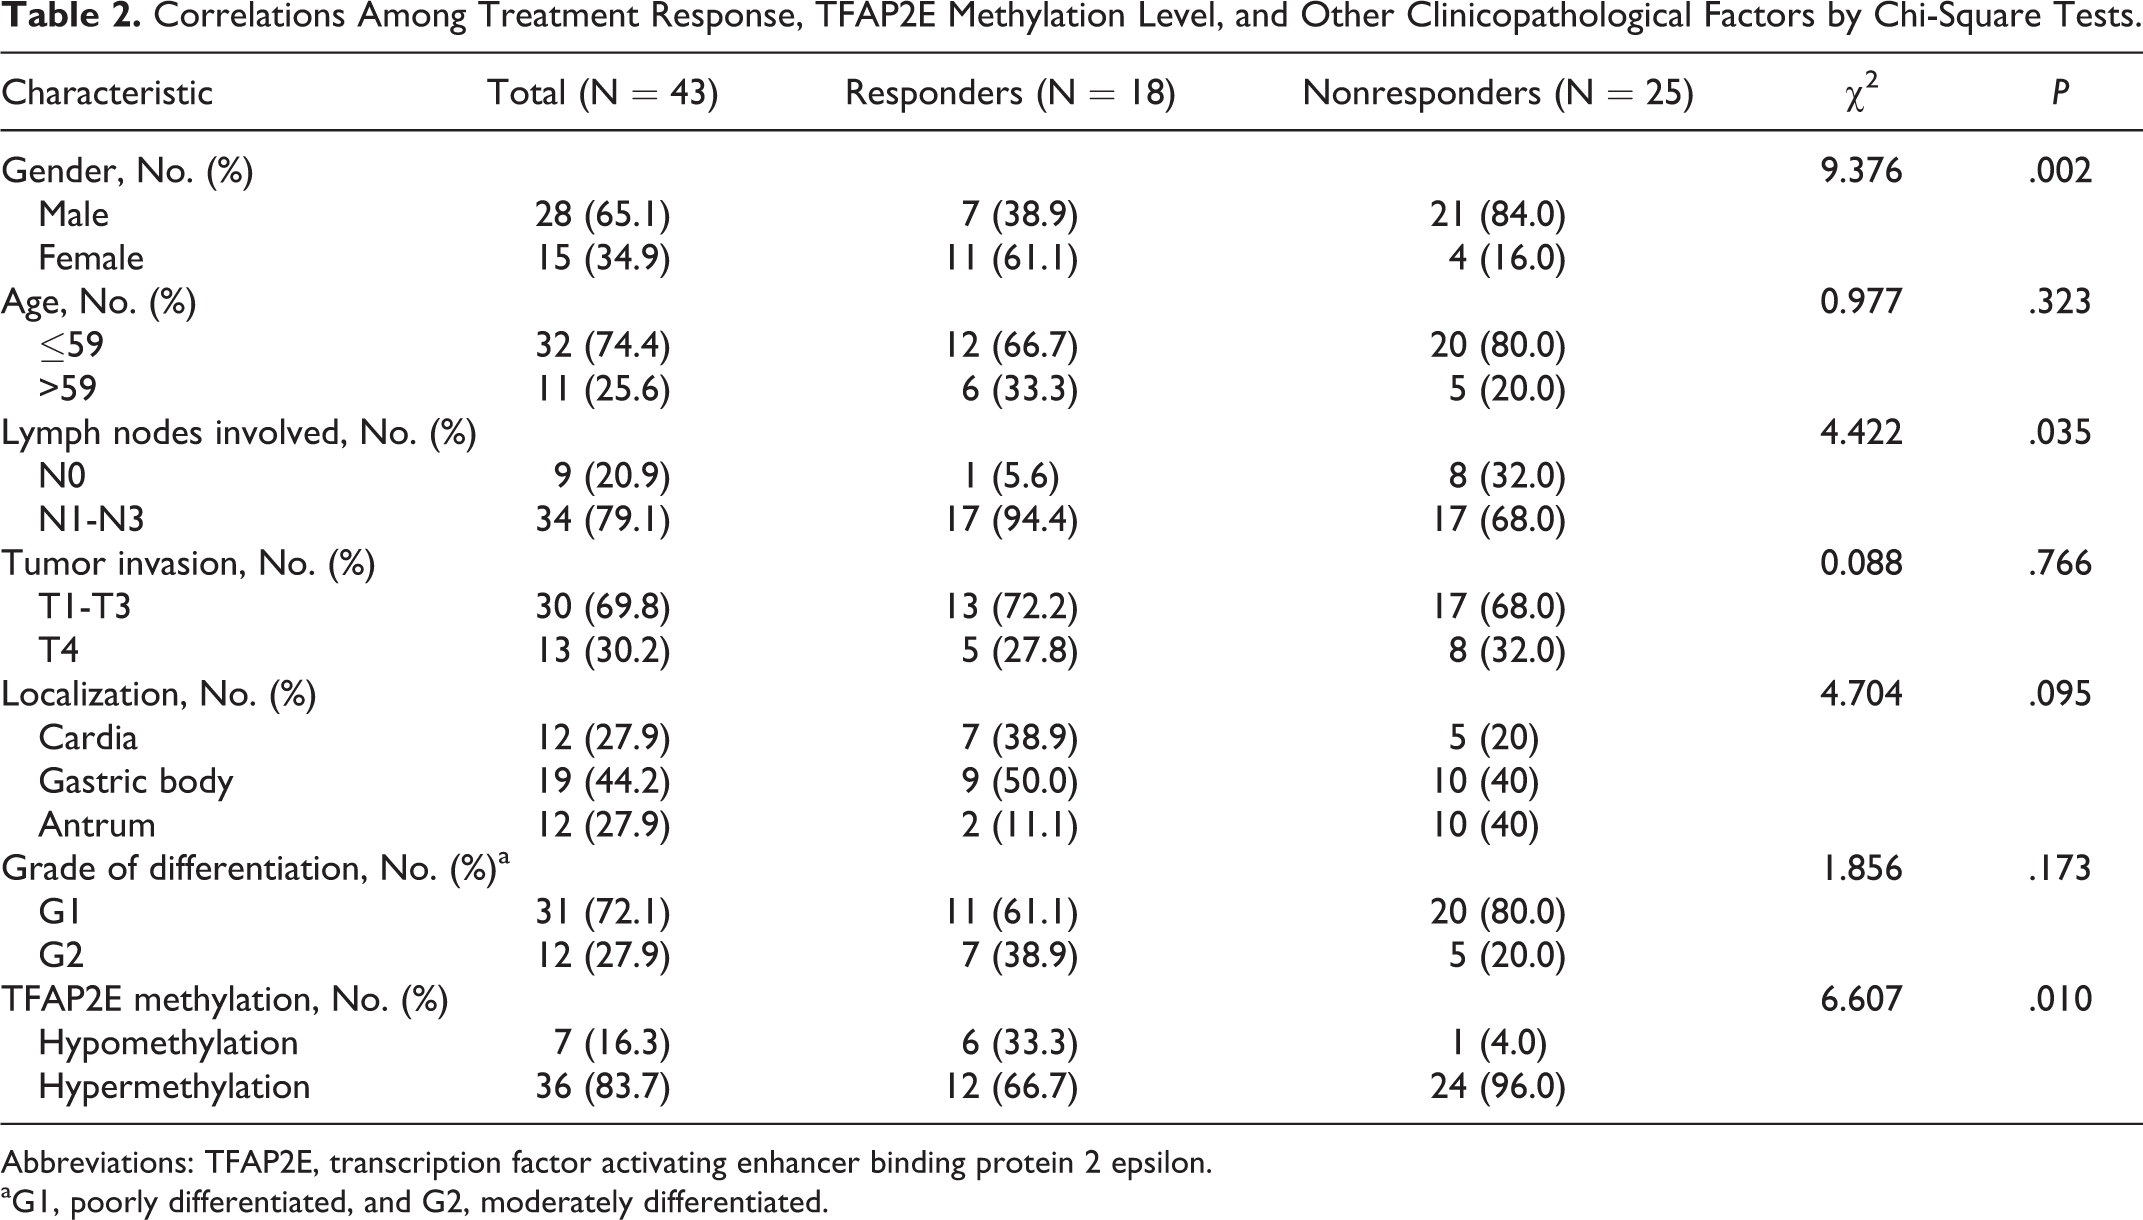
Among the 141 patients with primary GC in this study, 43 cases were unresectable and treated with fluorouracil-based chemotherapy for stage IV diseases, and there was no neoadjuvant chemotherapy given during palliative treatment. The chemotherapy regimens for this subset of patients were as follows: 5-FU plus oxaliplatin; 5-FU plus cisplatin; Xeloda plus cisplatin; 5-FU, oxaliplatin, and docetaxel; and tegafar, oxaliplatin, and docetaxel. Tumor responses were assessed using RECIST according to measurable lesions. The overall treatment response for each patient at a certain time point (2 cycles) depended on the findings of both target and nontarget lesions and also included the occurrence of any new lesions. We considered patients with stable disease and progressive disease to be nonresponsive to therapy, while patients with partial responses and complete responses were considered responsive to therapy. We studied correlations between treatment response, TFAP2E methylation level, and other clinicopathological factors (Table 2). We found that gender, lymph nodes involved, and TFAP2E methylation level correlated with treatment response (χ2 = 9.376, 4.422, and 6.607; P = .002, .035, and .010, respectively). Next, we used binary logistic regression (Table 3) and partial correlation analysis to determine the independent effect of TFAP2E methylation on treatment response. The results suggested that lymph nodes involved was not significant and to be excluded in the analysis, and TFAP2E hypermethylation was significantly associated with lack of response to fluorouracil-based treatment after controlling for gender (r = .405, P = .008).
Correlations Among Treatment Response, TFAP2E Methylation Level, and Other Clinicopathological Factors by Chi-Square Tests.
Abbreviations: TFAP2E, transcription factor activating enhancer binding protein 2 epsilon.
aG1, poorly differentiated, and G2, moderately differentiated.
Binary Logistic Regression Analysis for Determining the Independent Effect of TFAP2E Methylation on Treatment Response.

Abbreviations: B, coefficient; SE, standard error; OR, odds ratio; CI, confidence interval; TFAP2E, transcription factor activating enhancer binding protein 2 epsilon.
TFAP2E Methylation Level and Other Potential Molecular Predictors of GC Response
Fluoropyrimidines, oxaliplatin, and cisplatin were major chemotherapeutic agents used to treat patients with GC enrolled in this study. The ERCC1 is a key enzyme in the nucleotide excision repair pathway, and its expression is reportedly a useful predictor of clinical outcomes of advanced patients with GC treated with platinum-based chemotherapy. 15 –17 Alternatively, TS is the target enzyme of 5-FU, and several investigators have reported the clinical relevance of high TS expression as a predictor of resistance to 5-FU-based chemotherapy. 18 –23 In this study, expression of TFAP2E, ERCC1, and TS messenger RNA (mRNA) was assessed in 43 GC tissues by real-time fluorescent quantitative PCR. There were no differences in the mRNA expression levels of ERCC1 or TS between responders and nonresponders; however, TFAP2E mRNA expression levels were significantly lower and methylation levels were significantly higher in nonresponders compared to responders (P = .000, P = .005), providing more evidence that TFAP2E hypermethylation correlates with nonresponse to treatment (Table 4).
ERCC1 mRNA Expression, TS mRNA Expression, TFAP2E mRNA Expression, and TFAP2E Methylation in 43 Patients With GC Having Available Clinical Response Data.

Abbreviations: ERCC1, excision repair cross-complementation group 1; TFAP2E, transcription factor activating enhancer binding protein 2 epsilon; TS, thymidylate synthase; mRNA, messenger RNA; m, mean; s, standard deviation.
aBased on Mann-Whitney U test.
The Effect of 5-aza-2-deoxycytidine on TFAP2E Expression and Sensitivity to 5-FU In Vitro
The GC cell lines MGC803, SGC7901, and BGC823 were treated with different concentrations of 5-aza-2-deoxycytidine. Western blot analysis and quantitative PCR were used to detect TFAP2E protein (Figure 2A) and mRNA expression levels (Figure 3), respectively. The results showed that 5-aza-2-deoxycytidine significantly increased TFAP2E protein expression (P < .01; Figure 2B) and mRNA expression (P < .05; Figure 3) in MGC803, SGC7901, and BGC823 cells. The MS-HRM experiments showed that 5-aza-2-deoxycytidine reduced the methylation level of TFAP2E in 3 different cell lines in a dose-dependent manner (Figure 4). Taken together, these results demonstrated that 5-aza-2-deoxycytidine decreased TFAP2E methylation levels, but increased TFAP2E protein and mRNA expression in GC cells. Additionally, we also studied the expression of the gene encoding DKK4 protein (Figure 2A), which has been reported as the downstream protein of TFAP2E, the outcome suggested that there were no differences in distinct concentrations of 5-aza-2-deoxycytidine groups (Figure 2C).

Effects of different concentrations of 5-aza-2-deoxycytidine on transcription factor activating enhancer-binding protein 2 epsilon (TFAP2E) expression and gene encoding dickkopf homolog 4 (DKK4) protein expression in MGC803, BGC823, and SGC7901 cells. A, Representative immunoblotting result. Western blot analysis was performed using antibodies against TFAP2E, DKK4, and β-actin. B, Quantification of protein expression levels of TFAP2E. C, Quantification of protein expression levels of DKK4. Values are given as the mean ± standard deviation (SD) of 3 independent experiments. *P < .01, relative protein level of the 5 μmol/L group compared to the 0 μmol/L group. #P < .01, relative protein level of the 10 μmol/L group compared to the 0 μmol/L group.

Effects of different concentrations of 5-aza-2-deoxycytidine on transcription factor activating enhancer binding protein 2 epsilon (TFAP2E) mRNA expression by real-time fluorescence quantitative polymerase chain reaction (PCR) analysis in MGC803, BGC823, and SGC7901 cells. Values are given as the mean ± standard deviation (SD) of 3 independent experiments. *P < .05, relative mRNA level of the 5 μmol/L group compared to the 0 μmol/L group. #P < .05, relative mRNA level of the 10 μmol/L group compared to the 0 μmol/L group.

Methylation-sensitive high-resolution melting (MS-HRM) analysis for transcription factor activating enhancer-binding protein 2 epsilon (TFAP2E) methylation after treatment with different concentrations of 5-aza-2-deoxycytidine. A, The MS-HRM standard curve for TFAP2E in gastric cancer cell lines. The arrows indicate distinct levels of methylation. B, The TFAP2E methylation level was nearly 100% in MGC803; after treatment with 5-aza-2-deoxycytidine, the methylation level declined in a dose-dependent manner. C, The TFAP2E methylation level was between 75% and 100% in BGC823; 5-aza-2-deoxycytidine treatment caused slight dose-dependent decreases in methylation. D, The TFAP2E methylation level was in the middle of the range between 75% and 100% in SGC7901; 5-aza-2-deoxycytidine treatment decreased the methylation level in a dose-dependent manner.
After 3 days of treatment with different concentrations of 5-aza-2-deoxycytidine, cells were treated with distinct concentrations of 5-FU for 48 hours in 96-well plates. The CCK8 assays suggested that treatment with 5-FU resulted in a significant decrease in cell viability in the 3 cell lines (P < .001). In addition, at equal concentrations of 5-FU, higher doses of 5-aza-2-deoxycytidine led to lower cell viability (Figure 5). These results indicated that, as a demethylation agent, 5-aza-2-deoxycytidine might enhance sensitivity to 5-FU compared to cells without 5-aza-2-deoxycytidine treated (Table 5).

Gastric cancer cell lines (MGC803, BGC823, and SGC7901) were incubated with 0, 5, or 10 μmol/L 5-aza-2-deoxycytidine for 3 days. After 5-aza-2-deoxycytidine treatment, cells were seeded into 96-well plates (8000 cells per well). Then after 24 hours, all cells were incubated with various concentrations of 5-fluorourail for 48 hours, and cell viability was measured using Cell Counting Kit-8 assays. 5-Fluorouracil resulted in a significant decrease in cell viability in the 3 cell lines, and at equal concentrations of 5-fluorouracil, higher doses of 5-aza-2-deoxycytidine led to lower cell viability. A, Cell viability of MGC803. B, Cell viability of BGC823. C, Cell viability of SGC7901.
The Results of Cell Count Kit-8 Assays by Dunnett Test.

Abbreviations: 5-FU, 5-fluorouracil; MD, mean difference.
aCell viability after treatment with 5 μmol/L 5-aza-2-deoxycytidine compared to the 0 μmol/L group.
bCell viability after treatment with 10 μmol/L 5-aza-2-deoxycytidine compared to the 0 μmol/L group.
Discussion
Epigenetic alteration in genomic DNA plays a crucial role in cancer initiation and development, 24 especially aberrant DNA methylation at CpG islands. It has been reported that DNA methyltransferases, the enzymes that catalyze DNA methylation, are highly expressed in cancer tissues. 25 Moreover, DNA methylation is considered a main cause of AP2 protein malfunction. 14 The AP2 family of transcription factors plays an important role in the regulation of many aspects of development and has been implicated in cancer progression. In humans, the family consists of 5 members: TFAP2A, TFAP2B, TFAP2C, TFAP2D, and TFAP2E; these genes encode TFAP2α, TFAP2β, TFAP2γ, TFAP2δ, and TFAP2∊ proteins, respectively. The family members share a conserved C-terminal basic helix-span-helix DNA binding and dimerization domain and a less conserved N-terminal proline- and aromatic-rich activation domain. 26 –29 TFAP2A was identified due to its ability to bind to the SV40 and human metallothionein IIa gene promoters. 30 Then, a second homologous gene, TFAP2B, was cloned in 1995. 31 Subsequently, TFAP2C, TFAP2D, and TFAP2E were detected, enlarging the TFAP2 family. 32 –35 Expression of TFAP2 proteins has been reported in several tissues. For instance, TFAP2A has been shown to be hypermethylated in patients with renal cell carcinoma 36 and breast cancer. 37 TFAP2C acts as a tumor suppressor in breast cancer 38 and may predict tamoxifen resistance. 39 Downregulation of TFAP2A and TFAP2C expression was shown to enhance cell growth and induce invasion and resistance to anticancer drugs. 40 TFAP2D and TFAP2E have been shown to be hypermethylated in prostate and colorectal cancer. 13 The expression of TFAP2E has been reported in neural tissue, particularly the adult midbrain and the olfactory bulbs, during mouse embryogenesis. 41 Hypermethylation of TFAP2E was also observed in mouse skin cancer and was found to correlate with downregulated protein expression. 42 Nonetheless, the role of TFAP2E methylation in patients with GC is still unknown.
In this study, we found that the incidence rate of TFAP2E methylation was significantly higher in tumor tissues compared to adjacent nontumor tissues. The finding indicates that methylation of TFAP2E may be a risk factor in the occurrence of GC. Hypermethylation of TFAP2E occurred more frequently in tumors with lower grades of differentiation, which has not been previously described in GC. However, another study 14 reported that TFAP2E hypermethylation was associated with earlier stage, lower level of tumor invasion, fewer lymph nodes involved, and higher histologic grade in patients with colorectal cancer. Based on the different outcomes between these 2 studies, we deem that TFAP2E methylation status is variable in different kinds of tumor tissues. This study did have limitations, including a small number of patients and limited availability of clinicopathological factors; therefore, further investigation will be necessary to understand the exact relationship between TFAP2E methylation status and GC clinicopathological characteristics.
We observed that TFAP2E was frequently hypermethylated in 3 different GC cell lines that had low TFAP2E mRNA and protein expression. When these cells were treated with different concentrations of 5-aza-2-deoxycytidine, TFAP2E methylation levels declined significantly, but the expression levels of mRNA and protein increased significantly. The inverse relationship observed in our study was in agreement with previous research. 11,42 We were not able to analyze TFAP2E protein expression levels in tissues because there is no specific antibody for immunohistochemistry.
We further analyzed correlations between TFAP2E methylation levels and response to treatment. In vivo, we found that TFAP2E hypermethylation was associated with lack of response to chemotherapy. This result was entirely consistent with a previous report. 11 Fluoropyrimidines, oxaliplatin, and cisplatin were major chemotherapeutic agents used to treat the 43 patients with GC analyzed, so we also investigated ERCC1 and TS mRNA levels. There were no differences in mRNA expression of ERCC1 or TS between responders and nonresponders. However, TFAP2E methylation levels were significantly higher in nonresponders compared to responders. For in vitro analysis, our results suggest that, as a demethylating agent, 5-aza-2-deoxycytidine may enhance sensitivity to 5-FU compared to non-5-aza-2-deoxycytidine groups. Nevertheless, without 5-aza-2-deoxycytidine treatment, all cells were hypermethylated and were relatively resistant to 5-FU. These outcomes support the findings from our in vivo experiments.
It has been reported that TFAP2E-dependent resistance is mediated through DKK4 in colorectal cancer, we attempted to find the pathway in GC, so we analyzed the expression of DKK4 in GC cell lines with or without 5-aza-2-deoxycytidine intervened, the results showed no statistical differences. We considered that TFAP2E-associated chemoresistance might be mediated by other molecule in GC and needed more research.
In summary, patients with GC having TFAP2E hypermethylation were resistant to fluorouracil-based chemotherapy. Hypermethylation of TFAP2E-predicted chemosensitivity, which could guide the development of personalized treatment options for patients with GC.
There were some limitations to the current study. The molecular mechanisms remain unknown and need to be observed in future studies. We did not list all of the clinicopathological characteristics of the patients with GC. In addition, because of the limited number of cases, only low grade of differentiation was found to be associated with TFAP2E hypermethylation. Therefore, more clinicopathological factors need to be studied. Additionally, the role of TFAP2E in survival and prognosis was not determined.
Footnotes
Acknowledgments
We sincerely thank all participating patients and their families, the study investigators, study monitors, and all other members of the study team for their help and care.
Authors’ Note
The effect that all human studies have been approved by the Research Ethics Committee of Nanjing Medical University and have been performed in accordance with the Declaration of Helsinki and its later amendments.
Declaration of Conflicting Interests
The author(s) declared no potential conflicts of interest with respect to the research, authorship, and/or publication of this article.
Funding
The author(s) disclosed receipt of the following financial support for the research, authorship, and/or publication of this article: This study was supported by grants from the National Natural Science Foundation of China (grant number: 81302490), grants from the Jiangsu Province Health Department for medicine, science, and technology development (grant number: H201358), and Science and Technology support project of Huai’an (grant number: HAS2012003).