
Abstract
The worldwide high mortality rate of lung cancer could be reduced significantly by its noninvasive early detection. The quantitative analysis of cell-free circulating DNA in plasma presents a potential noninvasive approach for liquid biopsy of tumor. In this study, real-time polymerase chain reaction–based approach was used to quantify free circulating DNA in plasma. The concentration of free circulating DNA was checked using human telomerase reverse transcriptase gene as marker, and amplification status of oncogene RAC-β serine/threonine protein kinase along with the DNA methylation status of tumor suppressor gene (deleted in colorectal cancer) was assessed. The concentration of free circulating DNA in patients with lung cancer (22.8 ng/mL) was found approximately 6 times above than the value detected in controls (2.8 ng/mL). Considerable variation in the AKT2 copy number was observed in patients with lung cancer and controls (P < .000). Aberrant methylation of the deleted in colorectal cancer promoter was found to be highly specific (100%), as none of the control plasma samples showed aberrant methylation. The quantification of free circulating DNA along with determination of AKT2 amplification and deleted in colorectal cancer promoter methylation status appeared promising to differentiate patients with lung cancer from healthy individuals.
Introduction
Lung cancer is the deadliest of all cancers having highest mortality and incidence rates worldwide. About 25% of the entire cancer-associated deaths are caused by lung cancer, and approximately 1.2 million new lung cancer cases are reported annually, worldwide. 1,2 In Pakistan, the situation is not very different from the world; lung-cancer is a major cancer type in men. Its prevalence rate is 20.3 per million in men and 2.9 per million in women. 3
Unfortunately, greater than 60% of lung cancer-cases are diagnosed at advanced stages after tumors have metastasized, when cure is unlikely. 4,5 Current screening tests available for early diagnosis of lung cancer include sputum cytology test, chest X-ray, and computed tomography (CT) scans, which are not much efficient for earlier diagnosis and increased survival rate. 6,7 These techniques have pitfalls such as high cost, hazardous effects of radiation exposure, reduced sensitivity especially in the case of former smokers, and poor specificity. 8,9
Lung cancer diagnosis has entered into a new era with the finding that tumors also secrete their nucleic acid content, that is, DNA and RNA into circulation. 10 The actual mechanism of free circulating DNA (fcDNA) release is not completely clear, but mostly it is associated with apoptosis of circulating tumor cells leading to the release of nucleic acids into the circulation. 11,12 These circulating nucleic acids can be retrieved from plasma and serum. 10 Therefore, quantifying fcDNA and molecular characterization of early genetic and epigenetic changes would be a valuable tool in screening and managing lung cancer.
For determination of elevated plasma fcDNA levels in patients with lung cancer, different approaches have been applied, and the real-time polymerase chain reaction (PCR)–based assay with a reference gene has been proved to be the most sensitive one. 13 –16 Typical tumor genetic changes, such as mutations, inversions, microsatellite alterations and deletions, 17 and epigenetic changes such as aberrant hypermethylation within the regulatory regions of gene, could be conveniently identified in circulating-DNA using PCR-based methods. 18,19
In the present study, we employed real-time PCR-based approach for quantifying fcDNA in plasma based on amplification of single-copy ubiquitous gene, human telomerase reverse transcriptase (hTERT), as an indicator of full amount of circulating fcDNA in plasma. Also the amplification status of oncogene AKT2 and promoter methylation status of tumor suppressor gene (deleted in colorectal cancer [DCC]) in circulating plasma DNA have been determined. Our ultimate objective of this study was to establish a blood-based screening test for lung cancer, applicable in high-risk individuals.
Materials and Methods
Study Population
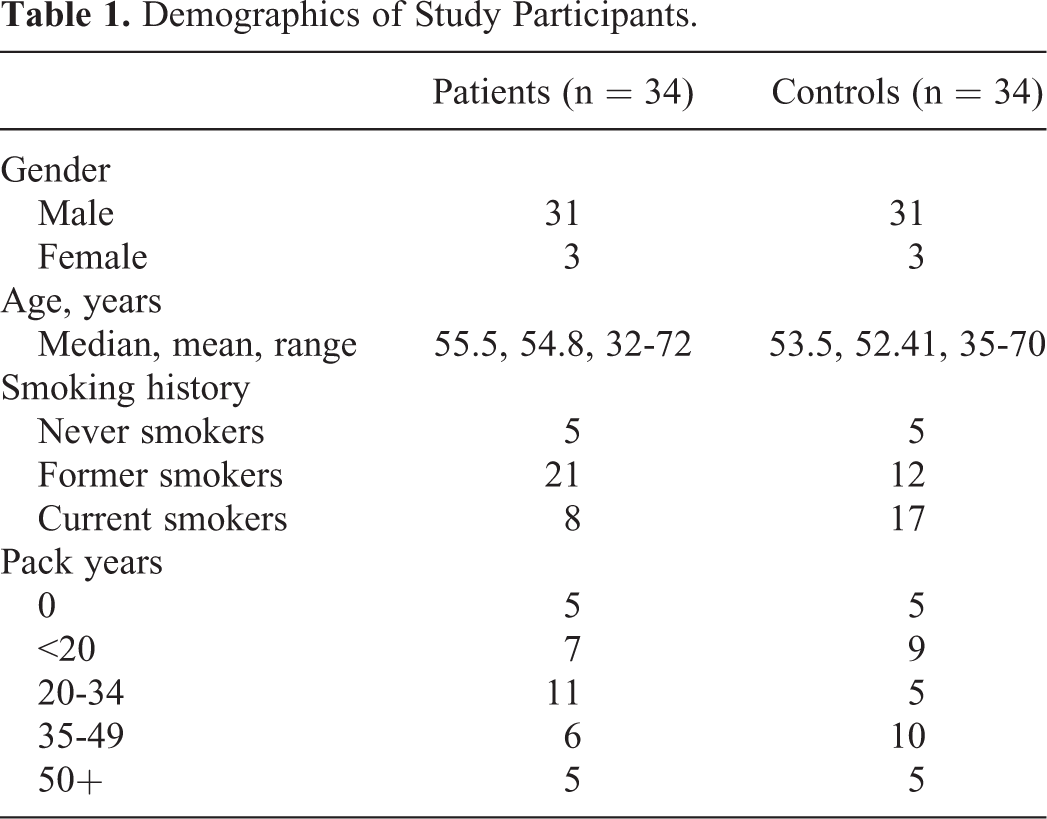
A total of 68 individuals with age ≥30 years were included in this study which comprised of 2 groups, patients with lung cancer and healthy control participants. Complete medical history as well as data regarding age, smoking habits, and histological type of disease were collected. Blood samples of hospitalized patients (n = 34) with non–small cell lung cancer (NSCLC) diagnosed by histopathological technique were collected before the start of anticancer treatment. Cases with primary cancers were only included, while cases with disease relapse or follow-up were excluded from the study population. Healthy controls (n = 34) were selected by sex, age, and smoking habits (like of patients) but without history of any malignant disease. Clinicopathological characteristics of the study-participants are presented in Table 1. Among NSCLC cases, 7 tumors were adenocarcinomas, 19 squamous cell carcinomas (SCCs), and 8 poorly differentiated carcinomas. From each patient and control, 5 mL blood sample was collected in EDTA tubes. Plasma was obtained immediately by centrifugation (2500 rpm, 10 minutes, and 4°C) twice. DNA from plasma was extracted by QIAamp DNA Mini kit (Qiagen, Stockach, Germany), following the manufacturer’s instructions.
Demographics of Study Participants.
Quantification of fcDNA
Quantitative real-time PCR was done for quantifying fcDNA. The assay used the amplification of hTERT gene mapped on 5p15.33 as a marker of total amount of fcDNA. 13 The primers used to amplify the ubiquitous target gene hTERT were already reported by Sozzi and coworkers. 13 Fluorogenic quantitative real-time PCR was performed on CFX96 real-time detection system (Bio-Rad, Hempstead, UK) with a reaction volume of 20 μL. Following conditions were used—initial-denaturation, 95°C for 10 minutes, subsequently 50 cycles of denaturation, 95°C for 15 seconds, annealing and extension at 60°C for 1 minute. All samples were run in duplicates, and water blanks were used as negative-control. To make calibration curve, dilutions (at 10 ng/mL: 1, 0.1, 0.01, 0.001, and 0.0001 ng/mL) of the Control Human Genomic DNA Standard were used. All data were analyzed with CFX Manager Software (Bio-Rad).
Determination of Gene Copy Number
To determine copy number of oncogene AKT2, real-time PCR assay with the β-actin gene (ACTB) as reference was employed. The gene dosage was calculated using 2−ΔΔCT relative-quantification technique. 20 Gene amplification was reported with a 2−ΔΔCT value >2. 21 The primers used to amplify target gene AKT2 and reference gene ACTB were already reported by Alvarez et al. 22 Fluorogenic quantitative-real-time PCR was performed on CFX96 real-time detection system (Bio-Rad) with a reaction volume of 20 μL. Following conditions were used—initial-denaturation, 95°C for 10 minutes, subsequently 50 cycles of denaturation, 95°C for 15 seconds, annealing and extension at 60°C for 1 minute. All samples were run in duplicates, and data were analyzed with CFX Manager Software (Bio-Rad).
Determination of Aberrant Methylation
First, bisulfite modification of plasma fcDNA was performed with EpiTect Bisulfite kit from Qiagen, following the manufacturer’s-instructions. This bisulfite-modified DNA then served as template for fluorescence-based real-time PCR. The primers used for amplification of the bisulfate-modified promoter region of DCC and reference gene, ACTB were already reported by Ostrow et al. 23 Fluorogenic quantitative methylation-specific PCR was performed on CFX96 real-time detection system (Bio-Rad) with a reaction volume of 20 μL. Following conditions were used—initial-denaturation, 95°C for 10 minutes, subsequently 50 cycles of denaturation, 95°C for 15 seconds, annealing and extension at 60°C for 1 minute. All samples were run in duplicates including positive control (in vitro methylated leukocyte DNA) and negative control (normal leukocyte DNA). To generate positive control, a healthy leukocyte DNA was excessively methylated in vitro by M.SssI methyltransferase (Thermo Scientific, MA, USA) to get completely methylated DNA. A calibration curve was made using series of dilution (90 to 0.009 ng) of completely methylated DNA. To determine relative DNA methylation level, ratio of methylation-specific PCR-amplified DCC to ACTB was used (ratio was multiplied by 1000 for easy tabulation). All data were analyzed with CFX Manager Software (Bio-Rad).
Statistical Analysis
For statistical analysis, SPSS Statistics for Windows (version 17.0; SPSS Inc. Chicago, Illinois) was used. The Mann-Whitney U test was applied. A 2-tailed P value < .05 described as statistically significant. The results are represented in the form of box and whisker diagrams. The receiver operating characteristic (ROC) curve and the respective area under the curve (AUC) were used for evaluation of diagnostic performance of each biomarker. The characteristics such as different sensitivity and specificity values with 95% confidence intervals (CIs), positive predictive value, and negative predictive value for each biomarker were estimated, and the Spearman rank correlation (rs ) was used for evaluating correlations.
Results
Quantification of fcDNA
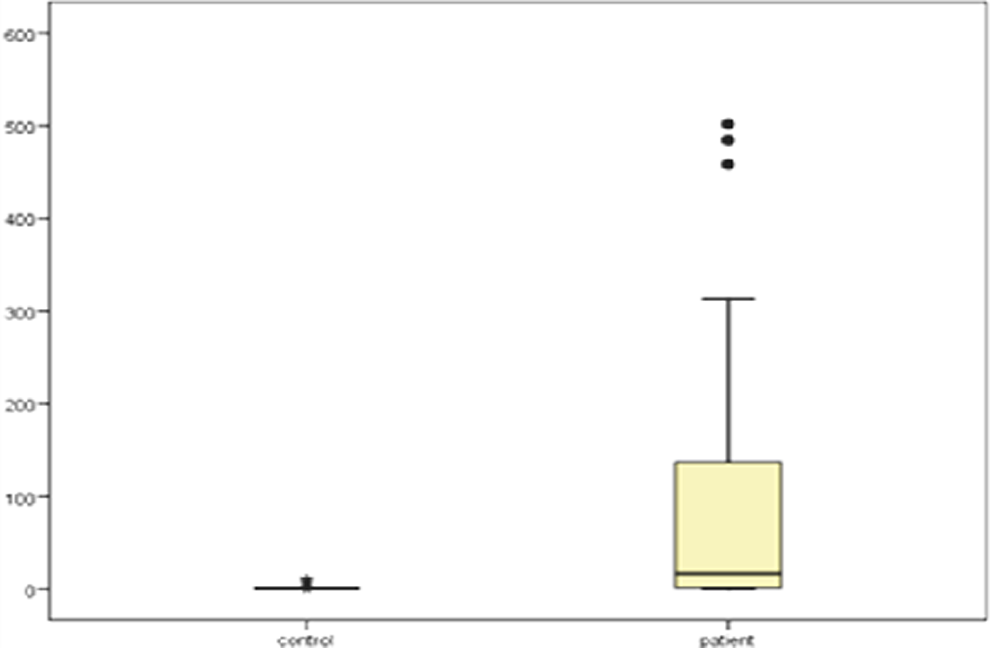
The concentration of plasma fcDNA measured using hTERT as a marker distinguished the 2 groups, patients with lung cancer and matched controls. It is evident by six-fold higher median fcDNA concentration of lung cancer patients (22.8 ng/mL) as compared to controls (2.8 ng/mL), which is statistically significant (P < .000; Figure 1). High concentration values were found in patients; however, only a small number of patients showed low fcDNA concentration values up to 0.5 ng/mL. Patients depicted higher inconsistency in fcDNA concentration than controls (Figure 1).

Box plots of plasma free circulating DNA (fcDNA) concentration (ng/mL) of patients with lung cancer and matched controls, using human telomerase reverse transcriptase (hTERT) as marker.
Diagnostic-performance of this fcDNA concentration assay was determined by ROC curve analysis. The ROC was made by plotting the sensitivity against 1-specificity. The AUC defines the capability of assay to distinguish patients from controls. As the area become close to 1, the diagnostic power increases. The AUC was found to be 0.809 (95% CI: 0.708-0.910; P < .001), which shows strong discrimination power of fcDNA quantification for lung cancer diagnosis (Figure 2).
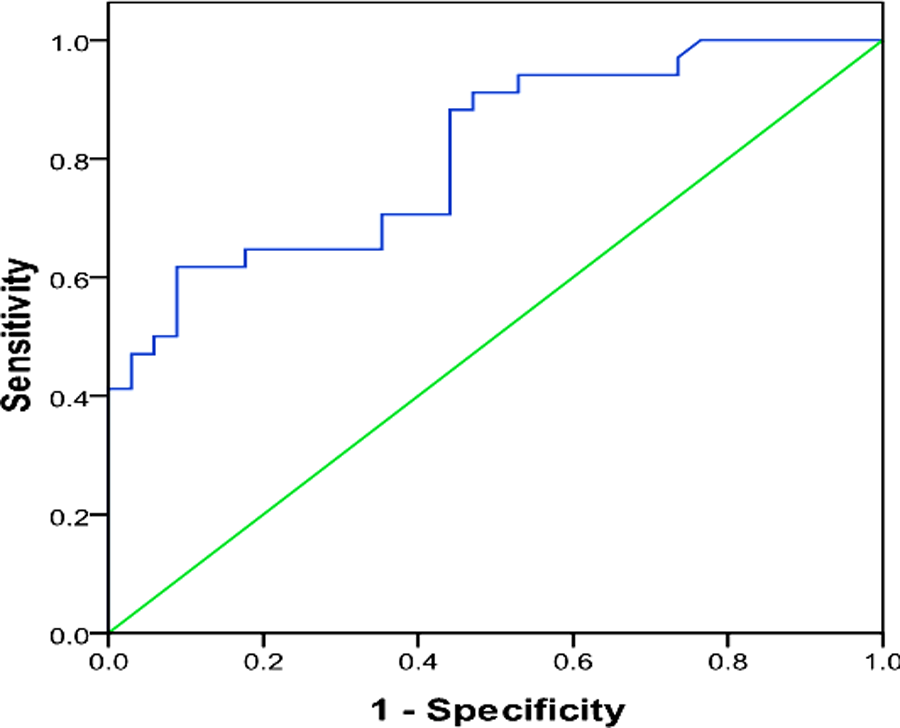
Receiver operating characteristic (ROC) curve for the lung cancer diagnosis by plasma-free circulating DNA (fcDNA) concentration.
It was observed that the assay sensitivity tends to increase with lesser cutoff values, although at expense of assay specificity. It can be a preliminary test to discriminate patients from healthy subjects which requires additional verification. Thus, the sensitivity was preferred to specificity to decrease the possibility of false negatives. So a low cutoff-value 1.9 ng/mL was chosen. It provides a sensitivity of 82.4% in identifying patients with lung cancer. Using this cutoff value, test performance is shown in Table 2.
Diagnostic Performance of fcDNA Quantification Using hTERT, AKT2 Gene Dosage, and DCC Methylation as Biomarker for Lung Cancer.

Abbreviations: DCC, deleted in colorectal cancer; fcDNA, free circulating DNA; hTERT, human telomerase reverse transcriptase; NPV, negative predictive value; PPV, positive predictive value.
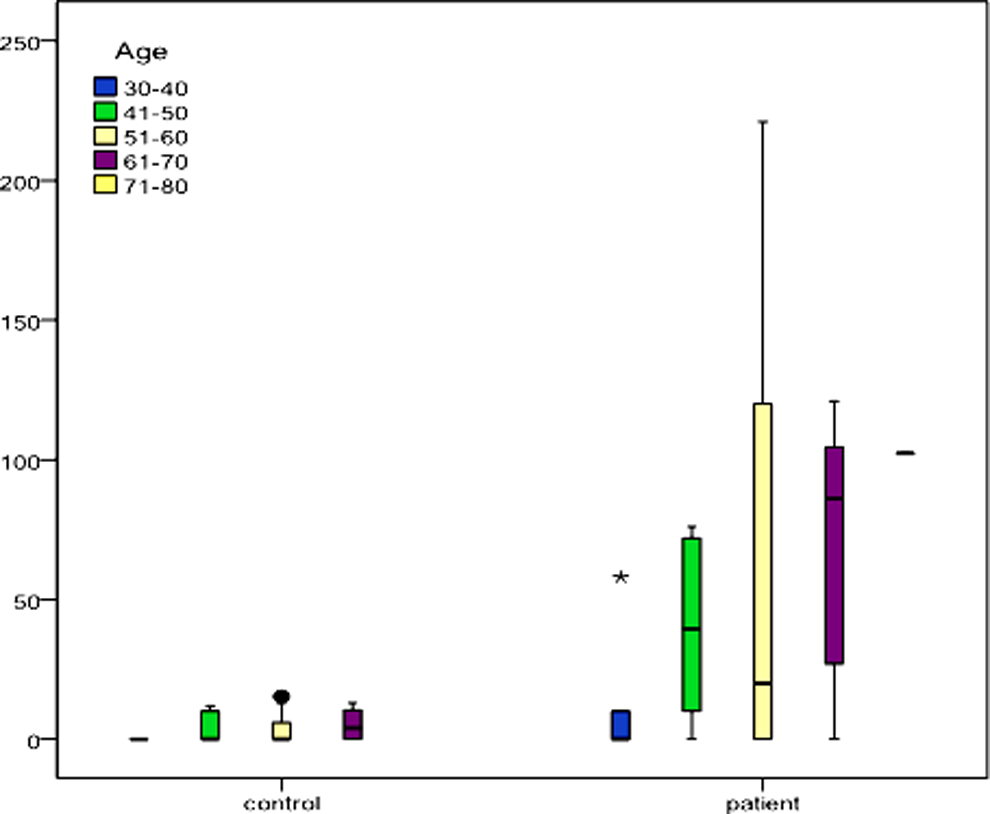
Plasma fcDNA concentration was significantly associated with age (rs = 0.56; P = .000). It increased with increasing age (Figure 3). Significant association of fcDNA levels was also observed with pack years, that is, smoking intensity and duration (rs = 0.50; P = .000). However, no correlation was observed with the gender or histological type of lung cancer.
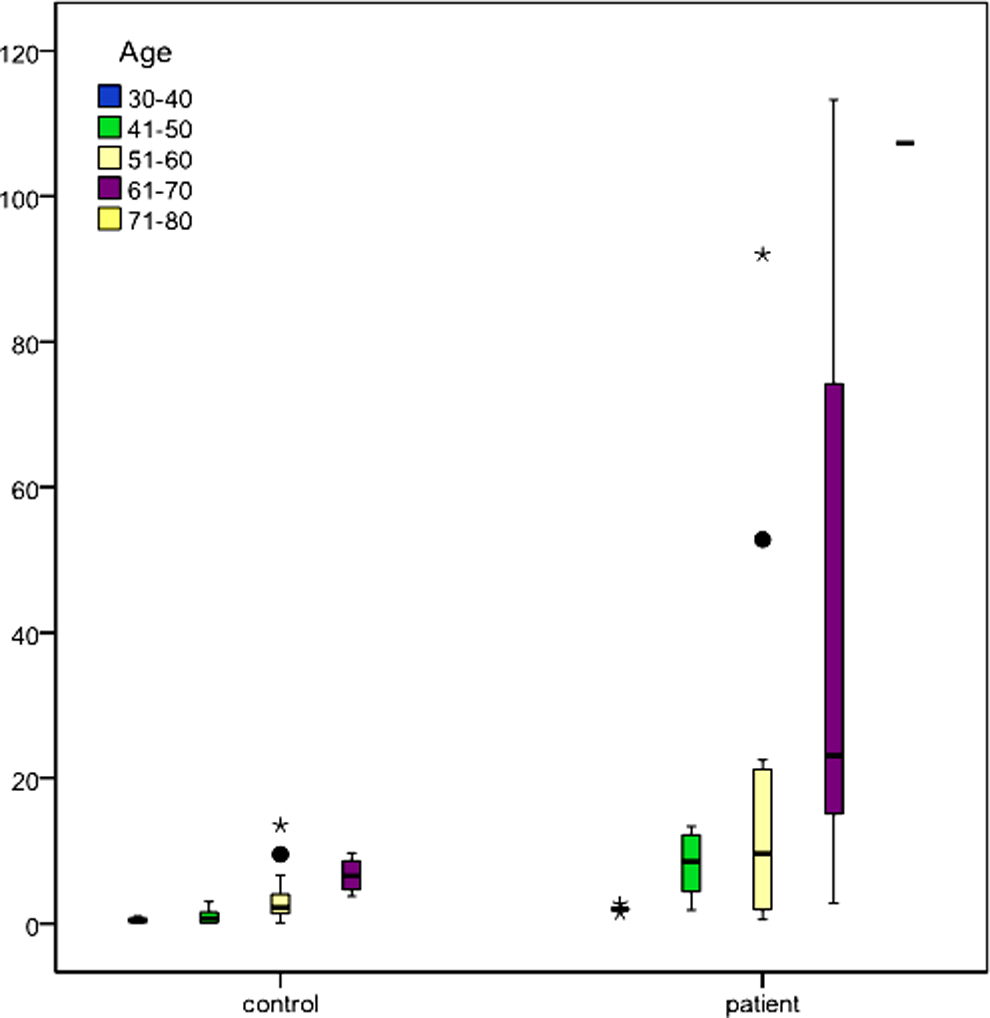
Distribution of free circulating DNA (fcDNA) levels (ng/mL) with respect to age in controls and patients with lung cancer.
Quantification of AKT2 Gene Dosage in fcDNA
Quantification of AKT2 gene dosage in fcDNA was done through real-time PCR-based quantitative assay, using ACTB as reference. The AKT2 gene was found frequently amplified in fcDNA from patients with lung cancer, whereas the amplification frequencies were lower in plasma from controls. Considerable variation in the copy number was observed between patients with lung cancer and controls (P < .000). Only 4 samples of control plasma had a gene amplification but with a lower gene dosage (≤11.47), whereas plasma of patients with lung cancer depicted elevated level of AKT2 amplification (≤501.46; Figure 4).
Box plots of plasma free circulating DNA (fcDNA) AKT2 gene dosage of patients with lung cancer and matched controls.
The AKT2 amplification was found significant while analyzing plasma fcDNA AKT2 gene dosage. Amplification was associated with pack years, that is, smoking intensity and duration (rs = 0. 341; P = .004; Figure 5). However, it was not correlated with gender, age, or histological type of lung cancer. On ROC curve, AUC approached 0.808 (95% CI: 0.687-0.929), suggesting a fine discriminative ability of this assay (Figure 6). Diagnostic performance of this test is shown in Table 2.

Receiver operating characteristic (ROC) curve for the lung cancer diagnosis by plasma free circulating DNA (fcDNA) AKT2 gene dosage.

Box plots of relative methylation values for deleted in colorectal cancer (DCC) in patient and control samples.
Determination of Aberrant Promoter Methylation of DCC
Aberrant promoter methylation of DCC as determined by quantitative methylation-specific PCR showed significant differences in DCC promoter methylation status of patients with lung cancer and controls (P = .000). Of the 34 plasma samples from patients with lung cancer, hypermethylation of DCC-promoter was observed in 19 samples. Remarkably, aberrant methylation of DCC promoter was not observed in any of the control plasma-samples. This shows that it is highly specific. The distribution of methylation values for DCC in patients with lung cancer and control plasma is shown in Figure 6.
Aberrant methylation of the DCC promoter was found to discriminate between patients with lung cancer and matched controls by 55.9% sensitivity and 100% specificity. Area under the ROC curve was determined as 0.76 (95% CI: 0.641-0.88, P < .001; Figure 7). The methylation of DCC in fcDNA was associated with age (rs = 0.254; P = .037). It increased with increasing age (Figure 8). Significant association was also observed with pack years, that is, smoking intensity and duration (rs = 0.649; P = .000). However, no correlation was observed with the gender or histological type of lung cancer.

Receiver operating characteristic (ROC) curve for the lung cancer diagnosis by plasma free circulating DNA (fcDNA) deleted in colorectal cancer (DCC) methylation.
Distribution of DCC methylation with respect to age of controls and patients with lung cancer.
Discussion
Development of noninvasive diagnostic tests for cancer using blood samples is desired since long, as invasive approaches to get tumor tissue are not feasible in all the cases. The evidence for fcDNA in plasma of patients with cancer released from tumor provides this opportunity. 10,24 In lung cancer, quantification of fcDNA and molecular characterization of specific genetic and epigentic changes have been analyzed as diagnostic tool. Several methodologies have been described for quantitative analysis of fcDNA; the use of real-time PCR is most promising because of its high sensitivity and specificity. 13,25 –28 However, circulating DNA analysis has not been standardized to the extent to be used clinically as diagnostic test so far. This is because of variability in sample-processing, fcDNA isolation, and its quantification. 29 Therefore, the development of a reproducible method for clinical-application of this potential diagnostic assay is needed. In this study, the concentration of fcDNA is determined by quantitative PCR approach using hTERT. This single-copy gene is used as a reference marker, and its amplification corresponds to plasma’s fcDNA quantity. 13
This methodology of plasma fcDNA quantification was found to be very sensitive and specific with effective diagnostic performance as AUC curve approached 0.809 (95% CI: 0.708-0.910; P < .001). Furthermore, 6-fold high median fcDNA concentration of patients with lung cancer (22.8 ng/mL) as compared to healthy controls (2.8 ng/mL) was found. The previous quantitative studies based on real-time PCR methods report different but generally lower cutoff values for plasma-fcDNA-concentration. 13,26,30 –34 Our study also establishes a lower cutoff value (1.9 ng/mL), verifying the previous data. As it being a preliminary test for the identification of lung cancer risk, sensitivity is preferred to specificity to decrease the possibility of false negatives.
Previous data about prognostic factors related to fcDNA concentration are contradictory. The correlation of fcDNA with gender, histology, lung cancer stage, and age is unclear yet. 13,27 Our study is also in accordance with other reports, to be deficient in association of plasma fcDNA levels with pathological-factors. 26,27 In our samples, high plasma fcDNA concentrations in any histological subtype of lung cancer were observed without selectivity. A possible reason can be variation in selecting patients, including NSCLC as well as SCLC. A number of-studies report correlation of fcDNA with age, 13,14 excluding others. 27,28 The data we obtained have shown that plasma concentration was significantly correlated with age (rs = 0.56; P = .000), as it increased with increasing age. Significant association of fcDNA levels was also observed with pack years, that is, intensity and duration of smoking (rs = 0.50; P = .000).
In the present study, AKT2 amplification status and DCC promoter methylation status were also evaluated in plasma fcDNA. AKT2 is present on chromosome 19 (19q13.1-q13.2). It encodes cytoplasmic protein (RAC-β serine/threonine-protein kinase), which activates through growth factor receptor signaling pathway. It is involved in significant functions related to normal as well as tumor cell physiology, such as growth regulation, cell survival, metabolism, and proliferation. 35 Previous studies have found various pulmonary SCCs with amplification of AKT2. Also elevated expression of AKT2 was seen in lung tumor tissue. 35,36 In our case, AKT2 was frequently amplified in plasma fcDNA from patients with lung cancer (70.5%), as compared to healthy controls (11%). As a biomarker, AKT2 exhibited good diagnostic performance with AUC-ROC curve 0.808 (95% CI: 0.687-0.929). AKT2 amplification was associated with pack years, that is, smoking intensity and duration (rs = 0. 341; P = .004). However, it was correlated neither to individual’s age or gender nor to histological type of lung cancer.
Evidently, quantification of gene copy number changes in plasma by quantitative PCR presents an attractive lung cancer’s diagnostic method. However, small-fcDNA-amount in plasma does not reveal the location of tumor in the lung and also it is not lung cancer specific, 21,35,36 because AKT2 amplification have been observed in other cancer types like pancreatic 37 colorectal 38 and ovarian cancer. 39 Thus, AKT2 can function as complementary means to diagnostic techniques presently in use for lung cancer diagnosis, such as CT scan, capable of noninvasive tumor localization providing comprehensive diagnosis.
DNA methylation, an epigenetic- change capable of inactivating tumor-suppressor-genes presents tumor-biomarker 40 –42 which occurs in distinct CpG-Islands of gene's regulatory-region and can be much conveniently quantified. Also amplification of DNA methylation can be easily performed via PCR even if extracted DNA concentration is low. 43,44 So it can serve as the promising biomarker for cancer detection.
Here, we determined the frequency of tumor suppressor gene DCC promoter methylation in plasma of patients with lung cancer and healthy controls. Deleted in colorectal cancer was validated as a tumor marker in head and neck cancer 45 as well as esophageal SCC. 46 Deleted in colorectal cancer is present on chromosome 18q, suppresses epithelial cell malignant phenotype, 47 and is involved in apoptosis. 48 It appeared to be a highly specific assay as remarkably aberrant methylation of DCC promoter was not observed in any of the control plasma samples, with AUC ROC curve to be 0.76 (95% CI: 0.641-0.88, P < .001). The methylation of DCC in fcDNA was associated with age (rs = 0.254; P = .037). Its level increased with increasing age. Significant association was also observed with pack years, that is, intensity and duration of smoking (rs = 0.649; P = .000). Albeit lung cancer diagnosis sensitivity is only 55.88% with DCC, the high lung cancer specificity (100%) indicates the usefulness of methylation-specific quantitative PCR assay in lung cancer recognition. It is tempting to combine methylation with promising methods like low-dose spiral CT. 49,50 As poor specificity being a major drawback of low-dose spiral CT, combining it with plasma DNA methylation can solve this problem.
So, the 3 biomarkers panel of fcDNA could be potentially used as a low-cost and less invasive approach for earlier diagnosis of lung cancer or to evaluate suspicious diagnosis cases and their management.
Footnotes
Abbreviations
Declaration of Conflicting Interests
The author(s) declared no potential conflicts of interest with respect to the research, authorship, and/or publication of this article.
Funding
The author(s) received no financial support for the research, authorship, and/or publication of this article.