
Abstract
Introduction
Accurate preoperative prediction of the International Association for the Study of Lung Cancer (IASLC) grading is crucial for developing individualized management and surgical strategies in lung adenocarcinomas (LUAD). Computed tomography (CT) radiomics serves as an important imaging biomarker for classification tasks in LUAD. However, the robustness and accuracy of radiomics models remain subjects of ongoing debate.
Methods
In this study, we conducted an analytical comparison of two critical steps in radiomics: dimensionality reduction and feature selection, aiming to differentiate between Grade 1 and Grade 2–3 tumors according to the preoperative IASLC grading system for LUAD. 1) For dimensionality reduction, we sequentially combined the T-test, Pearson correlation, and Least Absolute Shrinkage and Selection Operator (LASSO), while considering principal component analysis (PCA) for comparison. 2) For feature selection, we utilized various machine learning (ML) techniques including Logistic Regression (LR), Random Forest (RF), Gradient Boosting (GBC), XGBoost, Light Gradient Boosting Machine (LGBM), and Categorical Boosting (CatBoost). The diagnostic efficacy was evaluated using receiver operating characteristic curve (ROC) and the corresponding area under the curve (AUC).
Conclusion
We demonstrated that the T-test→Pearson→LASSO approach is more appropriate for radiomics feature dimensionality reduction compared to PCA. Additionally, we improved the commonly used LR feature selection method in medical research by employing the more advanced LGBM for distinguishing between Grade 1 and Grade 2–3 tumors in accordance with the preoperative IASLC grading system for LUAD.
Introduction
Lung adenocarcinoma (LUAD) is the most prevalent form of lung cancer, exhibiting a wide range of histological features. Approximately 80% to 90% ofLUAD cases present a mix of different histologic patterns. 1 The Pathology Committee of the International Association for the Study of Lung Cancer (IASLC) categorizes LUAD based on predominant subtypes (eg, solid, micropapillary, acinar, papillary, and lepidic) and high-risk patterns (including solid, micropapillary, and/or complex glandular components). Specifically, lepidic patterns with no or less than 20% high-risk components are classified as Grade 1. A predominant papillary or acinar component with less than 20% high-grade patterns is Grade 2, while any component with 20% or more high-grade patterns is Grade 3.2–4
The overall survival and disease-free survival rates differ significantly among Grades 1–3, with Grade 1 showing a more favorable prognosis than Grades 2 and 3.2–4 Consequently, Grades 2–3 often necessitate anatomic lobectomy and systematic lymph node dissection, whereas Grade 1 typically requires regular follow-up.5,6 Thus, accurate preoperative prediction of IASLC grading in LUAD is vital for tailored disease management and treatment plans.
Radiomics, an emerging field within medical imaging, involves the extraction and analysis of quantitative features from radiographic images to characterize tumor heterogeneity and assess the biological characteristics of lung cancer.7–9 This approach encompasses several stages: image preprocessing, feature extraction, dimensionality reduction, and feature selection. Previous studies have developed a computed tomography (CT)-based radiomics method for classifying the pathological types and IASLC grading of LUAD patients.10–15 These studies particularly focused on using a combination of the T-test, Pearson correlation, and Least Absolute Shrinkage and Selection Operator (LASSO) (T-test→Pearson→LASSO (TPL)) for dimensionality reduction, followed by the radiomics score for classification based solely on logistic regression (LR).10–15 Despite these advancements, enhancing the robustness and accuracy of radiomics models remains a significant challenge, especially during the stages of dimensionality reduction and feature selection. 16
Developing reliable and highly accurate predictive models is essential for advancing radiomics methodologies. Machine learning (ML) classifiers are increasingly integrated with radiomic features to boost model performance. 17 Various ML models, including LR, k-nearest neighbors (kNN), random forest (RF), and eXtreme Gradient Boosting (XGBoost), have been used in lung cancer research to predict gene mutations, 18 assess pathological invasiveness, 19 and predict outcomes. 20
In this study, we focused on systematically optimizing the radiomics workflow for IASLC grading by investigating both dimensionality reduction and machine learning strategies. Specifically, we compared supervised feature selection pipelines—combining T-test, Pearson correlation, and LASSO (T-test→Pearson→LASSO)—with unsupervised approaches such as Principal Component Analysis (PCA) to identify the most effective feature extraction scheme. Furthermore, we employed multiple supervised machine learning algorithms, including LR, RF, Gradient Boosting Classifier (GBC), XGBoost, Light Gradient Boosting Machine (LGBM), and Categorical Boosting (CatBoost), to comprehensively evaluate model robustness and generalizability. To the best of our knowledge, few studies have systematically compared the influence of different dimensionality reduction and machine learning frameworks on radiomics-based IASLC grading, particularly in differentiating Grade 1 from Grade 2–3 lung adenocarcinomas. By leveraging a large multicenter CT cohort, our study aims to enhance the reliability, interpretability, and clinical applicability of radiomics models for preoperative IASLC grading, thereby supporting more individualized management and treatment strategies in lung cancer.
Methods
Large Multicenter CT Database
In this study, we utilized a large multicenter CT database that included patients from three hospitals: Xiangtan Central Hospital (Center 1), the Affiliated Hospital of Southwest Medical University (Center 2), and the Affiliated Hospital of Guilin Medical University (Center 3). These patients received preoperative CT scans that revealed malignant pulmonary nodules and underwent surgical resection between January 2018 and June 2023, culminating in a pathological diagnosis of LUAD. Our study specifically aimed to enroll patients who met the following criteria: (i) a maximum tumor length not exceeding 30 mm; (ii) chest CT scans conducted within 7 days prior to surgery; and (iii) availability of CT scans with a thin slice thickness of less than 1.5 mm. The exclusion criteria included: (i) presence of multiple primary lung cancers or metastases, (ii) prior history of chemotherapy or radiotherapy, and (iii) concurrent existence of other malignancies.
Given the retrospective nature of our investigation, informed consent was obtained from all participants. The study was approved by the local ethics committees: the Medical Ethics Committee of Xiangtan Central Hospital (Approval No. 2021-07-009, July 19, 2021), the Clinical Trial Ethics Committee of the Affiliated Hospital of Southwest Medical University (Approval No. KY2020147, August 12, 2020), and the Medical Ethics Committee of the Affiliated Hospital of Guilin Medical University (Approval No. 2023YJSLL-121, December 22, 2023). To evaluate the proposed classification task utilizing a radiomic approach, all performance metrics were primarily assessed using the testing set. The screening flowchart of the enrolled patients is presented in Figure 1.

The screening low chart of enrolled multicenter CT database.
CT Images Preprocessing and Lesion Segmentation
The CT scanning parameters employed in this study were consistent with those used in our prior research.12,21 For the specific CT scanning parameters of our study, please refer to Supplemental Digital Content 1. We utilized ITK-SNAP software (version 4.0, www.itksnap.org) to perform a slice-by-slice delineation of the gross tumor volume along the tumor boundary, thereby generating a corresponding whole lesion mask. Initially, mask drawing was conducted on CT images using the lung window settings. A certified cardiothoracic radiologist identified the tumor border, and the mask was then manually segmented across all two-dimensional sections of the nodule, with the goal of minimizing the inclusion of adjacent vessels, bronchi, and pleura. Following this, another cardiothoracic radiologist with over a decade of experience in the field reviewed and adjusted the lesion delineation as necessary. Any discrepancies among the observers were discussed, and final masks were determined by consensus to minimize inter-observer variability and ensure the accuracy and reproducibility of the segmentation.
Radiomics Feature Extraction
The original CT image and segmented mask were imported into Spyder (Python version 3.7.0) for further processing, with the pixel values of the images scaled to a range of 0 to 1. Subsequently, the volumes were resampled to a voxel size of 1×1×1 mm3 using a bicubic interpolation algorithm implemented with the ‘Numpy’ package. Following this step, radiomic features were extracted from the region of interest (ROI) on the CT image corresponding to the mask utilizing the ‘PyRadiomics' package.
22
To capture high-order image patterns, in addition to the original images, we applied Wavelet filters (yielding 8 decompositions: LLL, LLH, LHL, LHH, HLL, HLH, HHL, HHH) and Laplacian of Gaussian (LoG) filters (with sigma values of 1.0, 2.0, 3.0, 4.0, and 5.0 mm). This comprehensive tool facilitated the extraction of a total of 1239 distinct radiomics features (the samples
Dimensionality Reduction
The extracted original CT radiomics features are highly correlated and are numerous. To reduce the dimensionality of the features and facilitate model training, we combined T-tests, Pearson correlation, and LASSO in the following order: T-test→Pearson→LASSO. Additionally, we employed unsupervised ML techniques, such as PCA.
T-test
The T-test, also known as the Student T-test, is a very common test method in statistical inference. 23 It is used when the statistic follows a normal distribution but the variance is unknown. The T-test uses t-distribution theory to deduce the probability of differences, thereby comparing whether the difference between two averages is significant. The T-test can be divided into one-sample test, independent two-sample test, and dependent T-test for paired samples.
The dependent T-test for paired samples is used to test the differences in data obtained from two matched groups of subjects or the data obtained from the same group of subjects under different conditions. The samples consisting of these two situations are related samples (

In this study, we performed a T-test to identify features with
Pearson Correlation Coefficient
Pearson correlation coefficient is a statistical metric that measures the strength and direction of a linear relationship between two random variables.
24
The Pearson correlation coefficient between two variables is defined as the quotient of the covariance and the standard deviation between the two variables:

The above formula defines the overall correlation coefficient, which is usually represented by

In this study, we conducted Pearson's correlation analysis to eliminate redundant features that showed a correlation coefficient
Finally, the samples
LASSO Regression
One of the most important problems in ML is over-fitting. During the minimization of the loss function, our focus on reducing the loss value on the training set can lead us to neglect the model's generalization capabilities. Adding regularization terms is a very good way to solve the over-fitting problem. Common regularization terms are L1 regularization and L2 regularization, which correspond to LASSO regression and Ridge regression respectively in linear regression.
The basic idea of LASSO is to minimize the residual sum of squares under the constraint condition that the absolute sum of the regression coefficients is less than a constant, so that some regression coefficients that are strictly equal to 0 can be generated, and an interpretable model can be obtained.
The mathematical expression is as follows:

This mathematical expression is also equivalent to minimizing the following penalty least squares:

The main advantage of LASSO method is that it compresses the variables with large parameter estimates less, while the variables with small parameter estimates are compressed to 0, and the parameter estimation of LASSO analysis has continuity, which is suitable for model selection of high-dimensional data.27,28 The determination of h value can be estimated using the Least-angle regression (LARS).
29
LARS is similar to forward stepwise regression. At each step, it finds the feature most correlated with the target. When there are multiple features having equal correlation, instead of continuing along the same feature, it proceeds in a direction equiangular between the features. Finally, the samples
Feature Selection
We employed multiple supervised ML algorithms for feature selection, including LR, RF, GBC, XGBoost, LGBM, and CatBoost. The selected radiomics features, after dimensionality reduction, were individually entered into the models30,31:
LR is a statistical model that uses a logistic function to model a binary dependent variable. It's widely used for classification tasks, where it estimates the probability that a given input point belongs to a certain class.
32
RF is an ensemble learning method that constructs multiple decision trees during training and outputs the class that is the mode of the classes for classification of the individual trees. It inherently performs feature selection by evaluating the importance of each feature based on its contribution to the decision-making process across all trees.
33
GBC is a powerful ensemble technique that builds models in a stage-wise fashion. Each new model attempts to correct the errors of the previous models and can handle both binary and multi-class classification problems. Feature importance can be derived from the contribution of each feature to the overall model performance across the boosting stages.
34
XGBoost is an optimized distributed gradient boosting library designed for efficiency, flexibility, and portability. It implements a scalable tree boosting system and is widely recognized for its performance in various ML competitions. Feature importance in XGBoost can be assessed based on the gain of each feature when splitting the data.
35
LGBM is a gradient boosting framework that employs tree-based learning algorithms and is designed to be more efficient than traditional gradient boosting methods. It utilizes techniques such as Gradient-based one-side sampling and exclusive feature bundling to reduce the number of data instances and features, respectively, without sacrificing accuracy.
36
CatBoost is an open-source gradient boosting library that can directly handle categorical features during training, significantly improving model performance for datasets with many categorical variables. It implements several techniques to prevent overfitting, such as ordered boosting. Feature importance in CatBoost can be evaluated based on the influence of each feature on the model's predictions.
37
The diagnostic efficacy was evaluated using receiver operating characteristic curve (ROC) and the corresponding area under the curve (AUC). Additionally, we adopted four metrics to assess classification performance: Accuracy, Sensitivity, Specificity, and Precision, which are defined in equation 7.


The Overall Diagnostic Pipeline
We summarize the diagnostic pipeline of this study in Figure 2 and present the theoretical framework in Algorithm 1. The process begins with the segmentation of the input CT image, followed by the extraction of radiomics features. To reduce correlation and redundancy among these original features, we apply the T-test→Pearson→LASSO method. Using the final selected features, we construct a diagnostic model using the optimal ML algorithm. For the binary classification task, which specifically distinguishes between Grade 1 and Grade 2–3 tumors based on the preoperative IASLC grading system for LUAD, we use the training set to train the model, the validation set to tune parameters and select the optimal configuration, and finally, we test the model on the test set.

Pipeline for the radiomics methodology: dimensionality reduction and feature selection processes.
Implementation Details
All data preprocessing and feature selection procedures were implemented in Python (version 3.7.0). The ‘SciPy’ package was used to perform the T-test and Pearson correlation analyses during feature selection. The ‘scikit-learn’ package was used to perform LASSO regression and several ML classification methods.38,39
Statistical Analysis
All statistical analyses and modeling were performed using R (version 3.6.3; R Foundation for Statistical Computing). The comparison of diagnostic efficacy ROC curves and calculation of Accuracy, Sensitivity, Specificity, and Precision were conducted using the reportROC package. Comparisons of baseline characteristics across the training, validation, and testing sets were performed using the tableone package.
Results
Patient Characteristics
The complete CT database, comprising 1333 scans, was systematically categorized into three distinct subsets: a training set consisting of 800 scans (60%), a validation set comprising 200 scans (15%), and a testing set containing 333 scans (25%). In total, the dataset consisted of 487 Grade 1, 759 Grade 2, and 87 Grade 3 scans. Among them, 292 Grade 1, 447 Grade 2, and 61 Grade 3 scans were assigned to the training set; 73 Grade 1, 115 Grade 2, and 12 Grade 3 scans to the validation set; and 122 Grade 1, 197 Grade 2, and 14 Grade 3 scans to the testing set.

Table 1 presents a comprehensive overview of patient demographics, tumor characteristics, and grade distribution, demonstrating that the study cohort is representative across essential clinical variables. Statistical analysis revealed no significant differences (
Comprehensive Comparison of Training, Validation and Testing Sets.

Dimensionality Reduction
In this study, we sequentially combined the T-test, Pearson correlation, and LASSO regression for dimensionality reduction among features. Following the application of the T-test and Pearson's correlation test, we retained 989 and 984 features, respectively. To further refine our feature selection, we utilized LASSO regression with 10-fold cross-validation, as depicted in Figure 3. This procedure resulted in the exclusion of 10 features with coefficients below 0.01, leaving us with a final subset of only 7 selected features. The constructed radiomic signatures are illustrated in Figure 4. Both dimensionality reduction techniques were initially executed on the training set and were later applied to the validation and test sets.

Feature selection for the LASSO logistic regression and the predictive accuracy of the radiomics signature. (a) LASSO coefficient profiles for all features. (b) Selection of tuning parameter (λ) using 10-fold cross-validation with minimum criteria.

Distribution of the selected radiomics features by LASSO.
Evaluation of Diagnostic Performance of Radiomic Models
For the selected radiomics features after dimensionality reduction (T-test→Pearson→LASSO), we evaluated the diagnostic performance of widely used ML methods to perform subsequent feature selection and construct the final radiomic model. The methods employed included LR, RF, GBC, XGBoost, LGBM, and CatBoost. As illustrated in Figure 5, the diagnostic performance on the validation set closely resembles that of the test set, indicating that the feature dimension reduction pipeline employed in this study is both effective and stable. Furthermore, the performance of the LR classification method, which has been previously used to classify LUAD patients’ pathological types and IASLC grading,10–13 is significantly lower compared to the other ensemble methods.
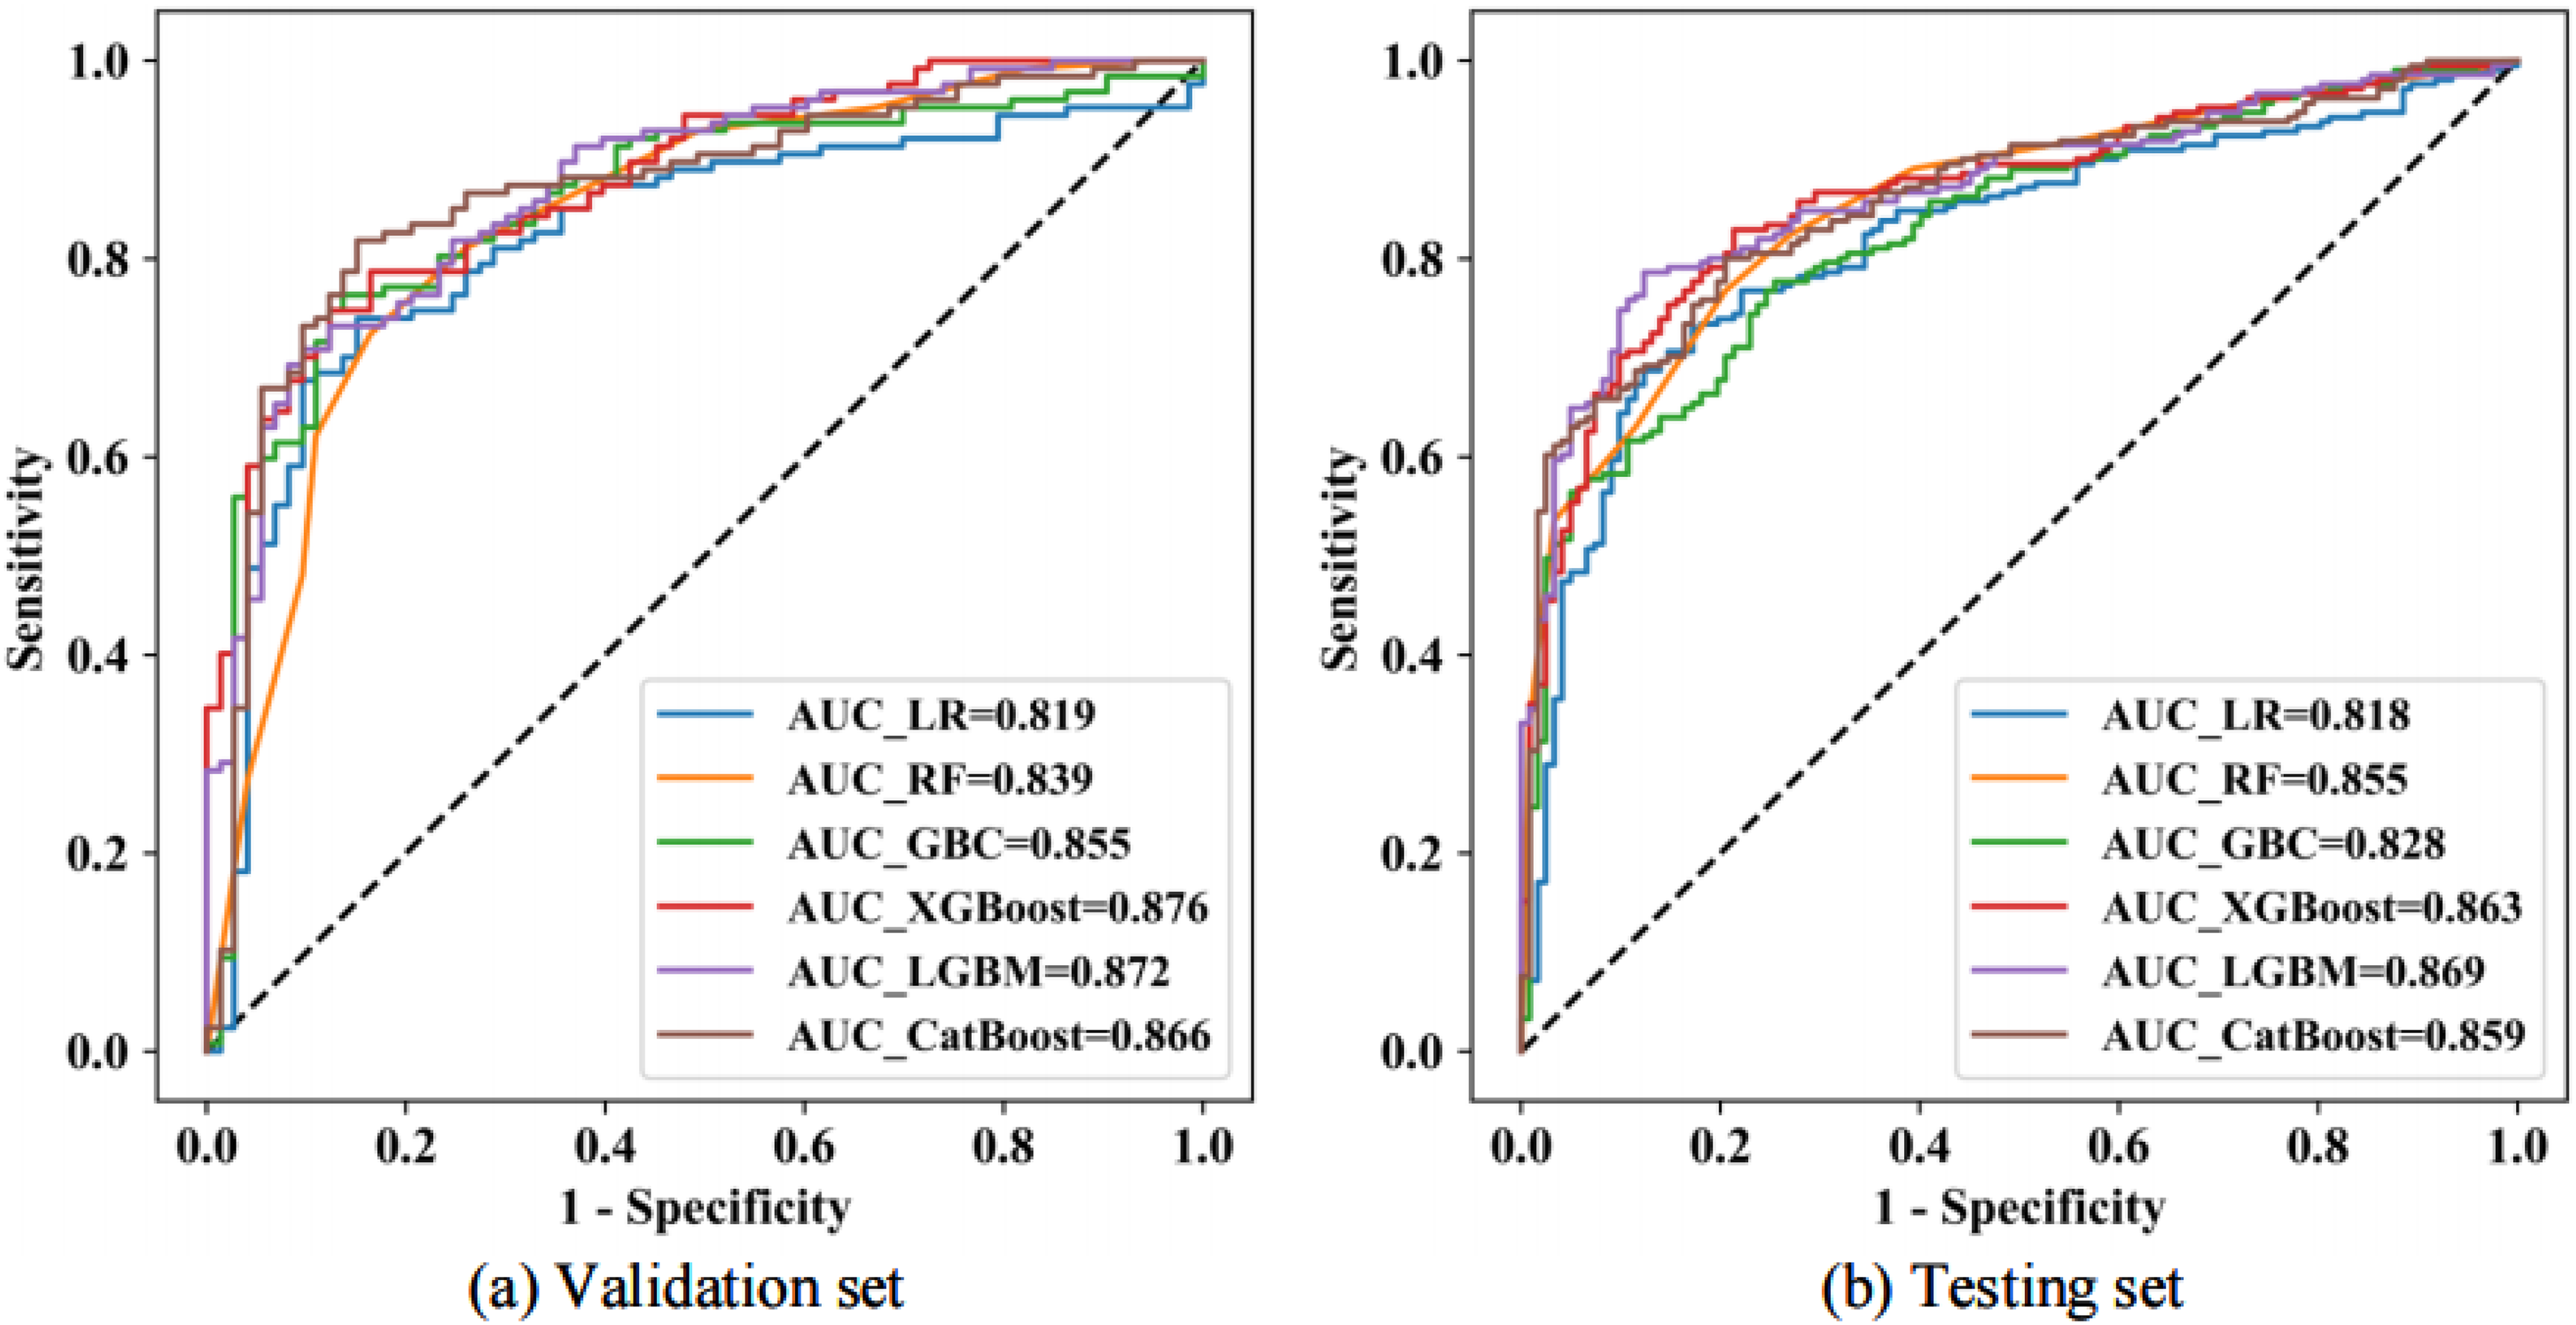
The ROC curves demonstrating the predictive performance of various machine learning methods used in radiomics model construction are presented for the validation set (a) and the testing set (b).
The diagnostic performance metrics for various radiomics approaches, which include dimensionality reduction techniques (T-test→Pearson→LASSO) and ML for subsequent feature selection, are summarized in Table 2. Notably, in the test set, the AUC for the combined dimensionality reduction method of T-test→Pearson→LASSO, along with different ML feature selection methods, significantly increased from 0.818 to 0.869. Among these, the LGBM achieved the highest performance, reaching an AUC of 0.869, while the LR displayed the lowest performance, with an AUC of 0.818 . Therefore, we define this approach as the Radiomics (TPL- LGBM) model.
Comprehensive Comparison of the Diagnosis Performance of LR, RF, GBC, XGBoost, LGBM and CatBoost. The Best and Second Best Results are Highlighted in Bold Font and Underlined Ones, Respectively.

The Visualizations of Classification Effect
The t-distributed Stochastic Neighbor Embedding (t-SNE) technique was employed to visually display the effects of the classification task for the Radiomics (TPL-LGBM) model. The t-SNE visualizations of both the original features and the features after dimensionality reduction are shown in Figure 6. From these visualizations, it is evident that the data from the original features is not easily distinguishable, with the two categories appearing entangled. However, after applying dimensionality reduction, the data can be more clearly separated, which enhances the final classification performance. These results strongly indicate that the Radiomics (TPL-LGBM) model utilized in this study is effective.

The t-Stochastic Neighbor Embedding (t-SNE) visualizations of original features (a) and features after dimensionality reduction (b).
Comparison of Alternative Radiomic Models
We conducted an alternative radiomics model that utilizes PCA for dimensionality reduction and ML for feature selection. This approach was compared with the Radiomics (TPL-LGBM) model.
The theoretical framework for dimensionality reduction using PCA is presented in Algorithm 2. The main goal of PCA40–42 is to identify a new set of orthogonal bases that transforms the data from an (n)-dimensional space to a (k)-dimensional space, such that the distance between the data points is maximized. In other words, PCA seeks to maximize the variance among the data points after they are projected onto the plane formed by these orthogonal bases. When the variance is maximized for each individual orthogonal basis, it inherently ensures that the projected distances are also maximized on the corresponding plane.
PCA reduces the data from (n) dimensions to (k) dimensions, and the next crucial step is determining the appropriate value for (k). A common selection criterion involves evaluating the ratio of variance before and after projection, and for this study, we established a variance ratio threshold of 0.90. Ultimately, the data was successfully compressed to (k = 24) using PCA.
A comparison of the classification performance on the testing set between two mainstream radiomics approaches was conducted: the first utilizes PCA for dimensionality reduction and ML for feature selection, while the second employs the T-test→Pearson→LASSO for dimensionality reduction followed by ML for feature selection. The results are visually represented in a bar graph (Figure 7). The findings indicate that the dimensionality reduction method using the T-test→Pearson→LASSO outperforms PCA. This advantage can be attributed to PCA's potential inability to effectively eliminate redundancy among the original features, as PCA operates in an unsupervised manner, whereas LASSO is a supervised learning method.

Comparison of classification performance between two mainstream radiomics approaches on the testing set.

Discussion
The IASLC grading system for lung adenocarcinoma provides critical prognostic information, making preoperative identification of tumor grade essential for tailoring treatment strategies. Our radiomics model offers a noninvasive approach to differentiate Grade 1 from Grade 2–3 tumors, thereby directly informing surgical decisions. Specifically, a prediction indicating Grade 2–3 pathology could justify anatomic lobectomy with lymph node dissection, which aligns with the aggressive biological behavior of these grades. Conversely, a Grade 1 result may support regular surveillance rather than immediate surgical intervention. Integrating this tool into multidisciplinary workflows—for instance, within radiology reporting systems—would thus provide a standardized, quantitative assessment to augment preoperative planning.
The radiomics process encompasses several key stages, including image preprocessing, feature extraction, dimensionality reduction, and feature selection. In previous studies, researchers have developed CT-based radiomics approaches to classify the pathological types and IASLC grading of LUAD patients. These studies particularly focused on using a combination ofthe T-test, Pearson correlation, and LASSO for dimensionality reduction, followed by the radiomics score for classification based solely on LR. However, enhancing the robustness and accuracy of radiomics models continues to be a challenge, particularly during the stages of dimensionality reduction and feature selection.
In this study, we focused on systematically optimizing the radiomics workflow for IASLC grading by investigating both dimensionality reduction and machine learning strategies. The main findings of the study are as follows: i) We demonstrated, for the first time, the robustness and accuracy of radiomics models in differentiating between Grade 1 and Grade 2–3 tumors in IASLC grading for LUAD based on a large multicenter CT database; ii) the T-test, Pearson correlation, and LASSO approach prove to be more suitable for radiomics feature dimensionality reduction compared to PCA; iii) we enhanced the commonly used LR feature selection method by employing the more advanced LGBM for distinguishing between Grade 1 and Grade 2–3 tumors according to the IASLC grading system for LUAD patients.
The findings from the radiomics experiment reveal distinct advantages of certain methods over others in the realms of dimensionality reduction and feature selection. Firstly, the observation that the T-test, Pearson correlation, and LASSO approach are more suitable for radiomics feature dimensionality reduction compared to PCA stems from their fundamental methodological differences. LASSO, in particular, stands out as a supervised learning method that considers the outcome variable (distinguishing between Grade 1 and Grade 2-3 tumors) when selecting features. This process potentially retains the features that are most predictive of the outcome. In contrast, PCA is an unsupervised learning technique focused on reducing dimensionality by retaining components that explain the most variance without regard to the outcome. This methodological difference likely explains why supervised approaches like LASSO are more effective in identifying relevant features for predicting specific outcomes in radiomics studies.
Furthermore, enhancing the commonly used LR feature selection method by employing the more advanced LGBM to distinguish between Grade 1 and Grade 2–3 tumors underscores the superiority of advanced ML algorithms in capturing complex patterns in image data. LGBM is recognized for its efficient handling of large datasets, its robustness against overfitting through techniques such as gradient boosting and regularization, and its ability to model non-linear relationships and interactions between features. These strengths make LGBM particularly well-suited for tasks where the relationship between features and the outcome is intricate and not easily modeled by traditional linear approaches like LR. This advantage is particularly evident when compared with recent state-of-the-art studies published in 2024 and 2025. For instance, recent works by Chen et al, 11 Zuo et al, 12 and Koo et al 13 have successfully validated the robustness of the TPL dimensionality reduction pipeline for IASLC grading; however, these studies predominantly relied on LR-based models for classification. While effective, linear models may fall short in capturing high-order non-linear interactions within radiomics data. In contrast, our study demonstrates that integrating the proven TPL pipeline with the non-linear LGBM classifier yields a superior AUC of 0.869 compared to LR (AUC = 0.818 in our cohort). This direct comparison highlights the novelty of our work: moving beyond standard linear modeling to unlock the full potential of radiomics features through advanced ensemble learning. The adoption of LGBM over LR for feature selection highlights the advantages of advanced machine learning algorithms in capturing the nuanced patterns and interactions within radiomics data, ultimately enhancing the accuracy and reliability of tumor grading in LUAD patients.
Based on the reasoning outlined above, we consider this radiomics process, which incorporates dimensionality reduction techniques (T-test→Pearson→LASSO) followed by LGBM for subsequent feature selection, as detailed in Algorithm 1. This process is defined as the Radiomics (TPL-LGBM) model, aimed at accurately classifying IASLC grading for lung adenocarcinoma based on preoperative CT scans. Furthermore, we paid close attention to the potential risk of overfitting, a common challenge in high-dimensional radiomics studies. By employing LASSO regression with 10-fold cross-validation, we effectively penalized redundant features. Crucially, we monitored the generalization gap between the validation and testing datasets. The results showed a negligible difference in performance, with an AUC of 0.872 in the validation set and 0.869 in the testing set. This consistency confirms that our model has achieved a robust balance between complexity and generalizability, effectively mitigating the risk of overfitting. We also addressed the potential concern regarding the testing set size (n = 333) and class distribution. Although the prevalence of pure Grade 3 tumors was relatively low, our study design focused on the binary differentiation of Grade 1 versus Grade 2–3 to align with surgical management strategies. In this context, the testing set comprised 122 Grade 1 cases and 211 Grade 2–3 cases. This distribution provides a sufficient and balanced sample size to draw statistically confident conclusions regarding the model's generalization capability. To visually display the effects of the classification task, we employed the t-SNE technique.
t-SNE is a nonlinear dimensionality reduction method that explores the structure of high-dimensional data. It is particularly suitable for visualizing high-dimensional data because it effectively preserves the local structure of the original data in a lower-dimensional space. This characteristic has contributed to the growing popularity of t-SNE in the fields of ML and data analysis. The core idea behind t-SNE involves defining a probability distribution between data points in the high-dimensional space to represent the similarity between them. The t-SNE algorithm aims to ensure that the similarity matrix in the higher-dimensional space aligns as closely as possible with the similarity matrix in the lower-dimensional space. By minimizing the difference between these two distributions using Kullback-Leibler (KL) divergence, t-SNE effectively maps high-dimensional data into a low-dimensional space for visualization. In the gradient descent calculation, the input consists of the coordinates of each point in the low-dimensional space. These coordinates are the parameters we want to optimize, while the output represents the similarity between points in this lower-dimensional space, calculated from the current low-dimensional coordinates. The labels correspond to the similarity between points in the high-dimensional space, derived from the original raw high-dimensional data. Our goal is to adjust the coordinates (ie, inputs) of a point in the low-dimensional space so that the calculated similarity from these coordinates (ie, the output) closely matches the similarity of the known high-dimensional space (ie, the labels). To achieve this, we compute the gradient of the loss function (ie, the KL divergence) with respect to each low-dimensional coordinate and use this gradient to update the coordinates. This iterative process continues until a predetermined number of iterations is reached or until the change in the low-dimensional coordinates falls below a specified threshold. The t-SNE visualizations display both the original features and the features after dimensionality reduction (Figure 6). From these visualizations, it is evident that the data from the original features are not easily distinguishable, with the two categories appearing entangled. However, after applying dimensionality reduction, the data can be more clearly separated, which enhances the final classification performance. These results strongly indicate that the Radiomics (TPL-LGBM) model utilized in this study is effective.
This study is subject to several limitations. Firstly, being retrospective in nature, it is susceptible to selection bias concerning the retrospective pathologic diagnosis. Secondly, as the study involves a comprehensive analysis of a large multicenter CT database, the use of CT scanners from various manufacturers across multiple medical centers may contribute to variability in the results. Thirdly, although the data were collected from multiple centers, no independent external validation cohort was established, which limits the ability to fully assess the generalizability of the proposed radiomics model across different institutions. Fourthly, a follow-up study was not conducted in this report, which limits the ability of the radiomics model to further associate with surgical strategy selection and patient outcome prediction. Fifthly, regarding the multicenter nature of our data, we employed z-score normalization to standardize feature scales. However, we did not apply advanced harmonization techniques, such as ComBat, to explicitly correct for scanner-specific batch effects. While our model showed robust performance across centers, future studies could incorporate such harmonization methods to further minimize potential variations between different imaging protocols. Finally, although the proposed dimensionality reduction and classification framework demonstrated promising performance for IASLC histological grading, its generalizability and broader clinical applicability—such as for prognostic prediction or differentiation between benign and malignant lesions—have not yet been fully validated. Further studies with expanded datasets, independent external validation, and diverse clinical tasks are warranted to confirm its robustness and clinical utility.
Conclusion
In this study, we demonstrated that the T- test→Pearson→LASSO approach is more suitable for radiomics feature dimensionality reduction compared to PCA. Furthermore, we enhanced the commonly used LR feature selection method in medical research by employing the more advanced LGBM technique to distinguish between Grade 1 and Grade 2–3 tumors, aligning with the preoperative IASLC grading system for LUAD. The Radiomics (TPL-LGBM) model shows promising performance and may assist physicians in formulating comprehensive treatment strategies.
Supplemental Digital Content 1
CT Scan Parameters
Preoperative chest CT examinations were performed at several institutions using multidetector CT scanners: Center 1 (uCT550 or CT760, Shanghai United Imaging Healthcare, Shanghai, China), Center 2 (Brilliance iCT, Philips Healthcare, Best, the Netherlands), and Center 3 (Revolution CT 256-slice, GE Healthcare, Chicago, IL, USA).
Patients were scanned in the supine position using helical acquisition and were asked to hold their breath during imaging. Coverage extended from the lung apices to below the costophrenic angles. Volumetric acquisition parameters were: tube voltage 120 kV, tube current–time product 180–280 mA, and matrix size 512×512. Images underwent standard preprocessing and were reconstructed with a standard algorithm; slice thickness and reconstruction interval ranged from 0.55 to 0.625 mm.
Footnotes
Abbreviations
Acknowledgments
Ethical Approval
This study was approved by the local ethics committees: the Medical Ethics Committee of Xiangtan Central Hospital (Approval No. 2021-07-009, July 19, 2021), the Clinical Trial Ethics Committee of the Affiliated Hospital of Southwest Medical University (Approval No. KY2020147, August 12, 2020), and the Medical Ethics Committee of the Affiliated Hospital of Guilin Medical University (Approval No. 2023YJSLL-121, December 22, 2023).
Consent to Participate
Given the retrospective nature of our investigation, informed consent was obtained from all participants.
Consent for Publication
Not applicable.
Author Contributors
(I) Conception and design: Xiaohong Fan, Zhichao Zuo; (II) Administrative support: Zhichao Zuo, Jinqiu Deng; (III) Provision of study materials or patients: Yujie Feng; (IV) Collection and assembly of data: Wanyin Qi, Shanyue Lin; (V) Data analysis and interpretation: Ying Zeng, Xiaohong Fan; (VI) Manuscript writing: All authors; (VII) Final approval of manuscript: All authors.
Funding
The authors received no financial support for the research, authorship, and/or publication of this article.
Declaration of Conflicting Interests
The authors declared no potential conflicts of interest with respect to the research, authorship, and/or publication of this article.
Data Availability
The data for this study are available by contacting the corresponding author upon reasonable request.
Guarantor
Zhichao Zuo(zuozhichao1991@sina.com).