
Abstract
Background
Early detection and accurate differentiation of malignant ground-glass nodules (GGNs) in lung CT scans are crucial for the effective treatment of lung adenocarcinoma. However, existing imaging diagnostic methods often struggle to distinguish between benign and malignant GGNs in the early stages. This study aims to predict the malignancy risk of GGNs observed in lung CT scans by applying two radiomics methods: topological data analysis and texture analysis.
Methods
A retrospective analysis was conducted on 3223 patients from two centers between January 2018 and June2023. The dataset was divided into training, testing, and validation sets to ensure robust model development and validation. We developed topological features applied to GGNs using radiomics analysis based on homology. This innovative approach emphasizes the integration of topological information, capturing complex geometric and spatial relationships within GGNs. By combining machine learning and deep learning algorithms, we established a predictive model that integrates clinical parameters, previous radiomics features, and topological radiomics features.
Results
Incorporating topological radiomics into our model significantly enhanced the ability to distinguish between benign and malignant GGNs. The topological radiomics model achieved areas under the curve (AUC) of 0.85 and 0.862 in two independent validation sets, outperforming previous radiomics models. Furthermore, this model demonstrated higher sensitivity compared to models based solely on clinical parameters, with sensitivities of 80.7% in validation set 1 and 82.3% in validation set 2. The most comprehensive model, which combined clinical parameters, previous radiomics features, and topological radiomics features, achieved the highest AUC value of 0.879 across all datasets.
Conclusion
This study validates the potential of topological radiomics in improving the predictive performance for distinguishing between benign and malignant GGNs. By integrating topological features with previous radiomics and clinical parameters, our comprehensive model provides a more accurate and reliable basis for developing treatment strategies for patients with GGNs.
Keywords
Introduction
Lung cancer, driven by factors such as smoking and environmental pollution, has become the most prevalent tumor worldwide, with its incidence and mortality rates continually rising. 1 The widespread use of low-dose computed tomography (LDCT) has significantly increased the detection rate of lung nodules. A recent report indicated that the detection rate of solitary pulmonary nodules (SPN) exceeds 30% among patients undergoing chest CT screening in the United States. 2 However, the CT imaging characteristics of GGNs lack specificity and present a complex and diverse range of etiologies. GGNs can indicate benign conditions, such as inflammation, hemorrhage, edema, and focal fibrosis, or they may suggest malignant tumors. Studies have shown that 63%-92.6% of persistent GGNs represent precancerous lesions or early adenocarcinoma.3,4
Early diagnosis and intervention for malignant tumors presenting as GGNs are crucial as they directly impact disease prognosis. However, the morphological characteristics of benign and malignant GGNs can be very similar, making accurate diagnosis extremely challenging. As lung nodule screening advances, the subsequent invasive diagnostic procedures and treatments carry inherent risks of complications. Therefore, the ability to accurately distinguish between benign and malignant GGNs is critical for assessing prognosis and selecting the optimal clinical interventions.
Radiomics is an automated, high-throughput process that extracts feature information from medical images and transforms it into quantifiable data for analysis. 5 This process comprises six steps: acquisition, preprocessing, segmentation, feature extraction, post-processing, and data analysis. 6 Feature extraction methods are categorized into “conventional” methods and deep learning-based methods. 7 Previous features can be further divided into size, shape, and texture features. 8 Previous radiomics studies have successfuly identified epidermal growth factor receptor mutations, classified histological subtypes, predicted tumor aggressiveness, and detected lymph node and distant metastases, 9 demonstrating promising results in the diagnosis of early-stage lung cancer. 10 However, current radiomics research faces limitations such as lack of standardization in image acquisition, reproducibility issues, overfitting due to excessive data, and predominantly single-center retrospective studies, lacking external validation and prospective studies to confirm stability and clinical utility.
To enhance the diagnostic capability of previous radiomics methods on GGNs, this study introduces an innovative approach in medical imaging analysis: Topological Data Analysis (TDA). 11 TDA is a tool that captures large-scale structural shape information within data and has provided significant insights in disease classification and cancer cell structure. The key method in TDA is persistent homology, 12 which constructs a sequence of complex structures parameterized by time, tracking changes in the topological features of the input data. Specifically, TDA can quantify features such as intensity heterogeneity, cavities, connected components, loops, and voids within a sequence.13,14 These changes are summarized through persistence diagrams, effectively integrating topological information into various biomedical machine learning problems. In this study, we developed new radiomic features for GGNs based on TDA technology and evaluated their practical value in the diagnosis and treatment decision-making for ground-glass nodules. Research has shown that, in CT images of lung tumors, topological features alone often outperform previous radiomic features. 15 However, combining these two types of features yields optimal performance.
This study aims to develop and validate the application value of topological radiomic features extracted from CT images in predicting the malignancy risk of GGNs. Additionally, we combine topological radiomic features with clinical parameters and previous radiomic features to create a comprehensive model, enhancing the accuracy of distinguishing between benign and malignant GGNs.
Materials and Methods
This study was approved by the Ethics Committee of the Chinese People's Liberation Army General Hospital (Ethics Certification Number: NO.S2023-206-01) and was conducted in accordance with the Helsinki Declaration (revised in 2013). The Ethics Committee waived the requirement for individual informed consent for this retrospective analysis.
Patient Selection and Grouping
Our study adheres to the TRIPOD guidelines 16 and included patients who underwent surgery for lung ground-glass nodules (GGNs) at two centers between January 2018 and June 2023. The inclusion criteria were as follows: (1) GGNs with a maximum diameter of less than 30 mm; (2) nodules confirmed by pathological diagnosis through video-assisted thoracoscopic surgery or surgical resection; (3) preoperative CT image slice thickness not exceeding 1.5 mm; (4) exclusion of patients with incomplete clinical data or unclear pathological results. Ultimately, 3223 patients meeting these criteria were included in the study. The retrospective analysis was approved by the ethics committee of our hospital, which waived the requirement for informed consent. All patient details were anonymized.
Patient information was collected from electronic medical records, including gender, age, smoking history, history of tumors other than lung cancer, family history of tumors, and other relevant clinical information. The patient data for this study were divided into three time periods and two centers: 1. From January 2018 to December 2021, data from 2592 patients were collected at the First Medical Center of the PLA General Hospital (these patients were divided into a training set and a testing set in a 75% to 25% ratio).2. Validation set 1: Data from 272 patients collected at the same center from January 2022 to December 2022.3. Validation set 2: Data from 359 patients collected at the Fourth Medical Center of the PLA General Hospital from January 2019 to June 2023.To ensure consistency, the proportion of benign and malignant lesions was maintained at the same level across all datasets. Detailed information is presented in Figure 1.

Flowchart of study population. Numbers in parentheses are the number of patients. CT, computed tomography; GGN, ground-glass nodule.
CT Image Acquisition
All patients underwent CT scans using the Brilliance iCT and Ingenuity CT scanners from Philips Healthcare, Netherlands, and the Somatom Definition scanner from Siemens Healthcare, Germany. During the scans, patients were positioned supine and instructed to breathe calmly.
The CT morphological features were initially evaluated by a radiologist (M.Z) with five years of experience and subsequently reviewed by a senior radiologist (Z.Y) with thirteen years of experience. The identified GGN features included:1. Type:Pure ground-glass nodule (pGGN) or mixed ground-glass nodule (mGGN).2. Diameter: The maximum cross-sectional diameter of the nodule.3. Edge clarity: The sharpness of the nodule's edge.4. Location: The distribution position of the nodule.5. Special signs: Features such as vacuole sign, spiculation, air bronchogram, pleural indentation sign, vascular convergence sign, and abnormal bronchial inflation. This standardized evaluation ensured the accurate and consistent assessment of GGN characteristics across all patients.
Nodule Segmentation and Feature Extraction
In the field of medical image analysis, we initially utilized segmentation masks from lung CT images to crop the lesion areas and resize them to a uniform size with a pixel spacing of 1 mm. Subsequently, we analyzed the regions of interest surrounding each nodule. The analysis involved calculating quantitative and texture features using the Pyradiomics library and topological features using the Giotto-TDA library. Quantitative features included mean CT value, size, volume, mass, surface area, surface-to-volume ratio, sphericity, uniformity, solid volume, solid percentage, mediastinal window volume, and mediastinal window percentage. Texture features totaled 225, including gray-level co-occurrence matrix (72), gray-level run length matrix (48), gray-level size zone matrix (48), gray-level dependence matrix (42), and neighboring gray tone difference matrix (15). Topological features totaled 270, including amplitude features (126), persistence entropy features (18), node features (18), and coefficient features (108). The workflow for the extraction of topological radiomic features is illustrated in Figure 2.
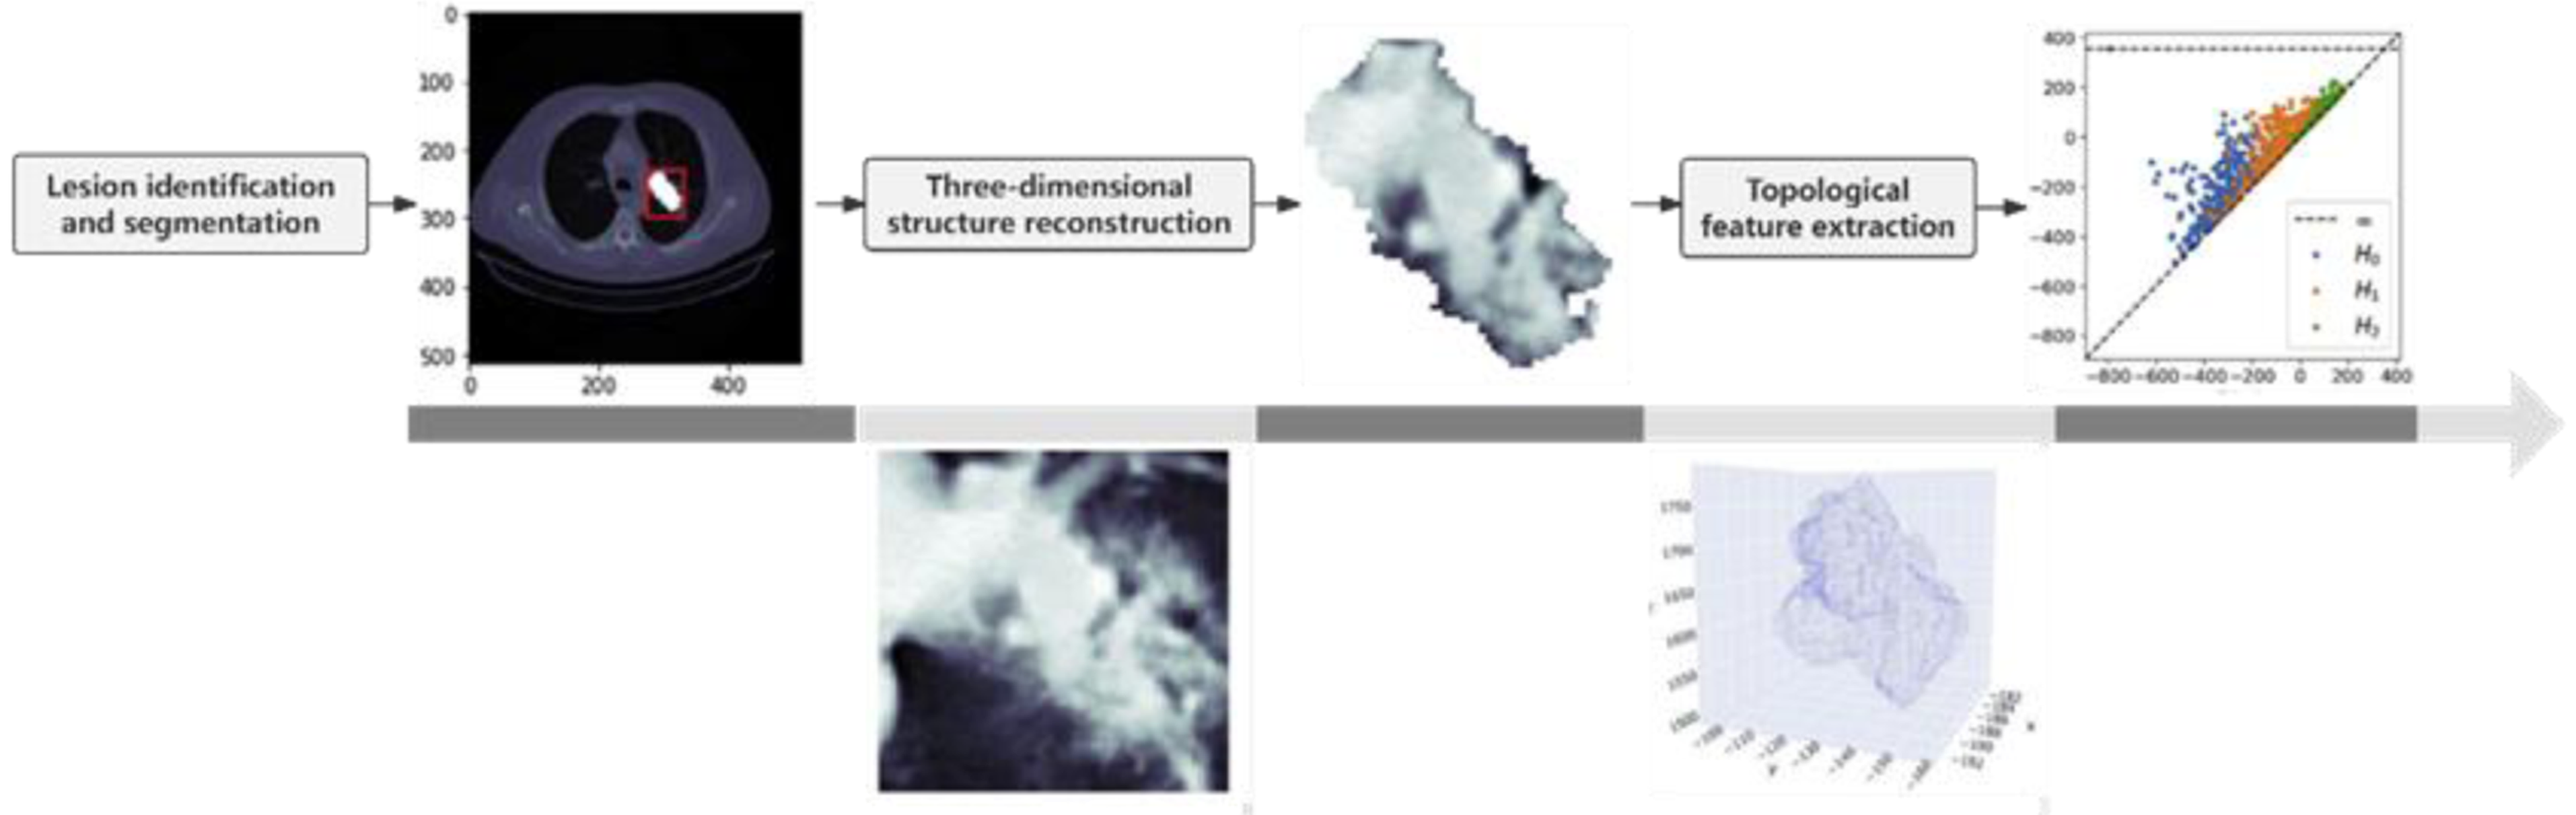
Workflow for Topological Radiomics Feature Extraction. This figure is adapted from Figure 2 in reference 15, distributed under the Creative Commons Attribution (CC BY 4.0) license.
Our diagnostic model combines clinical and quantitative information as clinomics features and uses lung CT lesion images as radiomics features. The collected patient data includes gender, age, smoking history, personal history of tumors, family history of tumors, and other relevant clinical information. Feature selection is performed using chi-square tests and analysis of variance (ANOVA) to identify features with statistically significant differences.
Establishment of Prediction Models
To mitigate the overfitting problem that can arise from high-dimensional features, we applied dimensionality reduction techniques. Radiomics features were scaled to similar ranges and reduced using Principal Component Analysis (PCA), with n-components set to 0.99 to retain 99% of the information. Using these features, we constructed multiple models, including Logistic Regression (LR), Support Vector Machine (SVM), Random Forest (RF), Extra Trees (ET), Adaptive Boosting (AdaBoost), and Decision Tree (DT).Specific Model Parameters: Logistic Regression (LR): C value of 10, maximum iterations of 2500, solver set to ‘saga’, and a tolerance of 0.0002.Support Vector Machine (SVM): Used the Radial Basis Function (RBF) kernel, regularization parameter C of 1.0, kernel coefficient gamma set to ‘scale’, tolerance of 1e-3, and unlimited maximum iterations. Extra Trees (ET): Maximum depth of 10, minimum impurity decrease of 0.0005.Random Forest (RF): 100 decision trees, maximum features set to ‘sqrt’ (square root of the number of features), no limit on maximum depth, minimum samples split of 2, minimum samples per leaf of 1, and bootstrapping enabled. Adaptive Boosting (AdaBoost): Decision Tree Classifier as the base estimator with a maximum depth of 1, 50 decision trees, and a learning rate of 1.0. Decision Tree (DT): Used ‘gini’ as the split criterion, no limit on maximum depth, minimum samples split of 2, minimum samples per leaf of 1, and no limit on maximum features. This comprehensive approach aims to balance the model's complexity and its ability to generalize well to new data. Figure 3 illustrates the study workflow.

Flowchart for developing clinical, previous radiomics, and topological radiomics models.
To address the varied performance of different models on feature analysis, we utilized a grid search method to select the best model for each feature category. Based on the results of this model selection, we identified and established the optimal model for each feature category. The entire process involved the following steps: First, randomly split the data into 75% training set and 25% test set. After training various models on the training data set, calculate the AUC value for each model on the test data set to evaluate its learning performance. To ensure the stability and reliability of the evaluation results, this evaluation process was repeated five times, and the average value was taken as the final score for each model.
Model Evaluation and Statistical Analysis
We evaluated the prediction models using Decision Curve Analysis (DCA) by calculating the net benefit at different probability thresholds to assess their clinical utility. Additionally, we constructed calibration curves to evaluate the diagnostic efficiency of the models. Statistical analyses in this study were performed using R and Python programming languages. For continuous variables following a normal distribution, we used the mean and standard deviation for description and performed t-tests for comparison. For continuous variables deviating from a normal distribution, we described them using quartiles and used rank-sum tests for comparison. Categorical variables were expressed as counts and percentages, and analyzed using chi-square tests.
We evaluated model performance using metrics such as Area Under the Curve (AUC), sensitivity, specificity, accuracy, and the Hosmer-Lemeshow test. Model performance comparisons were made using the DeLong test, with statistical significance set at P < .05.
Results
Patient Characteristics
From January 2018 to June 2023, a total of 3223 patients from two centers were included in this study, covering 3669 GGNs. Among these, 1292 were mGGNs, with 175 classified as benign and 1117 as malignant. Additionally, there were 2377 pGGNs, with 274 benign and 2103 malignant. Benign nodules included granulomas (inflammatory pseudotumor, pulmonary fungal infections), pneumonia, hamartoma, sclerosing neurocytoma, lymph nodes, and other benign tissue. Malignant nodules were primarily adenocarcinomas, but also included squamous cell carcinoma and other histological types.
In the training set, factors such as gender, smoking history, nodule location, density, lobulation sign, bubble-like sign, presence of vascular invasion, bronchus sign, margins, maximum two-dimensional diameter, size, and other characteristics showed significant differences (P < .05). In validation set 1, gender and nodule location showed significant differences between the two groups (P < .05). In validation set 2, significant differences were observed between benign and malignant GGN groups in terms of gender, age, smoking history, and lobulation sign (P < .05). Table 1 provides a comprehensive classification of the clinical and radiological characteristics of patients in the training and validation sets.
Demographic and Clinical Characteristics in the Training and Validation Sets.

Multivariate analysis identifying critical factors for distinguishing between benign and malignant GGNs in the training set.
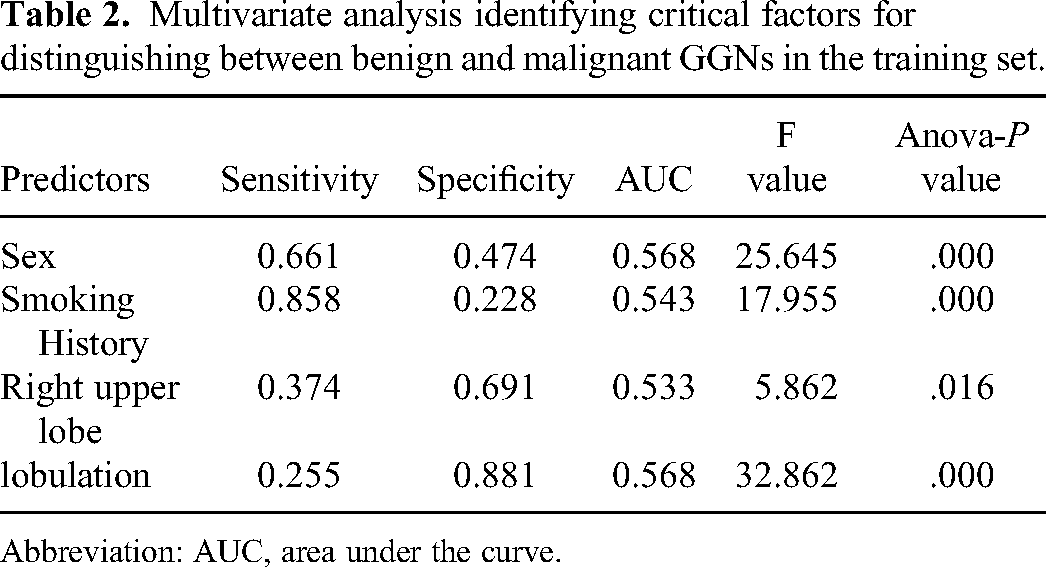
Abbreviation: AUC, area under the curve.
Feature Selection and Comparison of Different Modeling Methods
After computing the features using radiomic image analysis libraries, we performed feature selection for count and CT quantitative features using chi-square tests and variance analysis (the results are shown in Table 2). For radiomic features, we scaled them to comparable ranges and reduced their dimensionality using principal component analysis (PCA) with n-components set to 0.99. Ultimately, we selected 136 features for constructing clinical, previous radiomic, and topological radiomic models. These included 4 clinical features (gender, smoking history, nodule located in the right upper lobe, and lobulation sign), 6 CT quantitative features (size, volume, mass, surface area, surface-to-volume ratio, and mean value), and 126 previous and topological radiomic features. Based on the model selection results, we chose the optimal model for each feature category and established the corresponding models (see Figure 4).

The final score of various models on the training set. LR, Logistic Regression;SVM, Support Vector Machine; RF, Random Forest; EF, Extra Forest; AdaBoost, Adaptive Boosting; DT, Decision Tree.
We built models to predict benign and malignant GGNs using the selected clinical, previous radiomic, and topological radiomic features. To evaluate the performance of these models, we generated receiver operating characteristic (ROC) curves and identified the best-performing model (see Figure 5).

ROC curves of clinical model, previous radiomics model, topological radiomics model, and combined models were used to differentiate between benign and malignant GGNs. (A) Training cohort. (B) Validation cohort 1. (C) Validation cohort 2. ROC, Receiver Operating Characteristic; Csq-clinical; Tex-Previous radiomics; Top-Topological radiomics; Csq&Tep, combined.

This figure shows the confusion matrix of the combined model, illustrating the counts of true positives, true negatives, false positives, and false negatives. (A) Training cohort. (B) Validation cohort 1. (C) Validation cohort 2.
Comparison of Model Performance and Diagnostic Value
It is noteworthy that the combined model, incorporating clinical, previous radiomic, and topological radiomic features, demonstrated the highest diagnostic efficiency. This model achieved an AUC of 0.879 in the training set, 0.813 in validation set 1, and 0.850 in validation set 2. In comparison, the AUC values of the clinical model in validation set 1 and validation set 2 were lower than those of the topological radiomic model. In the validation sets, the topological radiomic model achieved AUC values of 0.850 and 0.862, outperforming other single-feature models.
Regarding sensitivity, the combined model showed sensitivities of 83.2% and 83.6% in validation set 1 and validation set 2, respectively, which were higher than the topological radiomic model's sensitivities of 80.7% and 82.3%. Other relevant metrics such as accuracy, positive predictive value (PPV), and F1 scores are detailed in Table 3, Table 4 and Figure 6. DeLong test results indicated significant differences in diagnostic performance between the previous radiomic model and the topological radiomic model in the training set and validation set 2 (P < .05).
Performance of Clinical Models and Radiomics Models in Training Cohort.

Performance of Clinical Models and Radiomics Models in Validation Cohort.

Table 5 compares the diagnostic performance of the combined model with other models using the DeLong test. The results of decision curve analysis (DCA) in the training cohort show that the combined model provides greater net benefit in distinguishing between benign and malignant GGNs across a threshold probability range of 10%-90%, outperforming other models (see Figure 7). Additionally, the calibration curve indicates that the combined model's predictions are well-aligned with the observed outcomes. Figure 8 presents a clinically practical case.

Decision curves and calibration curves for each model. (A, D) Training cohort. (B, E) Validation cohort 1. (C, F) Validation cohort 2. Csq-clinical; Tex-Previous radiomics; Top- Topological radiomics; Csq&Tep, combined.

A 51-year-old female patient was found to have a 16 mm ground glass nodule in the left lower lobe of the lung during a routine examination. Initially assessed as benign by clinicians, the combined model reclassified it as malignant. Subsequent surgical pathology confirmed the malignancy.
Pairwise Comparison of Area Under the Curve for Clinical and Radiomics Models in Training and Validation Cohorts.

Discussion
For a long time, clinicians have relied on qualitative morphological characteristics from CT scans to assess the nature of GGNs. These characteristics include lesion size, lobulation, spiculation, calcification, and the proportion of solid components.17,18 Liang et al 19 conducted a study involving 274 patients and found significant differences between benign and malignant lesions in terms of nodule location, density, lobulation, ground-glass opacity, presence of vascular penetration, air bronchogram sign, and maximum two-dimensional diameter. In their study, the AUC value of the combined clinical and radiomics model was 0.711 (sensitivity: 0.617, specificity: 0.816).In this study, significant differences were observed between benign and malignant lesions in terms of gender, smoking history, nodule location, density, lobulation sign, bubble sign, presence of vascular penetration, and air bronchogram sign. The AUC values of the ROC curves in the two validation sets were 0.814 and 0.637, respectively, highlighting the importance of clinical and morphological features in diagnosing GGNs. However, the value of these features may depend on the subjective judgment and perception of radiologists regarding CT characteristics. Therefore, it is difficult to accurately distinguish between benign and malignant GGNs based solely on visual morphological characteristics.20,21 This also explains why the AUC value of the clinical model in this study was lower than that of the radiomics feature model.
In this context, quantitative analysis can maximize the information extracted from diagnostic images, providing more precise lesion characteristics. To address the challenges of GGN identification, many studies have utilized CT texture quantitative analysis to evaluate GGNs. Orooji et al 22 demonstrated that a combination of shape and texture features can more effectively differentiate between nodular granulomas and lung adenocarcinomas, highlighting the importance of texture features in assessing the nature of lung nodules.23,24 Radiomics-based methods predict the malignancy of GGNs by analyzing various texture features, such as intensity histogram, absolute gradient, and nearest gray-level difference. Although these methods show great potential, their predictive accuracy still needs improvement.
In previous radiomics studies, it has been common practice to use a single machine learning method, such as logistic regression or support vector machines, to build models.9,25 This approach may limit the comprehensiveness and accuracy of the models. To overcome this limitation, our study employed six different machine learning techniques (logistic regression, support vector machines, random forests, extra trees, adaptive boosting, and decision trees) to construct models. The results showed significant differences in diagnostic performance among the different algorithms in the validation set. Relying on a single algorithm may affect the model's accuracy due to the limitations of the chosen method. Therefore, integrating multiple algorithms helps improve the predictive accuracy and reliability of the models.
In previous radiomics, texture analysis and histograms are used to quantify the intensity heterogeneity within a tumor. However, topological data analysis (TDA) quantifies intensity heterogeneity and cavities within tumors by calculating radiomic features.13,14 Unlike previous radiomics, which focuses on local structures, TDA emphasizes revealing overall structural characteristics. Its primary advantage is providing a practical tool for understanding and analyzing the spatial structure of texture components in three-dimensional images. 11 TDA has been successfully applied in various image analyses, such as prognostic detection and classification of cancer lesions in pathology or CT images, demonstrating its potential in structural analysis in oncology. 26
In TDA, persistent homology is commonly used to analyze the topological structure of imaging data through cubical complexes. As a core method of TDA, persistent homology is specifically designed to quantify the global topological structure in large datasets, 12 offering an unparalleled tool for quantifying structural information from local to global scales. It effectively differentiates between signal and noise in data 27 and uncovers information that previous radiomic features cannot capture. Persistent homology can intuitively describe the topological differences between malignant and benign tumors. Given these advantages, we tested the application of TDA techniques in radiomics analysis of GGN in this study and validated its feasibility in distinguishing between benign and malignant GGN.
Our study results indicate that topological radiomic features exhibit superior diagnostic performance in distinguishing between benign and malignant GGNs. The AUC values were 0.840 in the training set, 0.807 in validation set 1, and 0.823 in validation set 2. Compared to previous radiomics, topological radiomics demonstrated stronger diagnostic capability. Notably, the combination of topological features with clinical features significantly improved the model's diagnostic accuracy.In addition to assessing the performance of topological features in predicting the malignancy risk of GGNs, our study also provides valuable insights into the radiomic analysis of GGNs. These insights highlight areas that require further investigation, such as the performance differences between morphological features, previous radiomic features, and topological radiomic features.
Traditional diagnostic metrics, such as AUC, sensitivity, and specificity, primarily measure the diagnostic accuracy of predictive models but do not consider the clinical utility of the models. The advantage of clinical utility curves lies in their ability to incorporate patient or decision-maker preferences into the analysis. 28 Our study compared the application effects of different models in assessing the malignancy risk of GGNs through decision curve analysis (DCA). It was found that the integrated model, which combines clinical features, previous radiomic features, and topological radiomic features, demonstrated higher clinical relevance in predicting the benign or malignant nature of GGNs.
In this study, we integrated clinical features, previous radiomic features, and topological radiomic features to enhance the accuracy of our model in diagnosing malignant GGNs. Compared to models based on a single feature type, such as clinical or radiomic features alone, the integrated prediction model demonstrated significantly higher accuracy in distinguishing between benign and malignant GGNs. Furthermore, we validated the diagnostic capabilities of the developed prediction model using two datasets, including an external validation dataset. The results indicated that the integrated model exhibited high accuracy and strong generalizability across both datasets. By introducing a multiparametric prediction model, this study significantly improved the diagnostic accuracy for GGNs and provided valuable information for clinical decision-making. This advancement helps to avoid unnecessary interventions for benign GGNs, ultimately benefiting patient care.
Our study has several limitations. First, we excluded patients who were unwilling to undergo surgery or were only in the follow-up stage, leading to a reduced number of benign GGN samples, which impacted the development of survival prediction models. Second, the diagnostic effectiveness of our model may not have been fully validated due to the limited sample size and number of centers involved in the external validation set. To enhance the diagnostic effectiveness of future radiomics research, it is crucial to employ a larger sample size, utilize multicenter prospective data for validation, and incorporate a variety of deep learning methods for model construction. This approach will ensure robust model development and validation across diverse clinical settings.
Conclusion
In this study, we developed a CT image-based GGN topological radiomic feature and malignancy risk prediction model aimed at distinguishing between benign and malignant GGNs. Compared to previous radiomics, topological radiomics demonstrated higher diagnostic efficiency in differentiating benign from malignant GGNs, especially within the combined model. These models offer a non-invasive, rapid, cost-effective, and reproducible method to accurately differentiate benign from malignant GGNs, significantly enhancing the application value of radiomics in precision medicine.
Footnotes
Abbreviations
Authors’ Contributions
Liang-an Chen designed and directed the research.
Zhen Yang conducted instruction in research methods and revised the manuscript.
Miaoyu Wang developed predictive models, conducted statistical analyses, and drafted the manuscript.
Co-first authors: Yuanhui Wei performed the analysis and data organization of the topological radiomics grouping.
Minghui Zhu and Hang Yu collected the clinical data and CT images.
Chaomin Guo and Wenjia Shi has summarized the clinical features.
Jiabo Ren collected the CT images.
Zhigong Chen and Wei Zhao provided clinical data and revised the manuscript.
All authors read and approved the final manuscript.
Data Availability Statement
The source code used for data analysis and model development is available upon request. The source code used for data analysis and model development will be made publicly available at [![]() ] upon publication. This includes scripts for preprocessing, modeling, and evaluation to ensure transparency and reproducibility of our results.
] upon publication. This includes scripts for preprocessing, modeling, and evaluation to ensure transparency and reproducibility of our results.
Declaration of Conflicting Interests
The authors declared no potential conflicts of interest with respect to the research, authorship, and/or publication of this article.
Ethical Approval and Informed Consent Statements
The study was conducted in accordance with the Declaration of Helsinki and approved by the Ethics Committee of Chinese PLA General Hospital (protocol code: NO. S2023-206-01 and date of approval: Apr-26-2023). Patient consent was waived by the Ethics Committee of Chinese PLA General Hospital due to the following reasons: (1) using medical records and biological specimens obtained in previous clinical consultations; (2) The risk to the subject of the study is no greater than the minimal risk; (3)Subjects’ privacy and personally identifiable information is protected; (4) Waiving informed consent or some elements of informed consent does not affect the rights and health of the subject; (5) No further follow-up of subject information required.
Funding
This research was funded by the Beijing Capital Development Special Project for Health Research, grant number: 2020-1-5011.