
Abstract
Introduction
Abnormal tumor vasculature impairs oxygen delivery and induces hypoxia, contributing to treatment resistance and poor prognosis in non-small cell lung cancer (NSCLC). Although radiation therapy can modulate tumor vessels, its effects vary widely due to vascular heterogeneity. Therefore, a reliable and noninvasive method to quantify vascular abnormality is needed to better predict treatment outcomes.
Methods
We developed a deep learning–based imaging biomarker, the Vessel Risk Score (VRS), to quantify tumor vascular abnormality from contrast-enhanced CT scans. Trained on multi-institutional data from 126 NSCLC patients treated with hypofractionated radiotherapy, the model learned vascular morphology patterns from tumor–vessel images. Using these learned patterns, vascular heterogeneity was quantified as the distributional difference from normal vessel morphology. The generalizability of VRS was then evaluated in an external cohort of 128 early-stage NSCLC patients who underwent stereotactic body radiotherapy (SBRT).
Results
VRS showed significantly better prediction of SBRT radiation therapy response compared to vessel density. The VRS of the responder group was 0.494 (95% CI: 0.47-0.52), significantly lower than the non-responder group's 0.578 (95% CI: 0.54-0.62). Additionally, patients with high VRS showed significantly shorter PFS compared to those with low VRS (p < 0.05). In Cox multivariate analysis, VRS emerged as the only significant predictor among vessel density and other clinical variables (p < 0.05).
Conclusion
The proposed AI-derived VRS provides a noninvasive and reproducible measure of tumor vascular abnormality, offering improved prediction of radiation therapy response and prognosis compared with vessel density. This approach may extend to prognostic assessment in other cancer types where vascular morphology plays a critical role.
Introduction
Lung cancer is one of the most prevalent cancers worldwide, with non-small cell lung cancer (NSCLC) accounting for approximately 85% of all cases. Abnormal vascular structures in NSCLC disrupt oxygen and nutrient supply, induce hypoxia, and contribute to tumor growth and metastasis, thereby worsening patient prognosis and reducing radiotherapy efficacy. Unlike normal vessels, which exhibit a hierarchical structure with uniform intervals among arteries, capillaries, and veins, tumor vessels are characterized by structural heterogeneity, irregular distribution, and tortuous morphology. 1 Although vessel density 2 is the most commonly used parameter to quantify vascular abnormalities, tumor vessels are often more abundant at the tumor–host interface than in the central tumor regions and vessel density tend to decrease as the tumor grows. 3 Previous studies have attempted to predict vessel abnormalities using mathematical measurements of morphological features, such as curvature and tortuosity, or through radiomics approaches.4,5 However, these methods are limited in their ability to capture the heterogeneity and complex distribution of tumor vasculature.
Stereotactic body radiation therapy (SBRT) is an advanced technique that delivers precise, high-dose radiation to tumors and surrounding tissues while minimizing damage to normal tissue and vessels. This method is primarily used for patients with inoperable lung cancer. 6 High-dose radiation therapy can selectively destroy abnormal tumor vessels, thereby improving the tumor microenvironment 7 ‒ a key mechanism underlying its efficacy. However, SBRT outcomes vary substantially among patients; while some achieve complete local control, others experience early recurrence or insufficient tumor regression. This variability highlights the need for reliable biomarkers to predict individual treatment responses before therapy. In particular, the death of tumor vascular endothelial cells markedly influences the tumor's response to radiation therapy and plays a crucial role in inhibiting tumor growth. 8 Accordingly, studies have sought to quantify the relationship between radiation therapy and blood vessels to predict therapy responses. 9
Accurate prediction of SBRT response prior to treatment could enable personalized dose adaptation or combination with anti-angiogenic agents, thereby maximizing therapeutic efficacy while minimizing toxicity. Recent advancements in artificial intelligence (AI) have demonstrated substantial potential in the medical domain,10–14 particularly in the analysis of complex three-dimensional medical images.15–17 These technologies have shown excellent results in pattern recognition and analysis.18–21 Building on this progress, several studies have applied AI-based imaging models to patients with lung cancer undergoing radiotherapy, aiming to predict treatment outcomes and radiation-related toxicities. For instance, Feng et al (2024) developed a deep learning model integrating CT and dosiomic features in 140 SBRT-treated patients, achieving AUC of 0.920 for predicting symptomatic radiation pneumonitis. 22 Similarly, Kapoor et al (2023) employed a 3D CNN in 193 lung cancer patients, reaching AUCs of 0.84 for pneumonitis prediction. 23 Qin et al (2020) reported that combining planning CT and CBCT radiomics achieved AUCs of 0.913 for progression-free survival and 0.832 for lung toxicity in 34 patients. 24 In addition, Kim et al (2021) developed a CT-based deep learning model in 135 patients with lung cancer with treated SBRT, yielding AUCs of 0.72, 0.70, and 0.66 for predicting local recurrence-free, disease-free, and overall survival, respectively. 25 These studies collectively highlight the feasibility of leveraging AI and radiomics for individualized risk prediction in lung cancer patients receiving SBRT.
However, previous studies have mainly focused on tumor morphology, radiomic features, or dose–volume parameters, while vascular characteristics, which play a central role in radiation response, have not been fully explored. Recognizing this gap, we aimed to develop an AI-based approach that quantifies vascular abnormalities from contrast-enhanced CT images to predict SBRT response. We hypothesized that AI could serve as a powerful tool to detect abnormal vascular structures in contrast-enhanced CT images and predict SBRT response. Quantifying tumor vessel risk with AI could provide a reliable biomarker for predicting treatment response in patients undergoing SBRT.
These conventional approaches rely on predefined morphological metrics and fail to capture the spatial heterogeneity and non-linear distribution of tumor vessels in three-dimensional imaging. Therefore, a data-driven method capable of learning complex vascular patterns is required.
To test this hypothesis, we developed a two-stage AI model designed to predict SBRT prognosis by extracting and segmenting tumor vessel images from contrast-enhanced CT scans. To validate the effectiveness of our proposed AI-based method, we introduced the Vessel Risk Score (VRS) and compared its performance with conventional vessel density measurements, evaluating their respective impacts on treatment response and prognosis.
Methods
Patient Selection and Data Collection
This study included 10,534 patients with lung cancer diagnosed between 2012 and 2020 from five Korean medical institutions: AJMC (Ajou University Hospital), INHA (Inha University Hospital), CNUH (Chungnam National University Hospital), SCHMC (Soonchunhyang University Hospital) and PNUH (Pusan National University Hospital). After excluding 3639 non-NSCLC patients and 3744 patients who did not undergo surgery, radiation, or radiation therapy alone, 3151 patients who received radiation therapy were included. Of these, 1586 patients at the early stage were separated into distinct cohorts to extract their normal vessel characteristics. Normal vessel images from the contralateral lungs of these patients were used as a baseline for quantifying tumor vessel abnormalities. The study size was determined by the number of eligible patients with lung cancer who met the inclusion criteria across the five participating institutions between 2012 and 2020. No formal sample size calculation was performed, as all available cases within this period were included. This multicenter retrospective study was approved by the Institutional Review Boards of all participating institutions, including AJMC (Suwon, Republic of Korea; approval No. AJOUIRB-MDB-2022-249; approval date: June 29, 2022), CNUH(Daejeon, Republic of Korea; approval No. CNUH-IRB-2022-10-026; approval date: January 13, 2023), INHA (Incheon, Republic of Korea; approval No. INHA-IRB-2022-08-024-000; approval date: August 29, 2022), SCHMC (Cheonan, Republic of Korea; approval No. SCHCA-IRB-2022-07-034; approval date: January 13, 2023) and PNUH (Pusan, Republic of Korea; approval No. PNUH-IRB-2022-07-028; approval date: July 28, 2022). The requirement for informed consent was waived due to the retrospective nature of the study. The reporting of this prognostic model study conforms to the TRIPOD statement. 26
Among these patients, 126 who received hypofractionated radiotherapy (fewer than 10 fractions with ≥5 Gy per fraction) were selected for the training cohort. For external validation, the model's performance was evaluated using data from 128 patients with stage I NSCLC who received SBRT at AJMC and INHA. Clinical and demographic information for both the training and SBRT external validation cohorts are summarized in Table 1, and the complete cohort selection process is illustrated in Figure 1. Treatment responses in the SBRT patient group were evaluated based on the Response Evaluation Criteria in Solid Tumors (RECIST) 1.1 criteria. 27

Flow diagram of patient selection and cohort distribution. From five Korean institutions, a total of 10,534 lung cancer patients were included, and 3151 NSCLC patients receiving radiation therapy were selected for analysis. These were divided into training (n = 126), external validation (n = 128), and normal vessel (n = 1586) cohorts.
Clinical Information.

Values are presented as number or median (interquartile range).
Image Preprocessing
Contrast-enhanced CT scans were acquired before treatment initiation, with Hounsfield Unit values adjusted to a range of 0‒1000. The images were scaled to pixel values between 0 and 255 using min–max scaling. Tumor and vessel segmentation models were applied to extract the vessel and tumor regions of interest (ROI) from all contrast-enhanced CT images. Specifically, we used a combination of ConvNeXt-Small 28 and U-net 29 architectures for tumor segmentation. For cases with multiple tumors, the location corresponding to the primary cancer site was selected. Subsequently, we set the ROI to include vessels within a 20-mm radius around the tumor center based on preliminary experiments that identified this distance as optimal for predicting tumor–vessel relationships.
Tumor and Vessel Segmentation
We developed segmentation models to extract only tumor and vessel images from contrast-enhanced CT scans. For vessel segmentation, we used the lung vessel segmentation function of TotalSegmentor30,31 while tumor segmentation employed a model combining ConvNeXt-Small and U-Net, trained on the LIDC dataset. 32 A radiation oncologist (with 10 years of clinical experience) reviewed the segmentation results and verified their reliability.
Vessel Feature Extract AI Model
We developed a deep learning model to effectively extract tumor vessel features related to the prognosis of patients with NSCLC. The model combines a vision transformer (ViT) 33 and long short-term memory (LSTM), 34 adopting a 2.5D architecture that offers superior spatial representation and computational efficiency in medical imaging compared with conventional 3D CNNs.35–37 ViT has demonstrated strong capability in capturing complex spatial and textural information in medical images,37–40 making it suitable for vascular feature extraction, while LSTM, which is commonly used in medical imaging for modeling sequential data, was employed to capture inter-slice dependencies.41–43 Attention-based architectures were not adopted because they typically require large-scale datasets for stable training and are less suited to our setting. As our study aimed to investigate the intrinsic relationship between tumor–vessel features and radiotherapy outcomes, clinical variables were intentionally excluded. Although incorporating such variables could potentially improve predictive performance, it would confound the interpretation of imaging-derived prognostic value.
Specifically, each CT volume was preprocessed into consecutive 2D vessel-masked slices, which were individually fed into a pretrained ViT-B/14 encoder (DINOv2 backbone). Each slice was tokenized into non-overlapping 14 × 14 patches and projected to a 768-dimensional embedding space. The [CLS] token output from the final transformer block was used as a compact 768-dimensional representation of each slice. These sequential slice embeddings were then aggregated by a bidirectional LSTM (hidden size = 768, 2 layers) to capture spatial continuity and long-range dependencies between adjacent and distant slices. The final hidden state was passed through a fully connected layer (Dropout 0.1) to produce a continuous prognostic score representing the relative recurrence risk. This architecture effectively integrates intra-slice vascular textures captured by the ViT encoder and inter-slice structural continuity modeled by the LSTM.
Tumor Vessel Feature Learning Process
First the ViT extracts 768-dimensional feature vectors from each CT slice. Then LSTM analyzed the temporal relationships of these feature vectors, capturing the interactions between both adjacent and distant vessel structures to generate a single 768-dimensional feature vector. Finally, this feature vector passes through a fully connected layer to predict the time from radiation therapy initiation to recurrence, enabling the model to learn prognostic representations exclusively from tumor vessel images. The model was trained only on tumor vessel data to avoid introducing bias from normal vessels. Loss values were calculated using the Cox proportional hazard loss function in Pycox (version 8.2.3). 44 This process corresponds to Step 1 in Figure. 2. The training was conducted using the Adam optimizer. 45

Overview of the deep learning framework for vessel feature learning and vessel risk score calculation. Step 1 shows the vessel feature learning process using tumor vessel images, and Step 2 illustrates the VRS calculation using Mahalanobis distance.
Extraction of Tumor Vessel Features and Normal Vessel Distribution
After training the tumor vessel model, the learned feature extractor was applied to normal vessel images from the contralateral lungs of stage I–II NSCLC patients to establish a baseline distribution representing normal vascular morphology. From 1586 normal vessel images, we calculated the mean vector (
Vessel Risk Calculation
The Mahalanobis distance
46
was used to quantify tumor vessel abnormalities compared to normal vessels. This metric is widely established in deep learning research for characterizing feature deviations from a learned normal distribution
47
and has been effectively applied in medical imaging for anomaly detection tasks.
48
The distance measures how far a point deviates from a distribution in multivariate data. This method measures the normalized distances by considering the correlations between features, making it suitable for quantifying the extent to which tumor vessels deviate from the 768-dimensional normal vessel feature space. The measurement is defined by the following equation:
This distance measurement allows the quantitative assessment of each tumor vessel abnormality, which we define as the vessel risk score (VRS). The calculated Mahalanobis distance was normalized to a VRS ranging from 0 to 1 using min–max scaling for intuitive interpretation and use as a clinical biomarker. Values closer to 0 indicate similarity to normal vessels, while a score near 1 indicates stronger abnormalities. The scaling used fixed minimum and maximum values of 0 and 80 from the training dataset, respectively, enabling consistent VRS interpretation across the actual data. The described VRS extraction process is illustrated in Supplementary Figure 1 as a step-by-step flowchart.
Vessel Density Measurement
For comparison with VRS, vessel density was quantitatively assessed using three-dimensional vessel segmentation results. Vessel density was defined as the ratio of the peritumoral vessel volume to the total peritumoral volume, as commonly adopted in previous imaging-based vascular quantification studies.49,50 The peritumoral region was defined using a tumor-outlining ROI approach following the method proposed by Ma et al 51 In our study, the peritumoral ROI was defined as an expansion proportional to tumor size and was set to 20 mm from the tumor boundary to include the relevant peritumoral vascular network while maintaining consistency across patients.
Statistics and Reproducibility
We performed logistic regression analysis to evaluate the association between SBRT and clinical variables. Treatment responses were classified according to the RECIST 1.1 criteria (13), with complete response (CR), partial response (PR), and stable disease (SD) classified as responders, and progressive disease (PD) as non-responders. Survival analysis was performed using Kaplan-Meier curves to evaluate the prognostic significance of biomarkers. The differences in survival curves between groups stratified by biomarker levels were assessed using log-rank tests. Kaplan-Meier estimates were calculated for both PFS and OS, with statistical significance determined by log-rank test (p < 0.05). We assessed the impact of clinical variables on treatment response through univariate logistic regression analysis and included variables with p-values < 0.05 using multivariate logistic regression analysis to identify independent predictive factors.
Additionally, Cox proportional hazards regression analysis was performed to predict progression-free survival (PFS) and overall survival (OS). In the univariate analysis, we calculated the hazard ratios (HR) and 95% confidence intervals (CIs) for PFS for each clinical variable. The number of events in the dataset provided an events-per-variable (EPV) ratio greater than 10 for multivariate analyses, ensuring sufficient statistical power and model stability. Variables showing statistical significance (p < 0.05) in the univariate analysis were included in the multivariate Cox regression analysis to identify independent prognostic factors. To evaluate the predictive power of VRS and vessel density, we performed ROC curve analysis for nonresponse and calculated the area under the ROC curve (AUROC). Missing values were handled using complete-case analysis, excluding patients with incomplete covariate data from multivariate models. No data imputation was performed. To ensure data integrity and seamless integration with the deep learning pipeline, all statistical analyses were conducted using Python-based open-source libraries, including lifelines (version 0.27.8) and statsmodels (version 0.14.1). These libraries are widely used in clinical and medical AI research and have demonstrated consistency with results obtained from commercial statistical software in prior studies. Moreover, their open-source nature enhances transparency and reproducibility of the analyses. Accordingly, such statistical frameworks have been widely adopted in prior clinical and imaging-based AI studies.52–54 P-values < 0.05 were considered statistically significant. The detailed architectures, training configurations, and hyperparameters used for model development are summarized in Supplementary Table1.
Result
SBRT Cohort Information
Table 1 shows the information on 128 patients with NSCLC in the external validation cohort treated with SBRT (AJMC: 103 patients; INHA: 25 patients). The treatment response distribution included 4 patients with a complete response (CR), 52 with partial response (PR), 43 with stable disease (SD), and 29 with progressive disease (PD). Regarding radiation therapy, AJMC administered 12 Gy (8‒15 Gy) across 4 fractions, while INHA delivered 18 Gy (10‒20 Gy) in either 3 fractions (18 patients) or 5 fractions (7 patients). The median patient age was 78 years (range: 77‒80) at AJMC and 83 years (range: 80‒86) at INHA. Most patients were male (70.3%, 90/128). Histologically, squamous cell carcinoma was the most common type (53.9%, 69/128), followed by adenocarcinoma (45.3%, 58/128).
SBRT Response Prediction
A comparison of the VRS between responders and non-responders to SBRT revealed statistically significant differences. The responder group (CR, PR, SD) had a mean VRS of 0.494 (95% CI: 0.47‒0.52), while the non-responder group (PD) exhibited a significantly higher mean VRS of 0.578 (95% CI: 0.54‒0.62) (p < 0.0001). However, vessel density showed no significant difference between responders (mean: 0.404; 95% CI: 0.36‒0.45) and non-responders (mean: 0.428; 95% CI: 0.36‒0.50) (p = 0.3907). The results are shown in Figure 3A. Furthermore, the AUROC for VRS predicting non-response to SBRT was 0.69 (95% CI: 0.61-0.77, p = 0.0001), indicating a significant predictive power. However, vessel density had no significant AUROC value (Figure 3B).

Predictive performance of VRS versus vessel density for treatment response. (A) Box plots comparing VRS and vessel density between responder and non-responder groups. (B) ROC curve analysis of VRS and vessel density for predicting treatment non-response.
In addition to AUROC, other performance metrics such as F1-score, precision, recall, and accuracy were also evaluated to comprehensively assess classification performance. The proposed ViT + LSTM model achieved an AUROC of 0.69 (95% CI, 0.61-0.77), outperforming alternative architectures including 3D CNN (DenseNet-121: 0.58 [95% CI, 0.49-0.66]; ResNet-101: 0.56 [95% CI, 0.48-0.64]) and ResN et50 + LSTM (0.63 [95% CI, 0.55-0.71]). Among the tested ROI sizes (10, 20, 30, and 40 mm), the 20-mm ROI yielded the highest performance (0.69 [95% CI, 0.61-0.77]) compared with 10 mm (0.63 [95% CI, 0.55-0.71]), 30 mm (0.64 [95% CI, 0.55-0.72]), and 40 mm (0.62 [95% CI, 0.53-0.70]). Specifically, the proposed model achieved an F1-score of 0.61 (95% CI, 0.51-0.69), precision of 0.60 (95% CI, 0.48-0.71), recall of 0.66 (95% CI, 0.59-0.73), and accuracy of 0.63 (95% CI, 0.52-0.73). These values consistently outperformed vessel-density-based classification (F1-score: 0.46; accuracy: 0.55). Comprehensive results and ablation analyses are presented in Supplementary Table 2.
To evaluate VRS's predictive power alongside other clinical variables, we performed logistic regression analysis. Univariate analysis for treatment response (CR, PR, and SD) identified ECOG performance status (OR = 0.52, 95% CI: 0.30‒0.90, p = 0.018), smoking (OR = 0.65, 95% CI: 0.45‒0.93, p = 0.017), and VRS (OR = 0.55, 95% CI: 0.38‒0.80, p = 0.002) as significant predictive factors. In the multivariate analysis, ECOG (OR = 0.53, 95% CI: 0.30‒0.94, p = 0.03), smoking (OR = 0.64, 95% CI: 0.43‒0.94, p = 0.023), and VRS (OR = 0.57, 95% CI: 0.39‒0.85, p = 0.005) were independent predictive factors. In addition, the regression coefficients and McFadden pseudo-R2 values, showing that VRS had a regression coefficient of −0.595 in the univariate model and −0.554 in the multivariate model while maintaining a consistent negative association with treatment non-response, and that VRS exhibited the highest explanatory power (R2 = 0.06) among all univariate models whereas the overall explanatory power of the multivariate model including ECOG performance status, smoking, and VRS reached R2 = 0.132 indicating a moderate model fit, are summarized in Table 2.
Univariable and Multivariable Logistic Regression Analysis for Clinical Variables Affecting by SBRT Response.

Univariable and Multivariable Cox Analysis for PFS
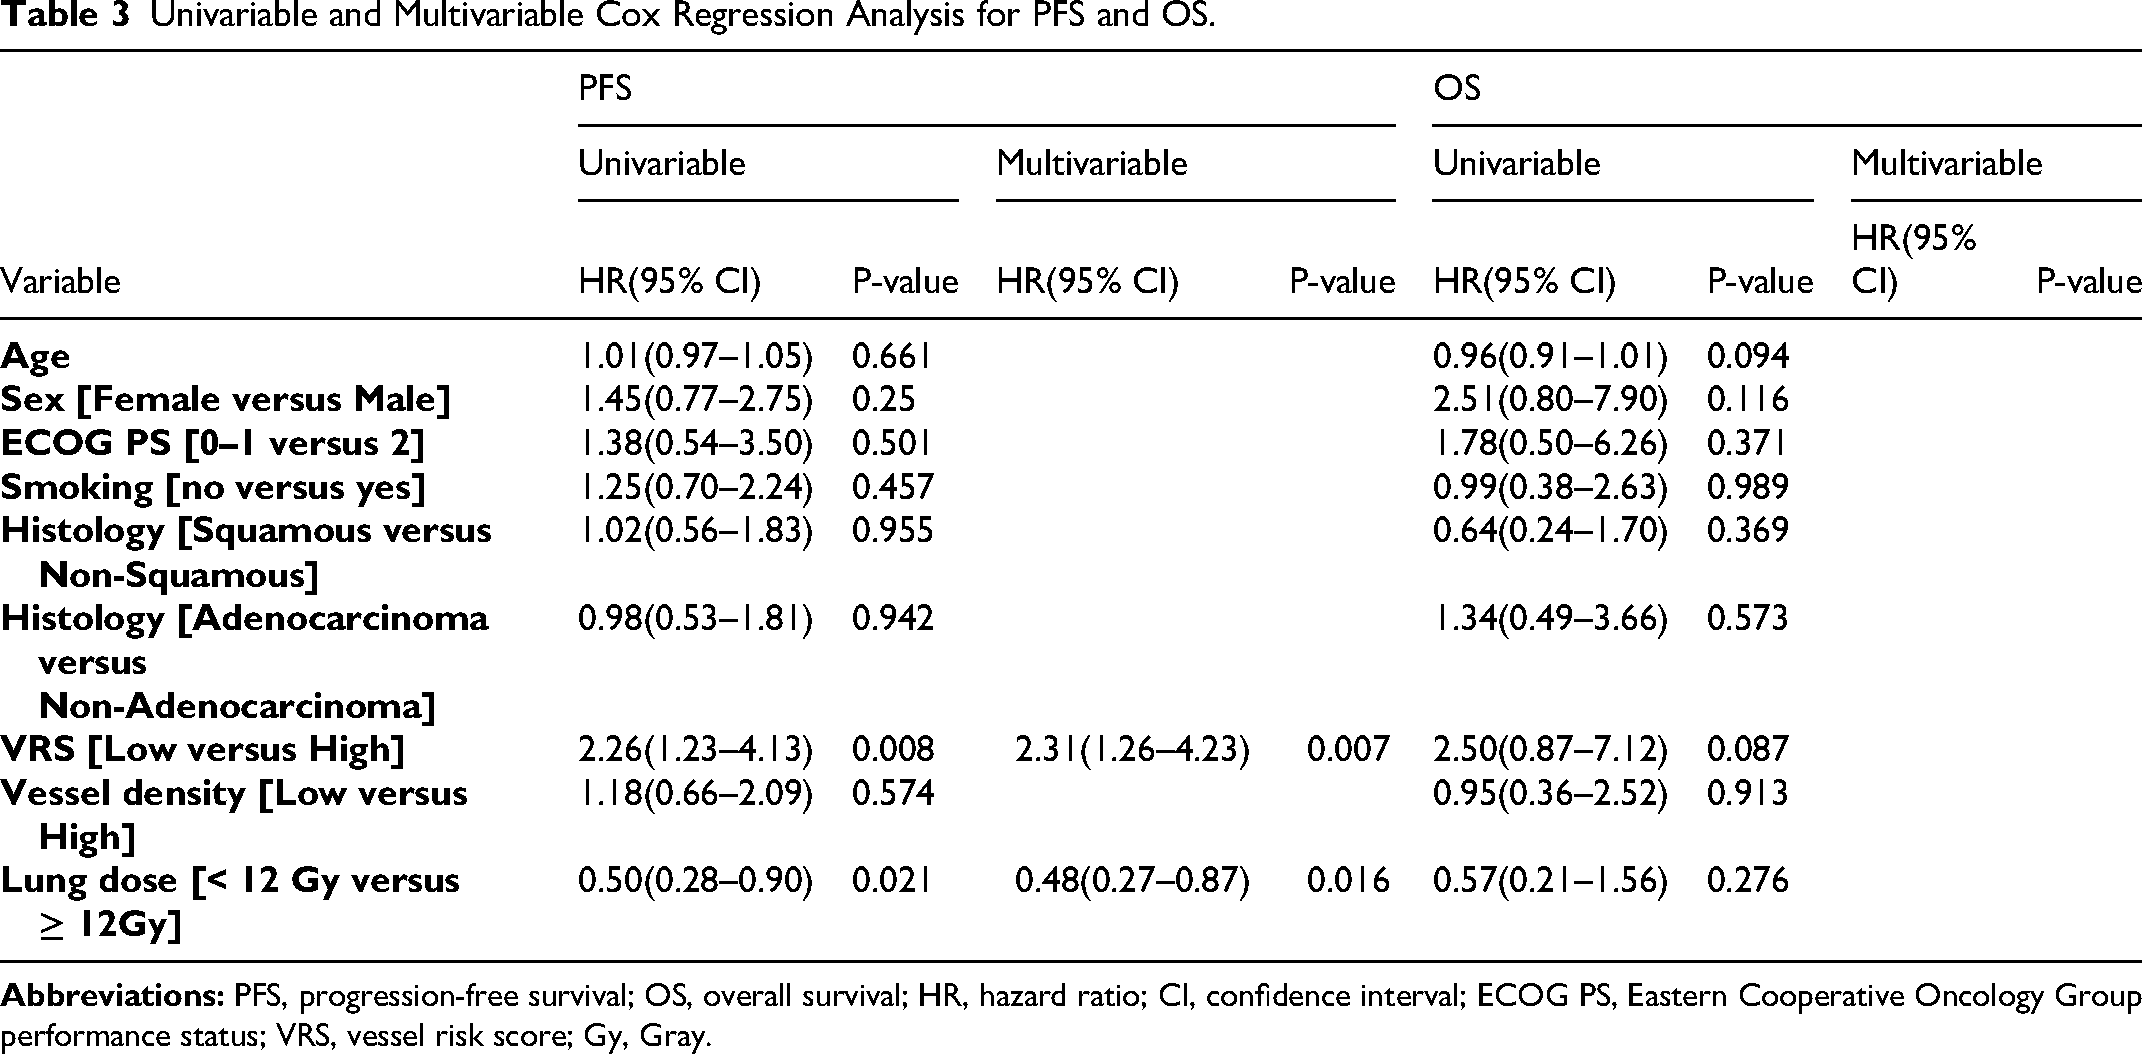
Using univariate and multivariate Cox regression analyses, we analyzed the clinical variables affecting PFS. In univariate analysis, only VRS and lung dose were significantly associated with PFS. The hazard ratio for low versus high VRS groups was 2.26 (95% CI: 1.23‒4.13, p = 0.008), while for lung dose, groups receiving ≥12 Gy showed better prognosis with HR 0.50 (95% CI: 0.28‒0.90, p = 0.021). Age, sex, ECOG PS, smoking status, histological classification, and vessel density were not significantly associated with PFS. In multivariate analysis, only VRS (HR = 2.31, 95% CI: 1.26‒4.23, p = 0.007) and lung dose (HR = 0.48, 95% CI: 0.29‒0.87, p = 0.016) remained independent prognostic factors. For OS, while not reaching statistical significance, VRS showed a trend toward association with survival outcomes in univariate analysis (HR = 2.50, 95% CI: 0.87-7.12, p = 0.087) (Table 3).
Univariable and Multivariable Cox Regression Analysis for PFS and OS.
Kaplan–Meier Curve Comparison by VRS Following SBRT
Kaplan–Meier analysis of PFS, divided by the median VRS (0.5119), demonstrated significant differences between groups. Patients with high VRS had a significantly shorter PFS (median: 20 months) compared to those with low VRS (median: >60 months) (p = 0.007). For OS, although median survival was not reached in either group (>60 months), patients with high VRS showed a trend toward worse survival compared to those with low VRS (P = 0.077) (Figure 4A). In contrast, the groups divided according to the vessel density showed no significant differences for either PFS or OS (P = 0.574 and P = 0.913, respectively) (Figure 4B).

Kaplan-Meier survival curves comparing VRS and vessel density for PFS and OS. (A) PFS analysis by VRS and vessel density groups. (B) OS analysis by VRS and vessel density groups.
Feature Extraction Visualization
To identify which image regions were most informative for feature extraction, we selected two patients with high VRS values and visualized the attention maps derived from the Vision Transformer encoder (Supplementary Figure 2). Attention map visualization is a commonly used interpretability technique for transformer-based medical imaging models, which highlights the spatial regions that the network attends to when generating feature representations. The visualization showed that the model predominantly focused on the tumor–vessel interface and adjacent vascular structures, suggesting that these regions contain key morphological cues contributing to the quantification of vascular heterogeneity in tumor vessels.
Computational Efficiency and Resource Usage
All experiments were conducted on a server equipped with an NVIDIA V100 GPU (32 GB VRAM) and a dual-socket Intel Xeon CPU (80 logical cores, 2 NUMA nodes, 64-bit architecture). For each patient, segmentation of tumor and vascular regions from contrast-enhanced CT images required approximately 89.7 s, with GPU memory usage averaging 1.34 GB. Subsequent extraction of vascular features and computation of the VRS took an average of 5.2 s per case, utilizing around 0.96 GB of GPU memory. In comparison, vessel-density calculation required only 1.3 s and relied solely on CPU resources without additional GPU usage. Overall, the VRS computation required slightly more processing time and GPU resources than vessel-density measurement, yet remained computationally feasible, taking about 2 min per patient.
Discussion
The impact of abnormal vascular structures in patients with cancer has long been the focus of attention. Tumors develop structurally irregular and new blood vessels for rapid growth, which induces hypoxia, hindering cancer treatment effectiveness and negatively affecting patient prognosis. In radiation therapy, hypoxic environments caused by abnormal vascular structures can markedly reduce treatment effectiveness, as tumor oxygen levels are critical for treatment response. In this study, we developed an AI-based biomarker, the VRS, to quantify vascular abnormalities and predict patient prognosis and radiation therapy response. VRS recognizes the complex characteristics of vascular structures from tumor vessel images extracted from CT scans and compares tumor vessel abnormalities to normal vessels.
SBRT employs high radiation doses exceeding 10 Gy per fraction, which directly kills tumor cells and destroys tumor vasculature.7,55 This approach contrasts with conventional low-dose fractionated radiation therapy, which typically uses 2–3 Gy per fraction. In SBRT, the tumor's vascular structure and characteristics play a crucial role in determining treatment efficacy. Radiation therapy with high-dose fractions (≥10 Gy) can directly kill tumor cells and simultaneously induce marked vascular injury.56,57 Prior experimental and clinical studies have shown that such high-dose irradiation can trigger acute vascular collapse and transient hypoxia, leading to increased radioresistance. 57 These rapid microenvironmental shifts can weaken the association between baseline vascular morphology and treatment response, as post-irradiation vascular remodeling may override pre-treatment structural differences. 58 In line with these mechanisms, most radiation therapy outcome models have traditionally relied on clinical or dosimetric parameters—such as tumor stage, Biologically Effective Dose, or DVH metrics—rather than imaging-derived vascular features.59–61 This context helps explain why the baseline VRS demonstrates limited discriminability in our high-dose treatment cohort: the vascular damage and swift hypoxia-driven changes after irradiation likely reduce the predictive influence of pre-treatment vascular characteristics. These insights highlight the importance of evaluating not only baseline vascular abnormalities but also treatment-induced vascular dynamics when assessing response to high-dose radiation therapy.
After emphasizing the importance of the tumor vasculature, measuring peritumoral vessel density has become the most representative method for quantifying vascular abnormalities. However, in our study, vessel density was not statistically significant in predicting prognosis or treatment response in SBRT-treated patients. This finding suggests that simple vessel density measurements fail to adequately differentiate between normal and abnormal tumor vessels, whose heterogeneous characteristics negatively affect prognosis. In contrast, our VRS demonstrated excellent predictive performance for SBRT outcomes. When patients were grouped by their median VRS, those in the high VRS group showed significantly shorter PFS compared to the low VRS group (p = 0.007). Specifically, the median PFS exceeded 60 months in the low VRS group, indicating excellent prognosis, while it was only 20 months in the high VRS group. VRS also approached significance in the OS analysis (p = 0.077) and demonstrated excellent predictive power with AUROC of 0.69 (95% CI: 0.61-0.77, p = 0.0001) as a single variable for treatment response prediction. Most patients in our cohort were elderly, which reflects the typical population receiving SBRT in real-world clinical settings. While this may limit the applicability of our findings to younger patients, it reinforces their clinical relevance for the primary SBRT population.
Several previous studies22–25 have developed AI-based models to predict radiotherapy outcomes such as radiation pneumonitis, disease progression, or survival in lung cancer patients, achieving AUCs ranging from 0.72 to 0.92. Most of these models were trained in a supervised manner using clinical or dosimetric variables as inputs. In contrast, our vessel feature–based model relied solely on vascular morphology extracted from contrast-enhanced CT without incorporating clinical or dose information, yet achieved comparable discriminative performance (AUC = 0.69). This finding indicates that vascular heterogeneity itself can serve as a strong, independent imaging-derived indicator of radiation response, highlighting the distinct originality of our approach. In this context, VRS is primarily interpreted as an imaging-based risk stratification indicator. From a methodological perspective, as it quantitatively characterizes imaging-derived biological heterogeneity, it is consistent with the definition of a quantitative imaging biomarker proposed by the Quantitative Imaging Biomarkers Alliance (QIBA). 62
These findings underscore the potential of AI as a powerful tool for analyzing complex tumor–vessel relationships and the tumor microenvironment, surpassing the capabilities of simple vessel density metrics. Unlike previous studies that individually measured tumor vessel characteristics using mathematical indicators (curvature, branching patterns, and diameter), our VRS uniquely evaluates tumor vessel abnormalities based on actual normal vessel distribution. In particular, the Mahalanobis distance ‒ an excellent statistical method for detecting outliers in multivariate data ‒ enabled us to quantify deviations from normal vascular features in a 768-dimensional feature space. This approach provides more clinically meaningful indicators by evaluating deviations from the overall normal vessel characteristics rather than simply measuring individual vessel characteristics. Our results showed that this methodological distinction led to superior performance in predicting SBRT response. Additionally, VRS emerged as an independent prognostic factor alongside lung dose in multivariate analysis (OR: 0.57; 95% CI: 0.39-0.85; p = 0.005). In this analysis, the reported R-square values correspond to McFadden's pseudo-R2, which does not represent overall predictive performance as in linear-regression R2 but rather reflects the relative contribution of variables within the logistic regression model. Consistent with this interpretation, VRS showed the highest pseudo-R2 (0.06), while vessel density (0.001) and lung dose (0.002) contributed minimally.
Limitations
This study had some limitations. First, the cohorts were separated by institution rather than randomly partitioned, because our goal was to evaluate the model in a real-world clinical scenario where SBRT-treated patients represent a distinct population. However, this design led to differences in age and clinical characteristics between the cohorts, which may introduce demographic and institutional bias. In addition, the overall sample size was relatively small and derived primarily from Korean institutions, which may limit generalizability. Second, testing was mainly conducted in patients with NSCLC and requires validation in other cancer types. Third, additional research is needed to clarify the causal relationship between tumor vascular structures and radiation therapy. Despite these limitations, our AI-based VRS has shown potential for broader applications beyond lung cancer. Hepatocellular carcinoma (HCC) is a highly vascularized tumor with a vascular structure and characteristics closely related to patient prognosis and treatment response. In HCC, tumor angiogenesis is a crucial factor that directly affects tumor growth and metastasis. Applying the VRS developed in this study to HCC could provide a quantifiable measure of vascular abnormalities, aiding in risk assessment and treatment planning.
Future research will expand to multi-center datasets and apply stratified random partitioning or prospective validation to reduce cohort-level confounding. Additionally, evaluating the predictive ability of the VRS when combined with other treatment methods is an important research topic. Further studies are needed to enhance model interpretability and facilitate integration into clinical decision-making processes. These efforts could ultimately establish VRS as a cornerstone of personalized cancer care.
Conclusions
In conclusion, the AI-based biomarker VRS developed in this study demonstrates promise beyond existing methodologies for predicting the response and prognosis of patients with NSCLC. In clinical settings, VRS can guide clinicians in designing personalized treatment plans based on more accurate prognostic predictions. VRS can help select optimal candidates for SBRT by quantifying tumor vascular abnormalities. In particular, the observation that patients with high VRS values showed lower SBRT effectiveness suggests that this indicator could serve as important evidence for treatment method decisions. Based on these results, treatment intensity can be individualized for patients with a high VRS by applying higher doses and appropriate fractionation in radiation therapy. Treatment outcomes can be maximized by combining them with additional treatment options such as immunotherapy. Additionally, VRS values can be monitored during radiation therapy to evaluate treatment response early and modify treatment plans if necessary.
While VRS provides a noninvasive imaging-based measure of vascular abnormality, its interpretation remains limited to macroscopic vascular patterns observable on CT and to lung cancer cohorts included in this study. Future research should therefore validate the VRS across diverse cancer types and broader patient populations, and evaluate its predictive ability when integrated with other treatment modalities such as immunotherapy. In addition, extending this framework to histopathologic analysis using hematoxylin and eosin (H&E) whole-slide images may offer complementary microscopic insights into tumor–vessel interactions that underlie radiation response. Further studies to enhance model interpretability and clinical integration could ultimately establish VRS as a cornerstone of personalized cancer care.
Supplemental Material
sj-docx-1-tct-10.1177_15330338261428377 - Supplemental material for Predicting Stereotactic Body Radiation Therapy Response Using an AI-Based Tumor Vessel Biomarker
Supplemental material, sj-docx-1-tct-10.1177_15330338261428377 for Predicting Stereotactic Body Radiation Therapy Response Using an AI-Based Tumor Vessel Biomarker by Jun Hyeong Park, Jun Hyeok Lim, Seonhwa Kim, Chul-Ho Kim, Seulgi You, Jeong-Seok Choi, Jae Won Chang, Dongil Park, Myung-won Lee, Sup Kim, In Young Jo, Hyung Kwon Byeon, Ki Nam Park, Byung-Joo Lee, Sung-Chan Shin, Yong-Il Cheon and Jaesung Heo in Technology in Cancer Research & Treatment
Footnotes
Acknowledgements
We sincerely thank Professor Steve Jiang at the University of Texas Southwestern Medical Center for his invaluable guidance and support during this study.
Ethical Considerations
This multicenter retrospective study was approved by the Institutional Review Boards of all participating institutions, including Ajou University Hospital (Suwon, Republic of Korea; approval No. AJOUIRB-MDB-2022-249; approval date: June 29, 2022), Chungnam National University Hospital (Daejeon, Republic of Korea; approval No. CNUH-IRB-2022-10-026; approval date: November 16, 2022), Inha University Hospital (Incheon, Republic of Korea; approval No. INHA-IRB-2022-08-024-000; approval date: August 29, 2022), Soonchunhyang University Hospital (Cheonan, Republic of Korea; approval No. SCHCA-IRB-2022-07-034; approval date: January 13 2023), and Pusan National University Hospital (Pusan, Republic of Korea; approval date: July 28, 2022).
Consent to Participate
The requirement for informed consent from all participants was waived by the IRB due to the retrospective nature of the study.
Funding
The authors disclosed receipt of the following financial support for the research, authorship, and/or publication of this article: This research was supported by grants from the Korea Health Technology R&D Project through the Korea Health Industry Development Institute (KHIDI), funded by the Ministry of Health & Welfare, Republic of Korea (Grant numbers: RS-2021-KH113822, RS-2022-KH130307). Additional funding was provided by the National Research Foundation of Korea (NRF) (Grant number: RS-2022-NR-071926) and the National R&D Program for Cancer Control through the National Cancer Center (NCC), funded by the Ministry of Health & Welfare, Republic of Korea (Grant number: RS-2025-02214710).
Declaration of Conflicting Interests
The authors declared no potential conflicts of interest with respect to the research, authorship, and/or publication of this article.
Data Availability
Supplemental Material
Supplemental material for this article is available online.
References
Supplementary Material
Please find the following supplemental material available below.
For Open Access articles published under a Creative Commons License, all supplemental material carries the same license as the article it is associated with.
For non-Open Access articles published, all supplemental material carries a non-exclusive license, and permission requests for re-use of supplemental material or any part of supplemental material shall be sent directly to the copyright owner as specified in the copyright notice associated with the article.