
Abstract
Introduction
Immunohistochemistry (IHC) plays a crucial role in breast cancer diagnosis, treatment selection, and research. However, manual scoring of IHC whole slide images (WSIs) is time-consuming and suffers from inter- and intra-observer variability.
Methods
To help address these challenges, we present and publicly release a fully automated, compartment-specific (ie, tumor and stroma) H-scoring framework for IHC analysis. The framework consists of three deep learning modules: tumor–stroma segmentation, nuclei segmentation, and H-score estimation for tumor and stroma. It processes WSIs in minutes, delivering consistent and reproducible H-scores with accuracy comparable to expert pathologists. The modular design also allows flexibility for use in other IHC tasks such as cellularity quantification, and supports configuration options to balance accuracy and computational efficiency.
Results
Fine-tuned on 87 expert-annotated patches, the framework achieved a Spearman's rank correlation (ρ) in internal validation of 0.84 (95% confidence interval [CI]: 0.77–0.89) across 100 expert-annotated WSIs, outperforming state-of-the-art (ρ = 0.78, 95% CI: 0.68–0.85) and matching the inter-observer variability between two expert pathologists (ρ = 0.84, 95% CI: 0.63–0.94). In external validation, it achieved 86% accuracy in HER2 classification (0–3+) and a mean absolute error of 21 ± 10 (range: [5–46]) in CD73 scoring, where ground truth H-scores were all 0.
Conclusion
The framework achieves agreement comparable to that of expert pathologists, underscoring its clinical utility in providing reproducible IHC scores that can reduce diagnostic variability and support consistent treatment decisions. The code is available at https://github.com/YinTuo/AutoIHC.
Introduction
Immunohistochemistry (IHC) is a widely adopted technique in pathology that enables the visualization and localization of specific proteins within tissue specimens through antigen-antibody interactions. 1 The assessment of protein expression patterns through IHC has become fundamental in the diagnosis, classification, and management of breast cancer (BC). It is routinely used to assess key predictive and prognostic biomarkers such as estrogen receptor (ER), progesterone receptor (PR), human epidermal growth factor receptor 2 (HER2), and Ki-67, which inform treatment decisions and help stratify patients for targeted therapies. Beyond these established markers, IHC is increasingly used in translational research and clinical trials to evaluate emerging biomarkers, including those related to immune response, such as PD-L1 and CD8. IHC also enables the study of tumor biology in the context of treatment resistance and response. For example, in immunotherapy trials, IHC is used not only to identify candidates for immune checkpoint blockade but also to investigate mechanisms underlying resistance or sensitivity—such as efforts to convert immunologically “cold” tumors into “hot” tumors through combination therapies. 2
To quantify protein expression, in IHC-stained slides, pathologists commonly use the (semi-)quantitative H-score, which integrates staining intensity (0–3+) and the percentage of positively stained cells in a score ranging from 0 to 300. 3 However, manual H-score evaluation is time-consuming and subject to inter- and intra-observer variability especially when analyzing whole slide images (WSIs) with heterogeneous staining patterns. 4 These limitations are further magnified in translational research and clinical trials, where multiple biomarkers can be evaluated across large patient cohorts, often at multiple timepoints such as pre- and post-treatment. As a result, scoring IHC images in this context can create a significant bottleneck. These challenges, coupled with the rising adoption of digital pathology and the growing demand for standardized biomarker assessment, underscore the need for automated H-score quantification tools, allowing pathologists to focus on higher-level diagnostic and decision-making tasks.
Recent years have witnessed rapid progress in artificial intelligence (AI)-assisted digital pathology. Convolutional neural networks (CNNs) and more recently vision transformers have achieved expert-level performance in tissue classification, segmentation, and biomarker prediction. 5 Self-supervised learning and the introduction of foundation models have further accelerated this trend by enabling training on large, diverse WSI datasets, thereby supporting a wide range of tasks across different caner types.6,7 In parallel, computational strategies have also evolved to address the scale of WSIs: lightweight frameworks now perform selective patch sampling to reduce redundancy and drastically cut computational cost, making real-time or near-real-time pathology workflows more feasible. 8 Despite these advances, automated quantification of IHC biomarkers remains a specialized challenge requiring models capable of fine-grained staining interpretation.
Over the past five years, deep learning (DL) has advanced automated H-score quantification by providing more objective and (semi-)automated solutions.9–13 Early approaches often combined DL with traditional image analysis techniques, while recent models have moved toward fully end-to-end trainable DL networks to minimize the need for human intervention. These integrated solutions perform multiple tasks within a single framework, including color deconvolution, tumor identification, nuclei detection, and staining quantification. To achieve this, a variety of architectures have been explored, including fully convolutional networks and, more recently, transformer-based foundation models. The first end-to-end solution was a fully convolutional network combining UNet and RAM-CNN, 13 followed by HscoreNet, 10 which builds on SegNet and UNet. More recently, DeepLIIF, 12 a CycleGAN-based framework, has been introduced to simultaneously perform stain deconvolution and cell segmentation/classification using co-registered IHC and multiplex immunofluorescence (mpIF) stained slides, demonstrating generalizability across a wide range of biomarkers. However, these methods primarily target single-patch images (≤512 × 512 pixels), such as tissue microarrays (TMAs) or pre-selected regions of interest (ROIs), and are not directly applicable to full WSIs. Moreover, DeepLIIF, relying on fluorescence-driven mpIF, is resource-intensive and classifies cells as positive or negative, thereby losing detailed information on tumor tissue. Another approach, EndoNet, 9 uses self-supervised learning to predict keypoints (ie, nuclei center coordinates and their epithelial/stromal classification), enabling the localization of tumor nuclei across WSIs. Nevertheless, it requires substantial effort for dataset creation due to exhaustive cell-level annotations by pathologists. On the other hand, most foundation models in digital pathology so far have been trained and applied to H&E-stained images and while transformer-based architectures perform well in classification tasks such as subtyping or grading, they generally underperform in the fine-grained segmentation required for accurate IHC quantification. 14
To address these limitations, we present and publicly release a fully automated, compartment-specific (ie, tumor and stroma) H-scoring framework for IHC analysis, built on well-established DL architectures and validated across three different biomarker stains. Distinct from existing methods, the framework required annotations for only 100 patches (6.57 mm² in total) and supports IHC scoring of both patches and full WSIs. The modular design also allows flexibility for use in other IHC tasks such as tumor–stroma segmentation and cellularity quantification, and supports configuration options to balance accuracy and computational efficiency. Processing WSIs in minutes, the framework delivers consistent and reproducible H-scores with accuracy comparable to expert pathologists. This study adheres to the STARD-AI reporting guideline for diagnostic accuracy studies using AI. 15
Materials and Methods
Overview of the Framework
Figure 1 presents the schematic diagram of the H-score quantification framework, which takes WSIs as input and directly outputs tumor cellularity and H-scores for tumor and stroma compartments. For quick expert review, the framework can also generate tumor and stroma segmentation masks along with cell and nuclei masks.

Overview of the Proposed H-Scoring Framework, Consisting of Three Modules: (1) a Tumor–Stroma Segmentation Module (TSM), (2) a Nuclei Segmentation Module (NSM), and (3) an H-Score Estimation Module (HEM). The Input to the Framework is raw IHC WSIs. After Preprocessing, Patches of H- and DAB-Stains are Extracted. TSM, NSM, and HEM are Processed Based on These Patches. TSM and NSM Take H-Stains as Input and Output Segmentation Maps and Cell Masks, Respectively. To Compute the H-Score of the Tumor Compartment, the Target Region is Defined as the Intersection of Tumor Regions in the Segmentation Maps and Cells in the Cell Masks. HEM Then Takes the Target Region and DAB-Stains as Input and Outputs Patch-Wise H-Scores, Which are Aggregated to Produce the WSI-Level H-Score—the Final Output of the Framework.
In the automated preprocessing pipeline, tissue regions are detected and large background areas (ie, whitespace) are excluded for computational efficiency. Next, non-overlapping patches (512 × 512 pixels; 235 μm × 235 μm) are extracted at 20× magnification (0.46 μm/pixel), retaining only those containing at least 1% tissue. The patch size of 512 × 512 pixels was selected to balance computational efficiency with the need to provide the DL model sufficient surrounding tissue context for accurate predictions. Subsequently, color deconvolution is applied to separate hematoxylin (H) and diaminobenzidine (DAB) stains from the IHC patches based on stain-specific RGB absorption. 16 We performed data augmentation (eg, brightness, contrast, and hue adjustments) to mitigate potential effects of variations in staining protocols and scanner settings. Following preprocessing, the framework proceeds with three DL modules: (1) a tumor–stroma segmentation module (TSM), (2) a nuclei segmentation module (NSM), and (3) an H-score estimation module (HEM). Its modular design allows for the selection of model architectures within each module, enabling users to optimize the trade-off between model performance and computational efficiency. The configuration presented in this paper represents the best-performing variant evaluated on our internal dataset. The target region, determined by the intersection of TSM and NSM results, is combined with the DAB stain as input to HEM, which predicts patch-wise scores that are subsequently aggregated to compute the final H-score for each WSI. Each module was developed and evaluated independently using a subset of the internal dataset, followed by an end-to-end evaluation of the framework on a separate subset of the internal dataset and on two external datasets covering three different protein stains (MHC-I, HER2, and CD73), as explained in more detail in the next paragraph.
Datasets
The internal dataset is a cohort of 303 core needle biopsy tissue samples from 134 luminal breast cancer patients. Biopsies were collected at baseline and after six weeks of neo-adjuvant treatment as part of a multi-institutional randomized trial. 2 These formalin-fixed paraffin-embedded (FFPE) samples underwent MHC-I IHC using the EMR8-5 clone antibody (Abcam, ab70328; 1:1000 dilution) on 4 µm sections, stained using the fully automated Ventana Benchmark ULTRA system (Ventana Medical Systems) according to the manufacturer's protocols. The MHC-I antibody exhibits membranous staining. Slides were centrally digitized using a Hamamatsu NanoZoomer S360 digital slide scanner at 40× magnification, capturing WSIs with a field of view exceeding 0.5 cm² and a pixel resolution of 0.23 μm. As depicted in Figure 2a-c, the tissues exhibit substantial morphological heterogeneity and staining intensity variability across WSIs and within individual WSIs.

Examples from the Internal Dataset (MHC-I). (a) WSIs Exhibiting Diverse DAB Staining Intensities and Heterogeneous Tissue Patterns. (b) Intra-WSI Heterogeneity, Highlighting the Variation in Staining Characteristics and Tissue Morphology. (c) Representative Patches from the TSM Training and Validation Sets, Where Each Patch was Segmented by a Pathologist into Four Tissue Regions (Tumor, Stroma, Fat/Background, Other). Images are Shown at 20× Magnification. ROI Denotes Region of Interest.
The first semi-external dataset for validation consisted of 26 WSIs acquired from tissue samples of our internal cohort, but immunostained for CD73 using the D7F9A clone antibody (Cell Signaling, 13160 T; 1:400 dilution). All other processing steps—including sectioning, fixation, staining platform, and scanning—remained consistent with those used for the internal dataset. The second external dataset was the publicly available HER2 dataset from the HER2 scoring contest, 17 consisting of 80 WSIs, with 52 WSIs for training and 28 WSIs for testing.
Annotation Description
To develop and fine-tune the framework, 149 image patches (512 × 512 pixels; 235 μm × 235 μm) were manually selected from 22 WSIs in the internal dataset and annotated by an expert (pathologist 1) following a predefined protocol: Class 1 (Tumor) – tumor regions only; Class 2 (Stroma) – this includes extracellular matrix, fibroblasts, as well as any independent cells or tiny crushed structures that would not be easy to discern as DAB stain with the naked eye, such as macrophages, lymphocytes, small vessels, and nerves; Class 3 (Fat/Background) – fat tissue and background have been separated from other classes because they mainly consist of white spaces; Class 4 (Other) – any discernible structures visible to the naked eye not classified as tumor, stroma, or fat. These includes artifacts, normal breast glands, benign changes in breast glands, large vessels, and nerves. For ground truth cell and nuclei segmentation, a semi-automated approach was adopted using QuPath with carefully optimized parameters as recommended by the pathologist 18 (see Supplementary Figure 2 for reliability and examples). The 149 annotated patches were subsequently split into a training and validation set (80%) and a test set (20%) to evaluate the performance of the individual modules.
To evaluate the performance of the entire framework, two expert pathologists independently provided the tumor H-score for a set of WSIs in the internal dataset that were not part of the datasets used for tumor–stroma segmentation, nuclei segmentation, or H-score estimation: pathologist 2 assessed 100 WSIs (from 50 patients, each with one biopsy collected at baseline and another at week 6), while pathologist 1 assessed a subset of 20 WSIs (from 10 patients, each with one biopsy collected at baseline and another at week 6) for interobserver variability analysis. For external validation, pathologist 2 provided the H-scores of all 26 WSIs in the first semi-external dataset. In the second external dataset, we used HER2 scores for 28 WSIs from the publicly available HER2 test set, which were annotated by at least two expert pathologists as described in the challenge description. 17
Framework Development and Evaluation
Target Region Identification
For tumor–stroma segmentation, an encoder was used for feature extraction, followed by a segmentation head. We propose a transfer learning-based segmentation model, termed MoCo segmentation model (MoCo-SM). As shown in Figure 1, MoCo-SM leverages a ResNet50 backbone pre-trained with MoCo v2, 19 a momentum contrast-driven self-supervised learning method, for tissue segmentation. MoCo-SM repurposes representations learned through contrastive learning by extracting the encoder network and appending a lightweight segmentation head consisting of a 1 × 1 convolutional layer and bilinear upsampling to transform high-dimensional feature maps (2048 channels) into pixel-wise four-class predictions. A detailed explanation of MoCo-SM is provided in Supplementary Section 1.1.
For nuclei segmentation, we used a customized Triple UNet, 20 where features are extracted from both the IHC patches and their H stains separately, each enhanced by a progressive dense feature aggregation (PDFA) module. The modality-specific outputs are then fused and passed through a third UNet that produces the final segmentation. A detailed explanation is provided in Supplementary Section 1.2. In post-processing, we generate cell masks by expanding each nucleus by 4 μm through morphological opening.
Additional technical details on the model architectures and training scheme can be found in Section 1 and 2 of the Supplemental Material, respectively. To evaluate the tumor–stroma segmentation performance, we assessed intersection over union (IoU), Dice coefficient, recall, and specificity for tumor and stroma classes separately. The metrics used to evaluate the nuclei segmentation performance include Dice coefficient, IoU, and accuracy. All evaluation metrics were computed in the internal test set on a pixel-wise basis
H-Score Quantification
We aim to quantify the H-score for the tumor (

Given the computational constraints of DL models in processing entire WSIs, it is not feasible to compute the H-score of WSIs directly by Eq. (1). To aggregate the patch-wise H-scores, we derived the following relationship between the H-score of a WSI and the H-scores of its constituent k patches in the tumor compartment:

In the framework, the user can either apply the above formulas to quantify the H-score, or use a DL component—VGG16Regression or StainIntensityNet (described in Supplementary Sections 1.3 and 1.4, respectively)—pre-trained on the ground truth H-scores calculated for the training set. StainIntensityNet is a lightweight architecture modified from RAM-CNN,
13
with its model architecture illustrated in Supplementary Figure 4. We anticipate that VGG16Regression can outperform StainIntensityNet since it retains the full pretrained feature extractor, providing richer hierarchical representations that enable more accurate regression of continuous H-scores. In contrast, StainIntensityNet is highly efficient with only 0.1 million parameters compared to VGG16Regression's 15 million, its smaller capacity limits feature representation compared to VGG16Regression. By default, the framework employs VGG16Regression due to its slightly superior performance (see Section 3.2); however, StainIntensityNet is also included in the code for users prioritizing computational efficiency. The DL component enables zero-shot inference, providing a computationally efficient alternative to pixel-level intensity analysis compared to the formula-based approach, while also enhancing the overall integration of the framework. Additional technical details on the model architectures and training scheme of the DL component can be found in Section 1 of the Supplemental Material. The DL-based H-score quantification performance was evaluated using mean percentage error (MPE), chosen for its scale independence and interpretability. To assess inter-model differences in estimated
End-to-end Evaluation
After excluding the WSIs where H-scores were not applicable (ie, WSIs without tumor), Spearman's rank correlation coefficient (Spearman's ρ) was calculated with a 95% confidence interval (CI) for: (1) framework versus individual pathologists’ scores, (2) framework versus mean pathologist scores, and (3) inter-pathologist scores comparisons. For the CD73 external test set, ground truth H-scores provided by pathologist 2 were 0 for all 26 WSIs. Performance of the framework was subsequently quantified using the mean absolute error. Testing on the HER2 dataset involved transforming the predicted H-scores by our framework (range 0–300) to the HER2 scoring system (4-class: 0/1+/2+/3+) using the available training data and the provided percentage of cells with complete membrane staining (PCMS) as prior information, as this parameter is not incorporated in the H-score formula which our framework aims to mimic.
Results
Target Region Identification
The performance of our tumor–stroma segmentation model (MoCo-SM) was evaluated against four prevalent CNN-based segmentation models—MobileNetV3, 22 UNet, 23 UNet++, 24 and DeepLabV3+ 25 —with their final layers modified to accommodate our four-class segmentation task. Given the widespread interest in foundation models, we also evaluated CONCH-SM, which utilizes CONCH 26 —one of the latest histopathology-specific foundation models trained on over one million images, including IHC slides—to extract image embeddings that are subsequently processed by a segmentation head functioning as a decoder. All CNN-based models were pre-trained on ImageNet and further fully fine-tuned on the TSM training set. For CONCH-SM, only the segmentation head was trained, aligning with CONCH's original design for zero-shot inference. As shown in Figure 3, the predictions of CONCH-SM—a substantially larger model with 400 million parameters—exhibited a marked discrepancy from the ground truth. Among the CNN-based models, all models performed similarly, achieving a mean [range] IoU of 0.65 [0.63–0.66], a Dice coefficient of 0.78 [0.77–0.79], a sensitivity of 0.77 [0.75–0.78], and a specificity of 0.94 [0.94–0.95] for the tumor class, with the exception of the smallest model, MobileNetV3. MoCo-SM demonstrated a non-significant improvement over UNet, UNet++, and DeepLabV3, while having the least number of parameters among the four models.

Performance of TSM Using MoCo-SM, MobileNetV3, UNet++, UNet, DeepLabV3+, and CONCH-SM on the Internal Test Set (MHC-I). (a) IoU, Dice Coefficient, Sensitivity, and Specificity for Tumor and Stroma Across various CNN-Based Models. (b) Example Segmentation Results from the Test Set, Compared with Manual Annotations by the Pathologist.
For nuclei segmentation, we compared Triple UNet with a foundation model, segment anything model (SAM), 27 and two other well-established segmentation models—HoverNet 28 and UNet. 23 Triple UNet and HoverNet were trained from scratch, while UNet was fully fine-tuned from ImageNet-pretrained weights; for SAM, only the pretrained vision encoder was employed—excluding the prompt encoder and mask decoder due to the absence of points or bounding boxes—and the entire model, including the vision encoder followed by a segmentation head, was fully fine-tuned for our specific task. Triple UNet, HoverNet, and UNet outperformed SAM on the test set. Triple UNet achieved approximately 3% higher Dice coefficient and IoU values and a 1% higher pixel accuracy compared to HoverNet and UNet, although these improvements were not readily apparent in qualitative results, as shown in Supplementary Figure 3.
H-Score Quantification
We compared our proposed StainIntensityNet against RAM-CNN, which was adapted from the original RAM-CNN architecture to accept a single input, and ResNetRegression, adapted from the pretrained ResNet18 29 architecture in the same manner as VGG16Regression.
As shown in Figure 4, VGG16Regression and StainIntensityNet outperformed RAM-CNN and ResNetRegression in terms of MPE, with no statistically significant differences overall between their estimated

Distribution of MPE for
Framework
We evaluated H-scores of WSIs by comparing our proposed framework and a state-of-the-art (SOTA) H-score quantification approach 11 against pathologists’ assessments. It is important to note that the existing advanced quantification methods such as Ref. 13, HscoreNet, 10 and DeepLIIF 12 were excluded from benchmarking because they are not compatible with our objective of tumor H-score estimation on WSIs. These methods are either limited to TMAs or focus on segmenting positively stained cells without differentiating between tumor and stroma regions. In the internal end-to-end test set, as shown in Table 1, Spearman's ρ was 0.84 (95% CI: 0.63–0.94) between the two pathologists and 0.84 (95% CI: 0.77–0.89) between our framework and the mean of the pathologists’ scores on a set of 94 WSIs (6 out of the 100 WSIs did not contain tumor). In comparison, the SOTA method achieved a Spearman's ρ of 0.78 (95% CI: 0.68–0.85). Interestingly, the H-scores estimated by our framework closely aligned with those of pathologist 1, with a Spearman's ρ of 0.98 (95% CI: 0.94–0.99) (Figure 5). We attribute this strong agreement to the fact that the ground truth annotations in the training set were performed by the same pathologist (F.L.). Figure 6 provides an intuitive comparison of H-scores assessed by pathologists versus those calculated by the framework, showing that the framework-computed scores follow the same trend as the pathologists’ assessments. Moreover, when examining H-score differences between week 6 and baseline for each patient, the concordance in positivity or negativity (ie, whether the red dot and black triangle fall on the same side) was approximately 80% between the pathologists’ assessments and the framework's computations.

Comparison of H-Scores (a) and H-Score Rankings (b) of WSIs from the Internal Test Set (MHC-I) as Assessed by two Pathologists and Estimated by the Proposed Framework (Green) and a State-of-the-art (SOTA) Method (Blue).

H-Scores of 88 WSIs from 44 Patients (Each with one Biopsy Collected at Baseline and Another at Week 6), Assessed by Pathologists (Left) and Calculated by the Framework (Right), in the Internal Dataset. Six Patients Were Excluded Because Their WSIs Contained no Tumor. Light and Dark Green Represent H-Scores of WSIs at Baseline and Week 6 Assessed by the Pathologist, Respectively. Light and Dark Blue Represent H-Scores of WSIs at Baseline and Week 6 Calculated by the Framework, Respectively. Diff Denotes the H-Score Difference (Week 6 – Baseline), Where Red Dots and Black Triangles Indicate Differences in H-Scores Assessed by the Pathologists and Calculated by the Framework, Respectively.
Spearman's Rank Correlation Analysis Comparing Different H-Score Evaluation Methods on the Internal Test Set (MHC-I), Showing Spearman's ρ, p-Values, and 95% CIs Calculated via Fisher's Z-Transformation.

1: our proposed framework.
2: state-of-the-art H-score quantification method.
3: H-score evaluated by pathologist 1.
4: H-score evaluated by pathologist 2.
5: average H-score evaluated by pathologist 1 and 2.
In the CD73 external test set where the pathologist scored all 26 WSIs with an H-score of 0, the framework estimated consistently low but variable CD73 expression, with a mean [range] H-score of 21 ± 10 [5–46] and a 95% CI of 18–25, estimated via bootstrap resampling.
For the 28 WSIs in the HER2 test set, the framework predicted the 4-class HER2 score (0/1+/2+/3+) using prior PCMS information with an overall accuracy of 86% and a Cohen's kappa of 0.81. From qualitative assessment, as shown in Figure 7, the pre-transformed H-score (0–300) estimated by our framework effectively reflects the staining prevalence and intensity.
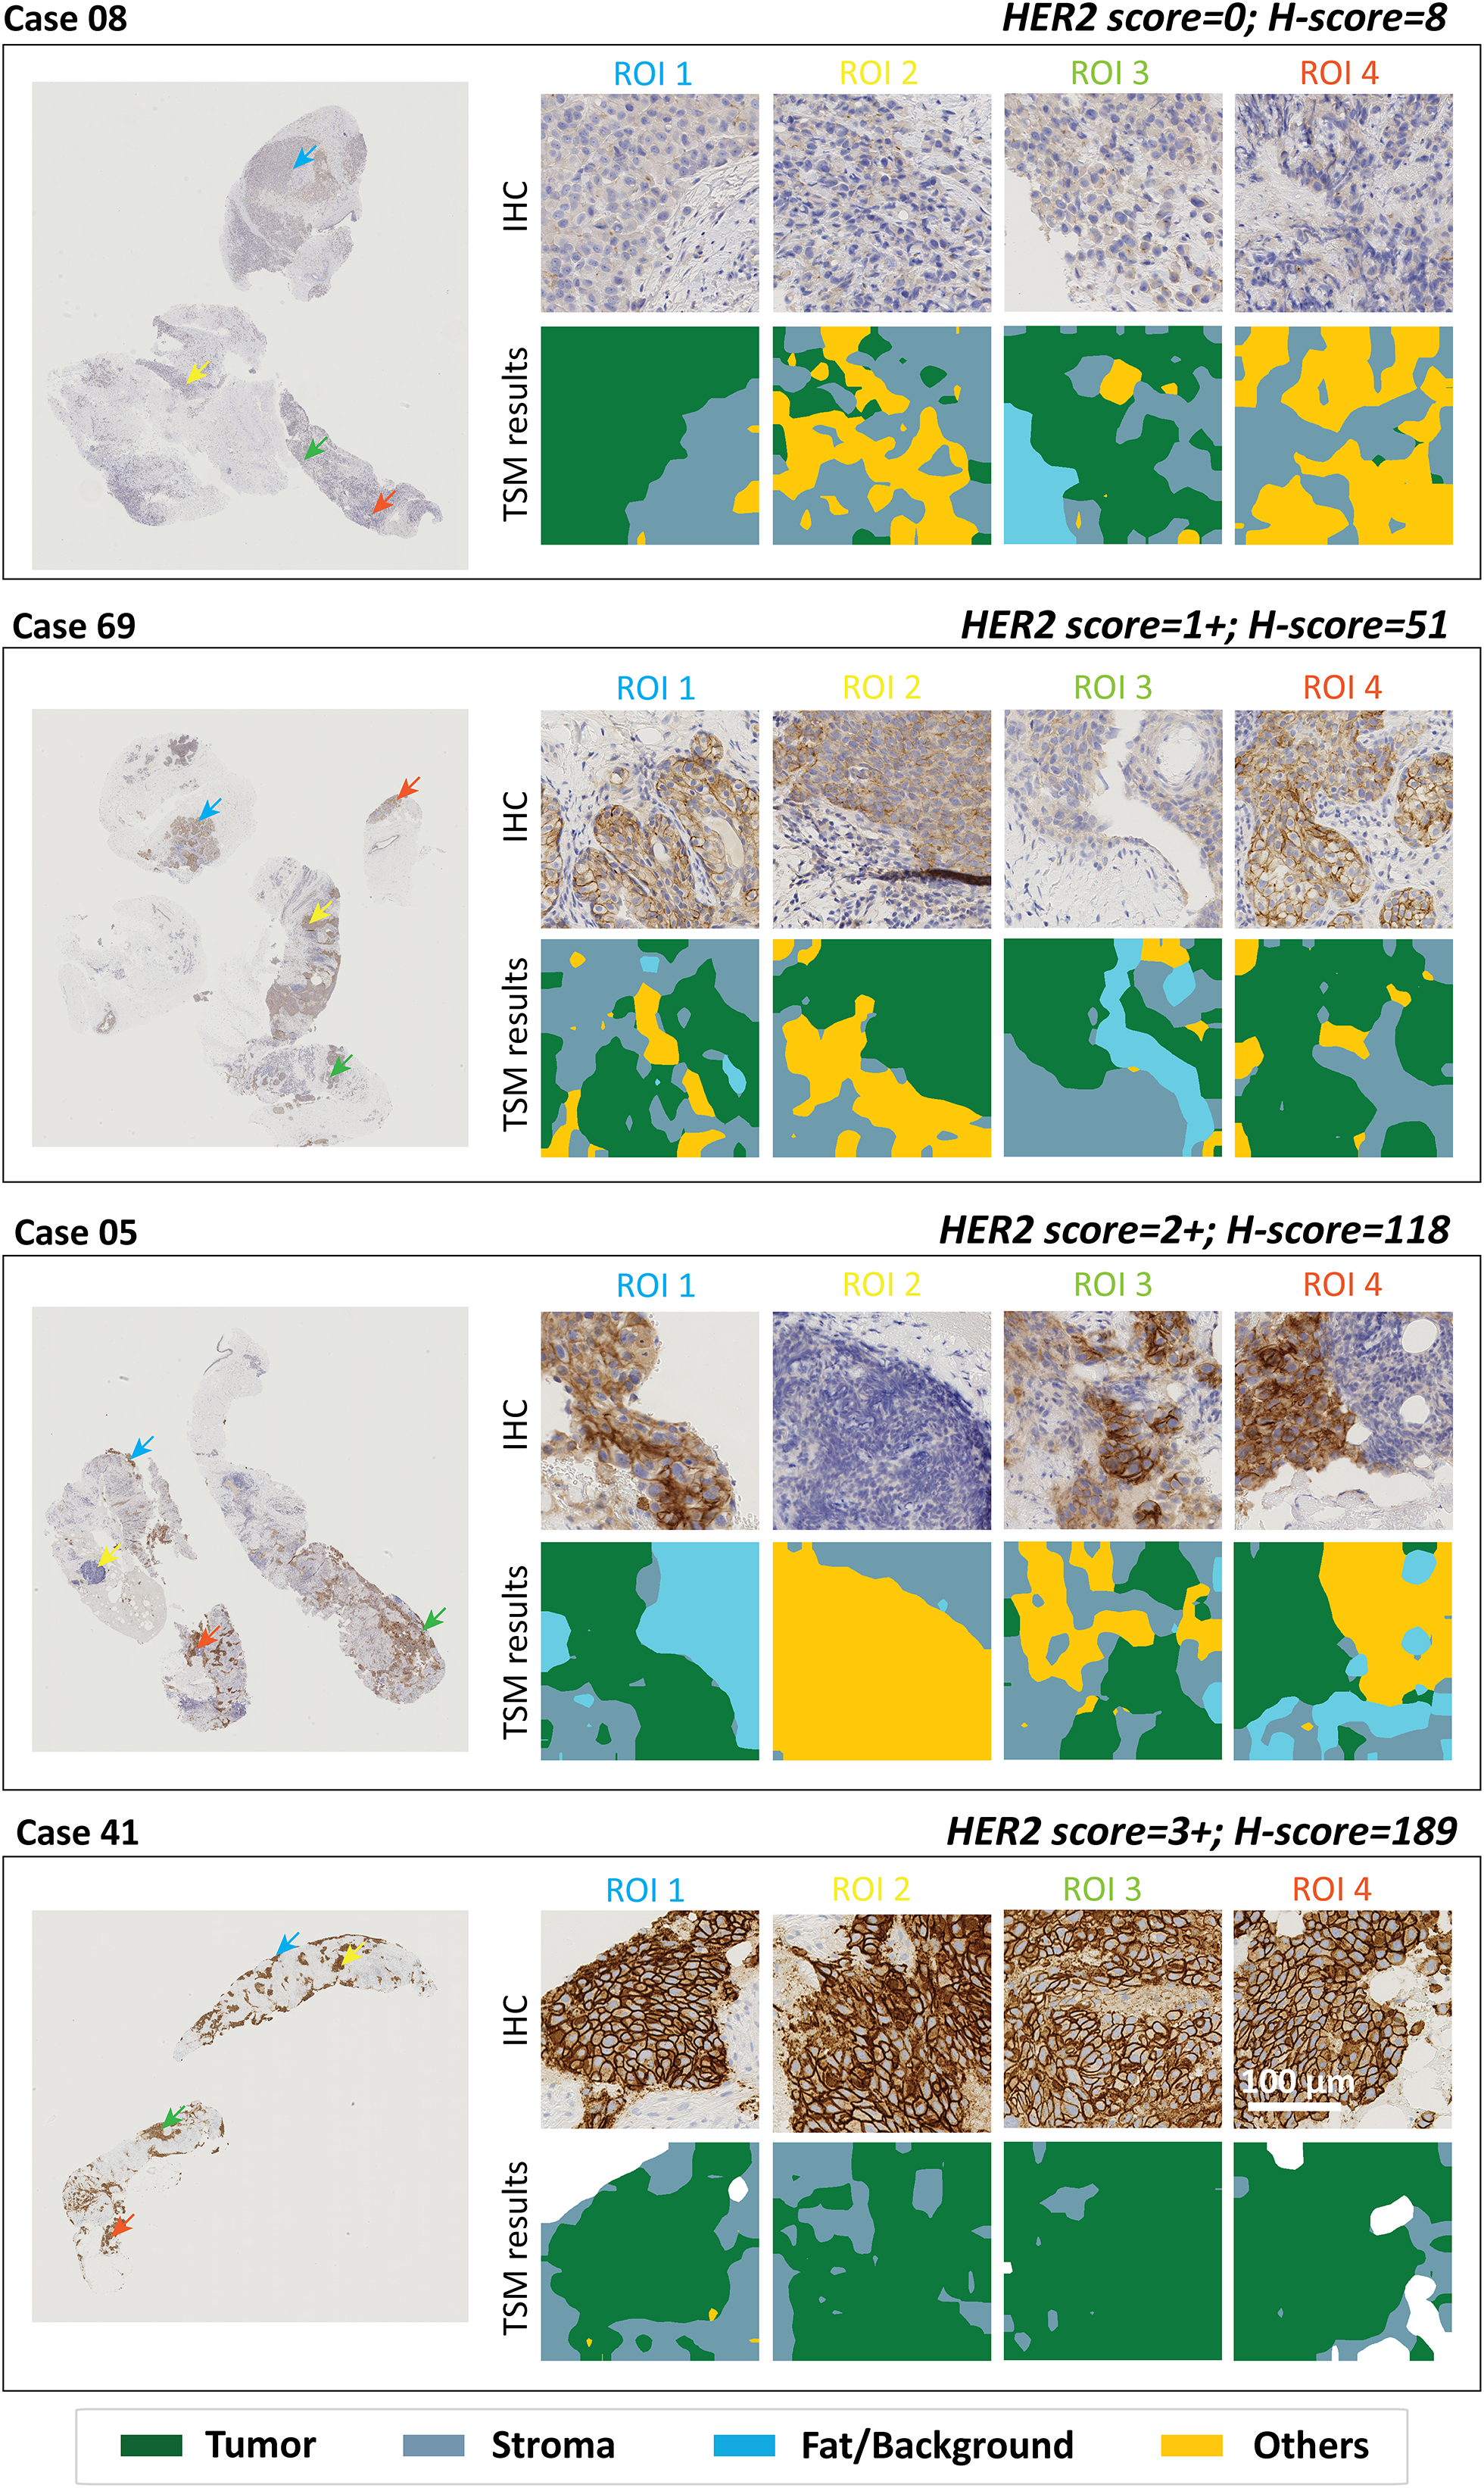
Representative WSI Examples from the External HER2 Test Set (Public Dataset) Showing (Left) Original IHC WSIs and (Right) Selected ROIs with TSM Results. The HER2 Score and H-Score Indicated at the Top Right of Each Case Correspond to the Ground-Truth HER2 Score Provided by Pathologists and the H-Score Calculated by the Framework, Respectively. From Top to Bottom of the Four Cases, Tumor DAB Staining Intensity Increases, Corresponding to HER2 Classes 0 to 3 + . Consistently, the H-Scores Calculated by the Framework Increase, Demonstrating its Ability to Capture Staining Variations in HER2 WSIs.
Discussion
The clinical significance of the Spearman's correlation of 0.84 (95% CI: 0.77–0.89) between our framework and expert pathologists’ scoring on the internal dataset is in alignment with inter-observer variability among pathologists (ρ = 0.84, 95% CI: 0.63–0.94), with ρ ≥ 0.81 considered indicative of excellent agreement for clinical validation. 30 This suggests that the framework approaches the practical ceiling for H-scoring accuracy in histopathological assessment and could serve as a reliable diagnostic aid to improve consistency and efficiency in pathological assessments. Moreover, the exceptional correlation with pathologist 1 (ρ = 0.98, 95% CI: 0.94–0.99) indicates that the framework could serve as a reliable second opinion; however, it is important to note that the training annotations were provided by the same pathologist, the high correlation may reflect annotation bias in addition to consistency. On the external HER2 test set, the achievement of a Cohen's kappa of 0.81, compared with a previously reported kappa of 0.69 between three pathologists on a set of 500 breast cancer samples, 31 indicates that the framework has the potential to mimic pathologists’ scoring of HER2 status.
Our key contribution lies in developing a TSM that reflects the tumor annotations made by an expert pathologist—an aspect that has been reported as a major challenge in IHC scoring using the digital image analysis (DIA) platform. 32 Building upon the TSM, we introduce a computationally efficient approach capable of processing a giga-pixel WSI in approximately 2 min under our computational settings (detailed in Supplementary Section 2) for addressing the complexities of H-score quantification. The time breakdown for each module is as follows: preprocessing, 1 minute; tumor–stroma segmentation, 7 seconds; nuclei segmentation, 26 seconds; and H-score estimation, 3 seconds. Notably, the framework requires 119 weakly annotated patches labeled by the pathologist for training, substantially reducing annotation efforts compared to the SOTA method, which requires pixel-level annotations across three times the tissue area. To mitigate potential limitations in generalizability, we employed DL models extensively pretrained on public datasets and augmented the training data by 67%. Considering interobserver variability, the results demonstrate that the framework can estimate H-scores across both internal and external datasets within a reasonable margin of error.
During implementation, we observed that the TSM is a critical component of the framework for reliable H-score estimation of WSIs. Although noise in manual annotations introduced by coarse labeling likely limits the segmentation performance—evidenced by the similar performance across different model architectures—this trade-off significantly reduced the time required by the pathologist to generate ground truth tissue segmentation maps. Among the four classes, the “others” class, which encompasses the most diverse tissue morphologies is the least represented, poses the greatest challenge, as illustrated in Figures 3b and 7. To enhance robustness in segmentation performance, weakly supervised learning strategies could be incorporated, for instance, estimating a noise matrix to account for uncertainties in potentially inaccurate annotations and integrating this information into the learning process. 33 Additionally, we explored segmentation using foundation models such as CONCH 26 and SAM, 27 with results shown in Figure 3b and Supplementary Figure 3, respectively. The significantly larger model size of CONCH (with around ten times more parameters than a standard UNet) make full fine-tuning computationally intensive, whereas partial fine-tuning fails to achieve performance comparable to CNNs. Although the smaller model size of SAM allows full fine-tuning, its performance remained suboptimal, likely due to the absence of prompts (which are typically not available in clinical practice) for guiding the model's predictions. These observations underscore the need to further explore the adaptation of foundation models for annotation-intensive tasks, including segmentation (pixel-level tissue-class labeling) and detection (bounding boxes with class labeling), rather than limiting their use to classification (image-level labeling) as reported in Refs. 7 and 6.
Even though the performant TSM provided a robust target region identification, IHC scoring remains challenging due to the absence of an absolute ground truth, which stems from four key sources of ambiguity: (1) Target region identification, in which interobserver variability among pathologists, tissue heterogeneity, and, for certain biomarkers, the overpowering effect of strong DAB stain on cellular morphology, all hinder segmentation accuracy; (2) Stain categorization, which ultimately relies on pathologist discretion despite existing guidelines, leads to empirically defined boundaries between categories rather than strictly standardized thresholds4,34,35—this is evident in Figure 5, where the H-scores for 100 WSIs evaluated by Pathologist 2 show clustering at discrete levels rather than a continuous range, indicating the challenge of discerning subtle staining intensity variations across entire WSIs with the human eye; (3) Scoring criteria variability, such as careful counting versus quick visual estimation or evaluation based on a hotspot versus the entire image; and (4) Differences in scoring systems, such as HER2 score, H-score, Allred score, percentage of immunopositive cells (%Pos), and weighted scoring (eg, optical density × %Pos), pose a hurdle for our external validation, where prior information (ie, PCMS) is required to estimate the HER2 score from H-scores. In our study, stroma H-score assessment proved difficult for both pathologists due to (1) strong DAB staining that obscured cellular morphology and (2) inherent uncertainties in defining stromal cell scoring criteria (eg, regarding the inclusion of lymphocyte subsets versus broader stromal populations). Given these limitations in stroma compartment evaluation, we focused our quantitative analysis of the framework exclusively on tumor H-scores. To reduce discrepancies, the establishment of a consensus within the pathology community could significantly advance the clinical utility of IHC scores and foster the development of robust DIA algorithms for automated scoring.
Although the framework mitigates scoring ambiguities through automatic pixel-wise H-score calculation, this study has certain limitations. The framework tends to overestimate H-scores when the ground-truth H-score is zero or when no tumor is present—often corresponding to cases where TSM results indicate that the tumor comprises less than 10% of the tissue. These discrepancies likely stem from two factors: first, imperfections in tumor–stroma segmentation, as TSM struggles to distinguish tumor from gland and vice versa. As illustrated in Figure 8, this is a challenge that even pathologists face when evaluating isolated patches, suggesting that incorporating global contextual features could improve TSM performance; second, the absence of a pre-selection step, as H-scores are typically assessed only when tumor regions occupy more than 15% of the tissue section.11,13 Examples of H-score overestimation on the internal MHC-I-stained WSIs and the external CD73-stained WSIs are shown in Supplementary Figures 5 and 6, with predicted tumor regions overlaid in green on ROIs selected from each WSI. In all four examples shown in Supplementary Figures 5 and 6, tumor tissue constitutes less than 10% of the sampled area, making the framework particularly sensitive to the accuracy of cell segmentation. As indicated by the red arrows, strong DAB staining is present within these tumor regions. Because the NSM relies on the H stain—and the H component generated through color deconvolution can be imperfect in regions with intense DAB signal—areas with strong DAB staining may be erroneously segmented as nuclei. Consequently, the predicted tumor cell region may include non-tumor areas exhibiting high DAB intensity. This leads to overestimation of the final H-score, such that the computed values (23 and 55 in Supplementary Figure 5; 30 and 15 in Supplementary Figure 6) exceed the true H-scores (0 and 10 in Supplementary Figure 5; 0 and 0 in Supplementary Figure 6). A practical solution is to implement an alert when the tumor ratio is very low, prompting a pathologist to verify the presence of tumor—an intervention that would require minimal additional effort. Moving forward, a critical step is the systematic evaluation of the framework across a diverse range of biomarkers, considering variations in expression levels, cellular localization, and staining heterogeneity, to assess its further scalability.

Segmentation Imperfections Arise due to the Similar Cellular Morphology of Glandular and Tumor Cells. Shown are WSI Examples (Left) and Corresponding TSM Segmentation Results (Right) from Three Datasets: (a) the Internal MHC-I Dataset (Internal Testing), and (b) the Semi-External CD73 Dataset (External Testing), and (c) the External HER2 Dataset (External Testing). The Tissue Samples in (a) and (b) are from the Same Patient, and the Segmentation Results Demonstrate Overall Consistent Tumor–Stroma Delineation.
Conclusion
In this work, we developed a modular H-scoring framework that achieved agreement comparable to the variability observed between expert pathologists on 94 WSIs from the internal MHC-I dataset. External validation on CD73 and HER2 datasets demonstrated generalizability across biomarkers and breast cancer subtypes. The framework offers two potential clinical implementation pathways: as a decision-support tool, particularly for challenging cases where staining is near a cut-off threshold, and as an automated triage system to streamline straightforward classifications (HER2 scores 0, 2+, 3+) while prioritizing equivocal cases (scores 1+, equivocal 2+) for expert review. Clinical integration will require multi-center validation across diverse IHC biomarkers, antibody clones, staining protocols, and cancer types, alongside considerations of regulatory compliance, digital infrastructure costs, staff training requirements, and pathologist acceptance.
Supplemental Material
sj-docx-1-tct-10.1177_15330338251407734 - Supplemental material for Fully Automated Stain Quantification Framework for IHC Whole Slide Images in Breast Cancer
Supplemental material, sj-docx-1-tct-10.1177_15330338251407734 for Fully Automated Stain Quantification Framework for IHC Whole Slide Images in Breast Cancer by Tuo Yin, Frédéric Lifrange, Zoë Denis, Alex de Caluwé, Laurence Buisseret, Xavier Catteau, Clara Legros, Nick Reynaert and Jennifer Dhont in Technology in Cancer Research & Treatment
Supplemental Material
sj-pdf-2-tct-10.1177_15330338251407734 - Supplemental material for Fully Automated Stain Quantification Framework for IHC Whole Slide Images in Breast Cancer
Supplemental material, sj-pdf-2-tct-10.1177_15330338251407734 for Fully Automated Stain Quantification Framework for IHC Whole Slide Images in Breast Cancer by Tuo Yin, Frédéric Lifrange, Zoë Denis, Alex de Caluwé, Laurence Buisseret, Xavier Catteau, Clara Legros, Nick Reynaert and Jennifer Dhont in Technology in Cancer Research & Treatment
Footnotes
Acknowledgments
Not applicable.
Ethical Considerations and Informed Consent Statements
Ethical approval was obtained from the Commissie Medische Ethiek UZ Brussel/VUB in the context of the clinical trial NeoCheckRay (approval number: 2018-004165-13) during which the samples from the internal dataset were collected. The approval included translational research and the analysis of clinical trial samples as communicated to the patient.
Funding
The authors received no financial support for the research, authorship, and/or publication of this article.
Declaration of Conflicting Interests
The authors declared no potential conflicts of interest with respect to the research, authorship, and/or publication of this article.
Data Availability Statement
Supplemental Material
Supplemental material for this article is available online.