
Abstract
Introduction
Lymphovascular invasion (LVI), an aggressive pathological manifestation of breast cancer, is closely associated with increased risk of distant metastasis and poor prognosis. This study proposes a novel modeling strategy that integrates MRI-derived microvascular atlas parameters with the TwinsSVT deep learning architecture to enable noninvasive prediction of LVI status in breast cancer patients and to explore its biological interpretability.
Materials and Methods
A total of 436 breast cancer patients from two medical centers, all pathologically confirmed postoperatively, were retrospectively enrolled. All patients underwent high-resolution multi-b-value diffusion-weighted imaging (DWI) prior to surgery. From the MRI data, four types of microvascular simulation parameter maps were reconstructed within tumor regions: apparent diffusion coefficient (ADC), mean flow velocity (v_m), velocity dispersion (v_s), and angiographic branching index (ANB), aiming to characterize intratumoral microcirculation and vascular structural complexity. These functional parametric maps were individually input into separate encoder branches of the TwinsSVT model to extract multi-scale spatial features. A multi-layer Transformer fusion module was then employed to capture structural interactions across modalities, thereby constructing a multi-parametric fusion model. Model performance was evaluated using metrics including area under the curve (AUC) and F1 score.
Results
Compared with single-parameter models, the multi-parametric fusion model demonstrated significantly improved predictive performance, with AUCs of 0.881 (95% CI: 0.781-0.982) and 0.859 (95% CI: 0.764-0.953) in internal and external validation cohorts, respectively. Grad-CAM visualizations revealed that the model predominantly focused on tumor margins and regions of high vascular density, suggesting a strong correlation between the model's attention and actual pathological structures.
Conclusion
The deep learning model constructed based on MRI-derived microvascular simulation atlases enables noninvasive preoperative prediction of LVI status in breast cancer patients. By effectively capturing structural information and offering biological interpretability, the model holds promise as a robust imaging-based tool for precision subtyping and clinical decision support.
Introduction
Breast cancer is one of the most common malignant tumors among women worldwide. The development of individualized treatment strategies relies heavily on accurate assessment of the tumor's biological behavior. 1 Lymphovascular invasion (LVI), defined as the pathological presence of cancer cells within lymphatic or blood vessels, is widely recognized as a critical prerequisite for distant metastasis. The presence of LVI is typically associated with more advanced tumor staging, greater invasiveness, and poorer disease-free survival.2,3 Clinical studies have shown that breast cancer patients with LVI positivity are more likely to present with regional lymph node metastasis, exhibit a significantly higher risk of postoperative recurrence, and show greater dependency on adjuvant therapies. Particularly, LVI status often serves as an essential pathological reference for key clinical decisions—such as whether to perform axillary lymph node dissection, intensify postoperative chemotherapy, or administer anti-HER2 or anti-angiogenic therapies.4,5 However, definitive diagnosis of LVI currently depends on postoperative histopathological evaluation. There remains a lack of reliable and quantifiable preoperative indicators for LVI, leaving clinicians to rely largely on subjective experience. This uncertainty poses a dilemma between overtreatment and delayed intervention in surgical planning and therapeutic intensity.
Currently, magnetic resonance imaging (MRI) serves as a key imaging modality for the preoperative evaluation of breast cancer. While it provides valuable insights into tumor morphology, margins, and local invasion, its ability to detect subtle intravascular invasion remains limited. On one hand, LVI typically lacks distinct signal characteristics or morphological alterations on conventional imaging, and its assessment often relies on indirect signs, which are inherently subjective and poorly reproducible. On the other hand, emerging techniques such as radiomics and deep learning have shown promise in supporting diagnosis through high-dimensional feature modeling.6,7 However, most existing models are based on texture, grayscale, and shape features extracted from raw MRI sequences, which inadequately capture microstructural alterations directly related to the pathophysiology of LVI—such as hemodynamic remodeling or abnormal vascular branching.8,9 In this study, we propose an innovative approach that integrates microvascular simulation atlases with a cross-scale deep learning architecture. By extracting latent hemodynamic and vascular structural features from preoperative MRI, we construct multi-parametric maps that reflect the microvascular dynamics within the tumor region, serving as a mechanistic representation of LVI as a vascular-associated pathological event. Furthermore, we adopt the TwinsSVT framework—capable of modeling long-range spatial dependencies—to build a multimodal atlas-fusion model that captures spatial interactions among diverse parametric inputs, thereby enhancing the model's ability to identify tumor–vascular interaction patterns.
In summary, this study presents a novel imaging-driven framework for preoperative prediction of lymphovascular invasion in breast cancer by integrating MRI-derived microvascular simulation atlases with a cross-scale deep learning architecture. By explicitly modeling tumor-associated hemodynamic and vascular structural characteristics, the proposed approach moves beyond conventional texture- or morphology-based MRI analysis and provides a mechanism-oriented representation of LVI as a vascular-related pathological process. The incorporation of a TwinsSVT-based multi-branch encoder and a transformer fusion module further enables effective interaction learning across heterogeneous parametric maps, resulting in improved predictive performance and interpretability. Collectively, this work offers a noninvasive and physiologically grounded imaging strategy that may support more accurate preoperative risk stratification and personalized treatment planning for breast cancer patients.
Materials and Methods
Patients
This retrospective study included a total of 436 breast cancer patients from two medical centers between January 2022 and January 2025 (the patient inclusion flowchart is shown in Figure 1). Patients from Center 1 (n = 353) were randomly divided into a training cohort (n = 247) and an internal validation cohort (n = 106) in a 7:3 ratio using a fixed random seed. Patients from Center 2 (n = 83) formed the external validation cohort. Inclusion criteria were as follows: (1) Histopathologically confirmed primary invasive ductal carcinoma; (2) Underwent preoperative breast MRI within one week before surgery, with imaging meeting the study's quality requirements; (3) Availability of complete clinical and pathological data. Exclusion criteria included: (1) Receipt of any form of antitumor therapy (eg, chemotherapy, radiotherapy) prior to MRI; (2) Presence of other malignant tumors or confirmed distant metastasis; (3) Poor MRI image quality or incomplete clinical information. This study was approved by the Institutional Review Board (IRB) of each participating center (Approval No. YX-Z-2023-063-01 and 2025028). Due to the retrospective nature of the study, the requirement for informed consent was waived. This study was conducted and reported in accordance with the Transparent Reporting of a multivariable prediction model for Individual Prognosis Or Diagnosis (TRIPOD) guidelines. 10
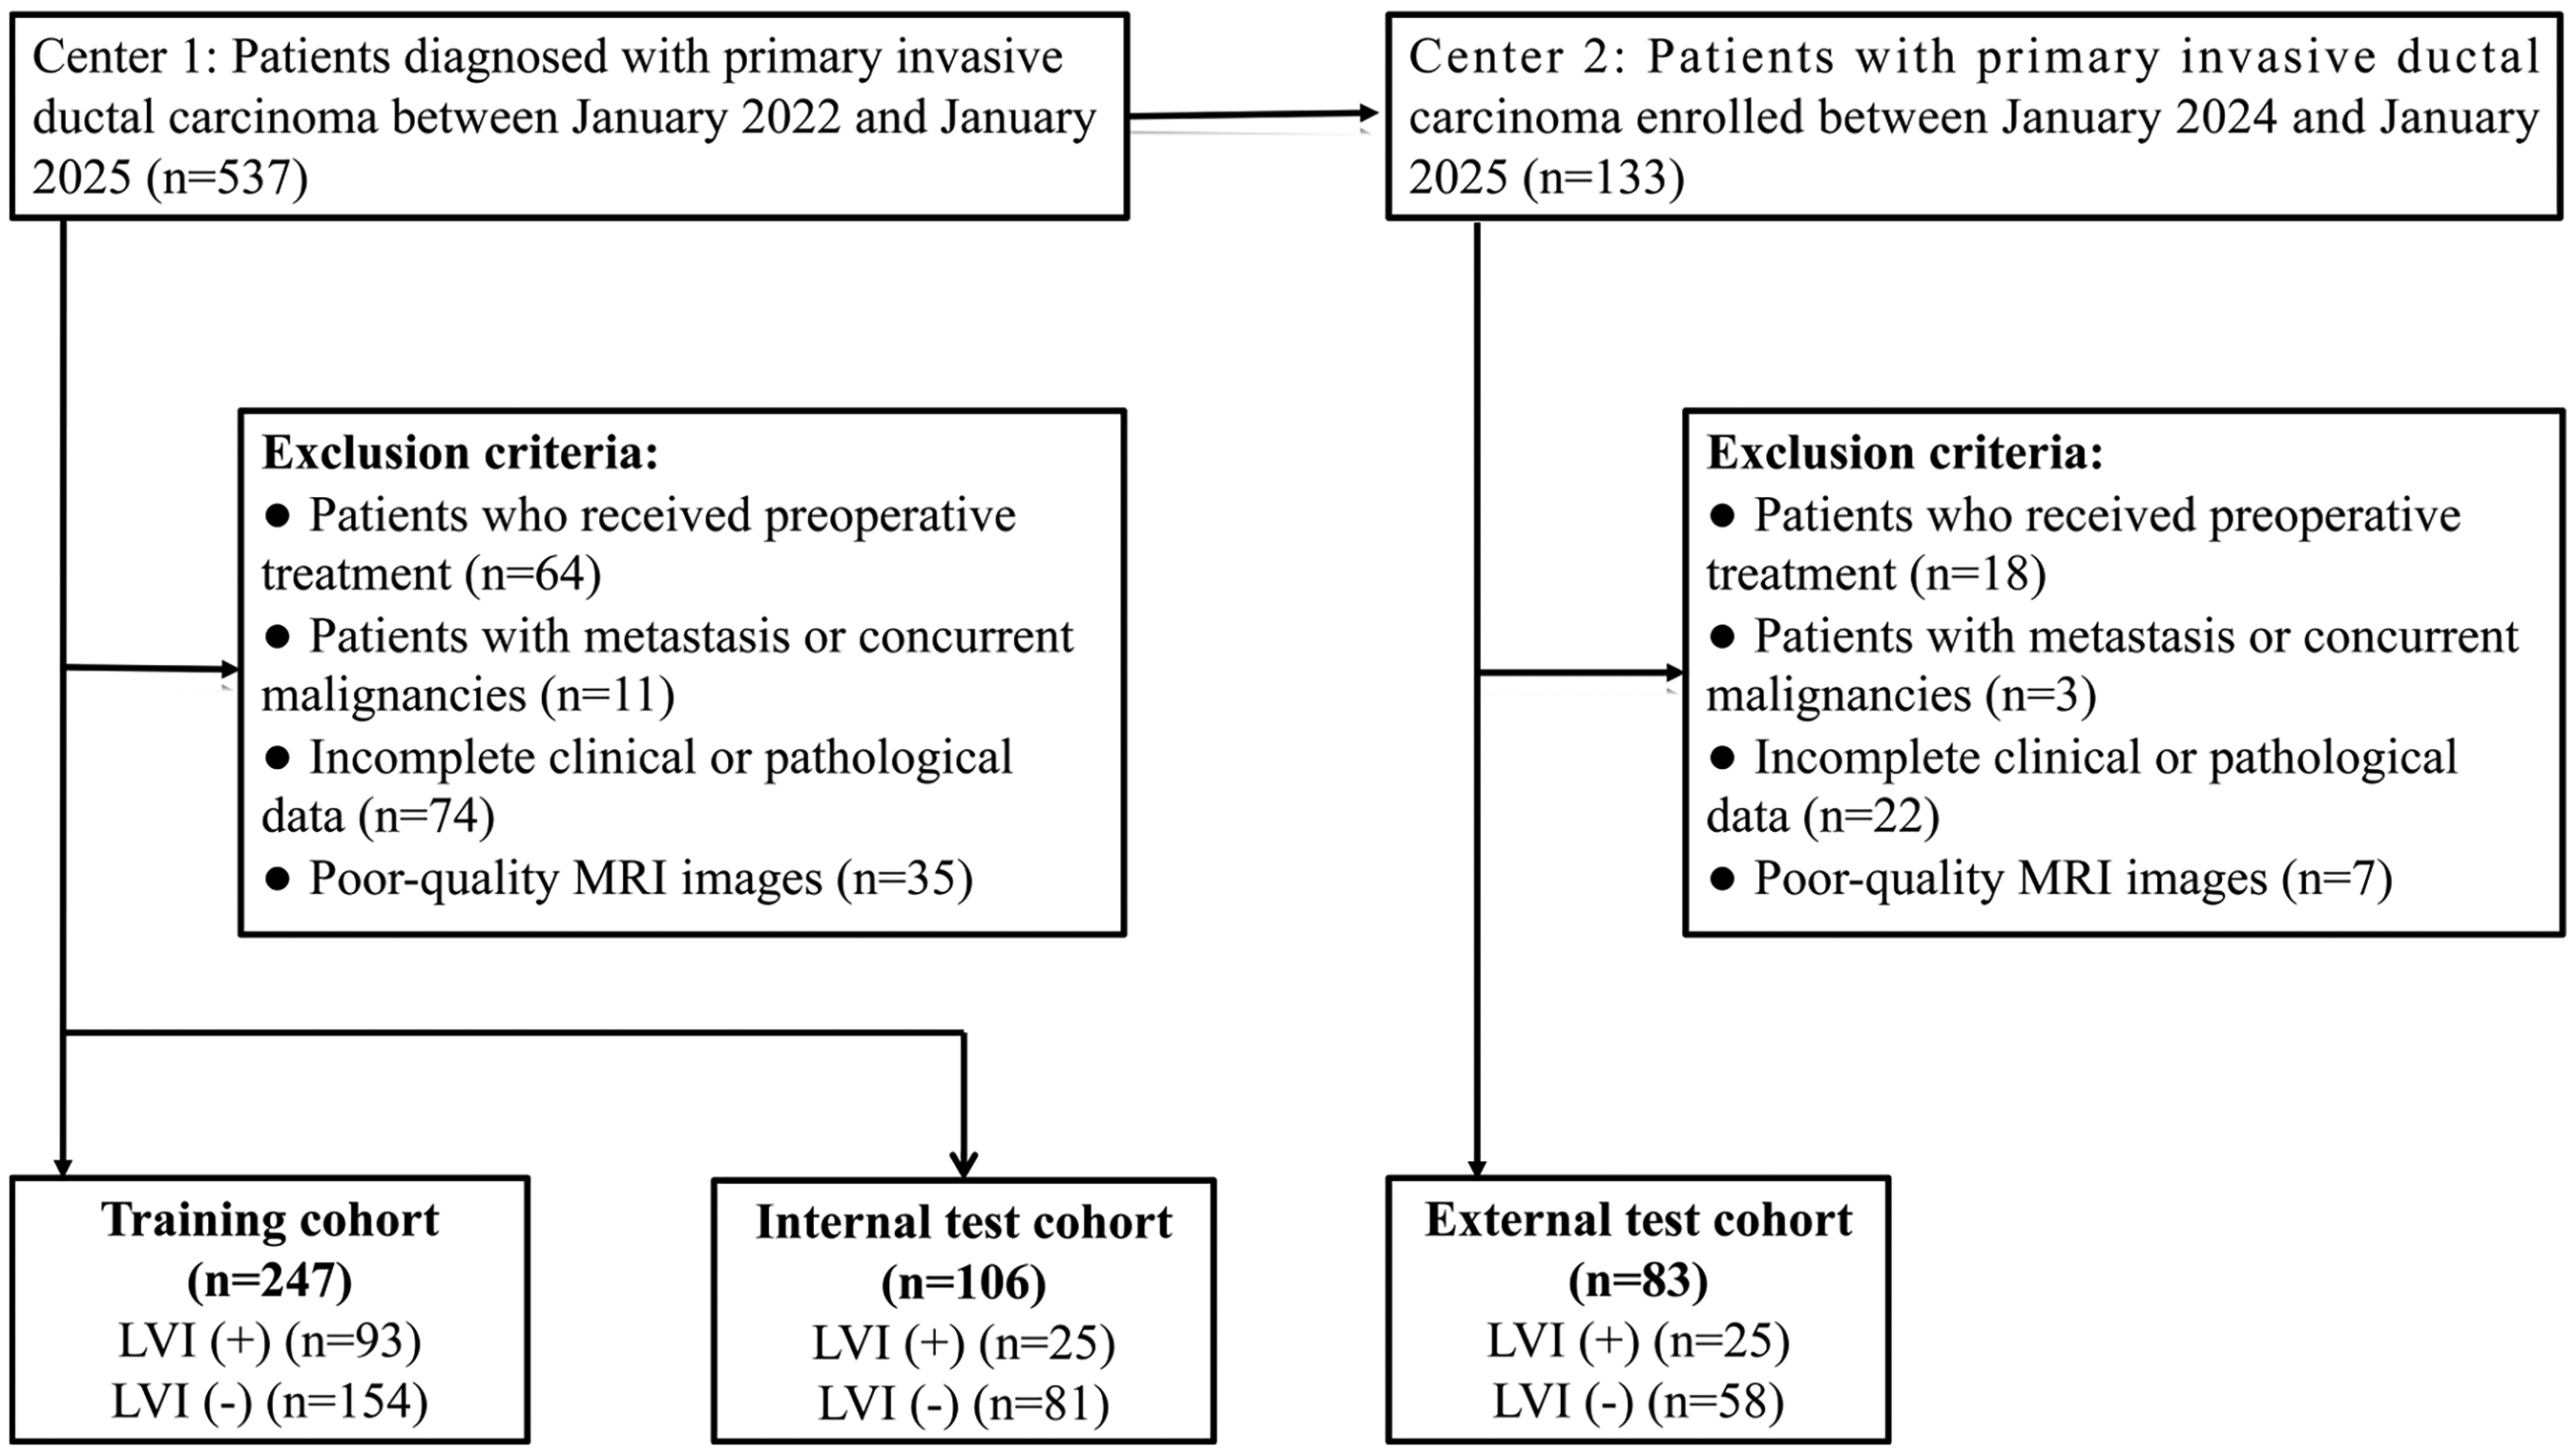
Flow chart of the patients’ recruitment pathway.
Pathological Evaluation
In this study, the diagnosis of LVI was based on postoperative histopathological examination, and patients were classified into LVI-positive and LVI-negative groups accordingly (for detailed assessment protocol, see Supplemental Material 1). Two board-certified pathologists, each with more than 8 years of experience in breast cancer diagnosis, independently reviewed all histological slides blinded to clinical and imaging data. The determination of LVI was made based on a combination of cellular morphological features and immunohistochemical staining patterns. In cases of disagreement between the two primary reviewers, a third senior pathologist was consulted to perform a consensus review and render a final diagnosis. All pathological evaluations were conducted under a strict double-blind protocol to ensure diagnostic objectivity and inter-rater consistency.
MRI ROI Delineation and Microvascular Parameter Map Construction
All patients underwent preoperative MRI scans that included multi-b-value diffusion-weighted imaging (DWI) sequences with b-values of 50, 800, and 1500 s/mm2. Prior to post-processing, all image data were subjected to a standardized preprocessing pipeline, including spatial registration, noise suppression, and signal intensity normalization, to ensure consistency across different b-values and scanners. In addition, all images were resampled to a unified spatial resolution before further analysis. These preprocessing steps were applied uniformly to data from all participating centers to mitigate inter-scanner and inter-protocol variability and to enhance the robustness and reproducibility of the multi-center analysis.(detailed acquisition parameters for each scanner are provided in Supplemental Material 2). The region of interest (ROI) was manually delineated on a slice-by-slice basis by two experienced breast radiologists using ITK-SNAP software. Delineation was performed with reference to both T2-weighted images (T2WI) and high b-value (b = 1500) DWI, under a double-blind evaluation protocol. In cases of disagreement, a third senior radiologist reviewed and adjusted the ROI to reach consensus. The inter-observer agreement for ROI delineation was excellent (Dice similarity coefficient > 0.80). Based on the finalized ROIs, a physical modeling approach leveraging diffusion-perfusion coupling effects was employed to reconstruct signals reflecting tumor-associated microvascular structures. By fitting the dynamic signal attenuation across multiple b-values, this model inferred the local flow velocity distribution and vascular branching characteristics, ultimately generating a set of simulated parameter maps that represent functional states of the intratumoral microcirculation.
The resulting parametric maps included: Mean velocity map (v_m-map): capturing the overall level of blood flow; Velocity dispersion map (v_s-map): reflecting heterogeneity in flow velocity distribution; Angiographic branching index map (ANB-map): quantifying the complexity of vascular branching architecture. Details regarding signal modeling procedures and parameter settings are provided in Supplemental Material 3.
Deep Feature Extraction and Model Architecture
A multi-branch encoder framework based on Twins-SVT was employed as the core architecture for feature extraction in this study. The network is capable of modeling spatial hierarchies across different scales and enhances the representation of long-range dependencies through self-attention mechanisms. For each input image modality—v_m-map, v_s-map, ANB-map, and ADC map—an independent encoder branch was constructed to ensure modality-specific feature representation. Each branch processes its input through a sequence of multi-scale convolutional layers and self-attention modules, producing high-dimensional spatial feature representations that preserve both tumor morphology and vascular-related hemodynamic characteristics. 11 To reduce dimensionality while retaining essential information, principal component analysis (PCA) was applied to each feature vector, reducing it to 128 dimensions.
A Transformer-based fusion module was subsequently introduced to integrate the deep features extracted from all four branches. Feature fusion was performed at the feature level rather than the decision level, enabling joint representation learning across different parametric modalities. This module consists of stacked encoder layers, each comprising a multi-head self-attention (MHSA) mechanism and residual normalization blocks. These layers enable cross-modal interaction learning, capturing global dependencies and revealing potential complementary relationships among the input modalities. Finally, the fused feature vector was passed through a fully connected layer, followed by a Sigmoid activation function to generate an individualized binary prediction probability 12 (see Figure 2). Detailed implementation settings, including training hyperparameters and optimization strategies, are provided in the publicly available code to facilitate reproducibility (https://github.com/zzj00/DWI-based-Deep-Learning-Pipeline-for-Medical-Imaging). All experiments were conducted on a workstation equipped with an NVIDIA GeForce RTX 4090 GPU with 24 GB of video memory.
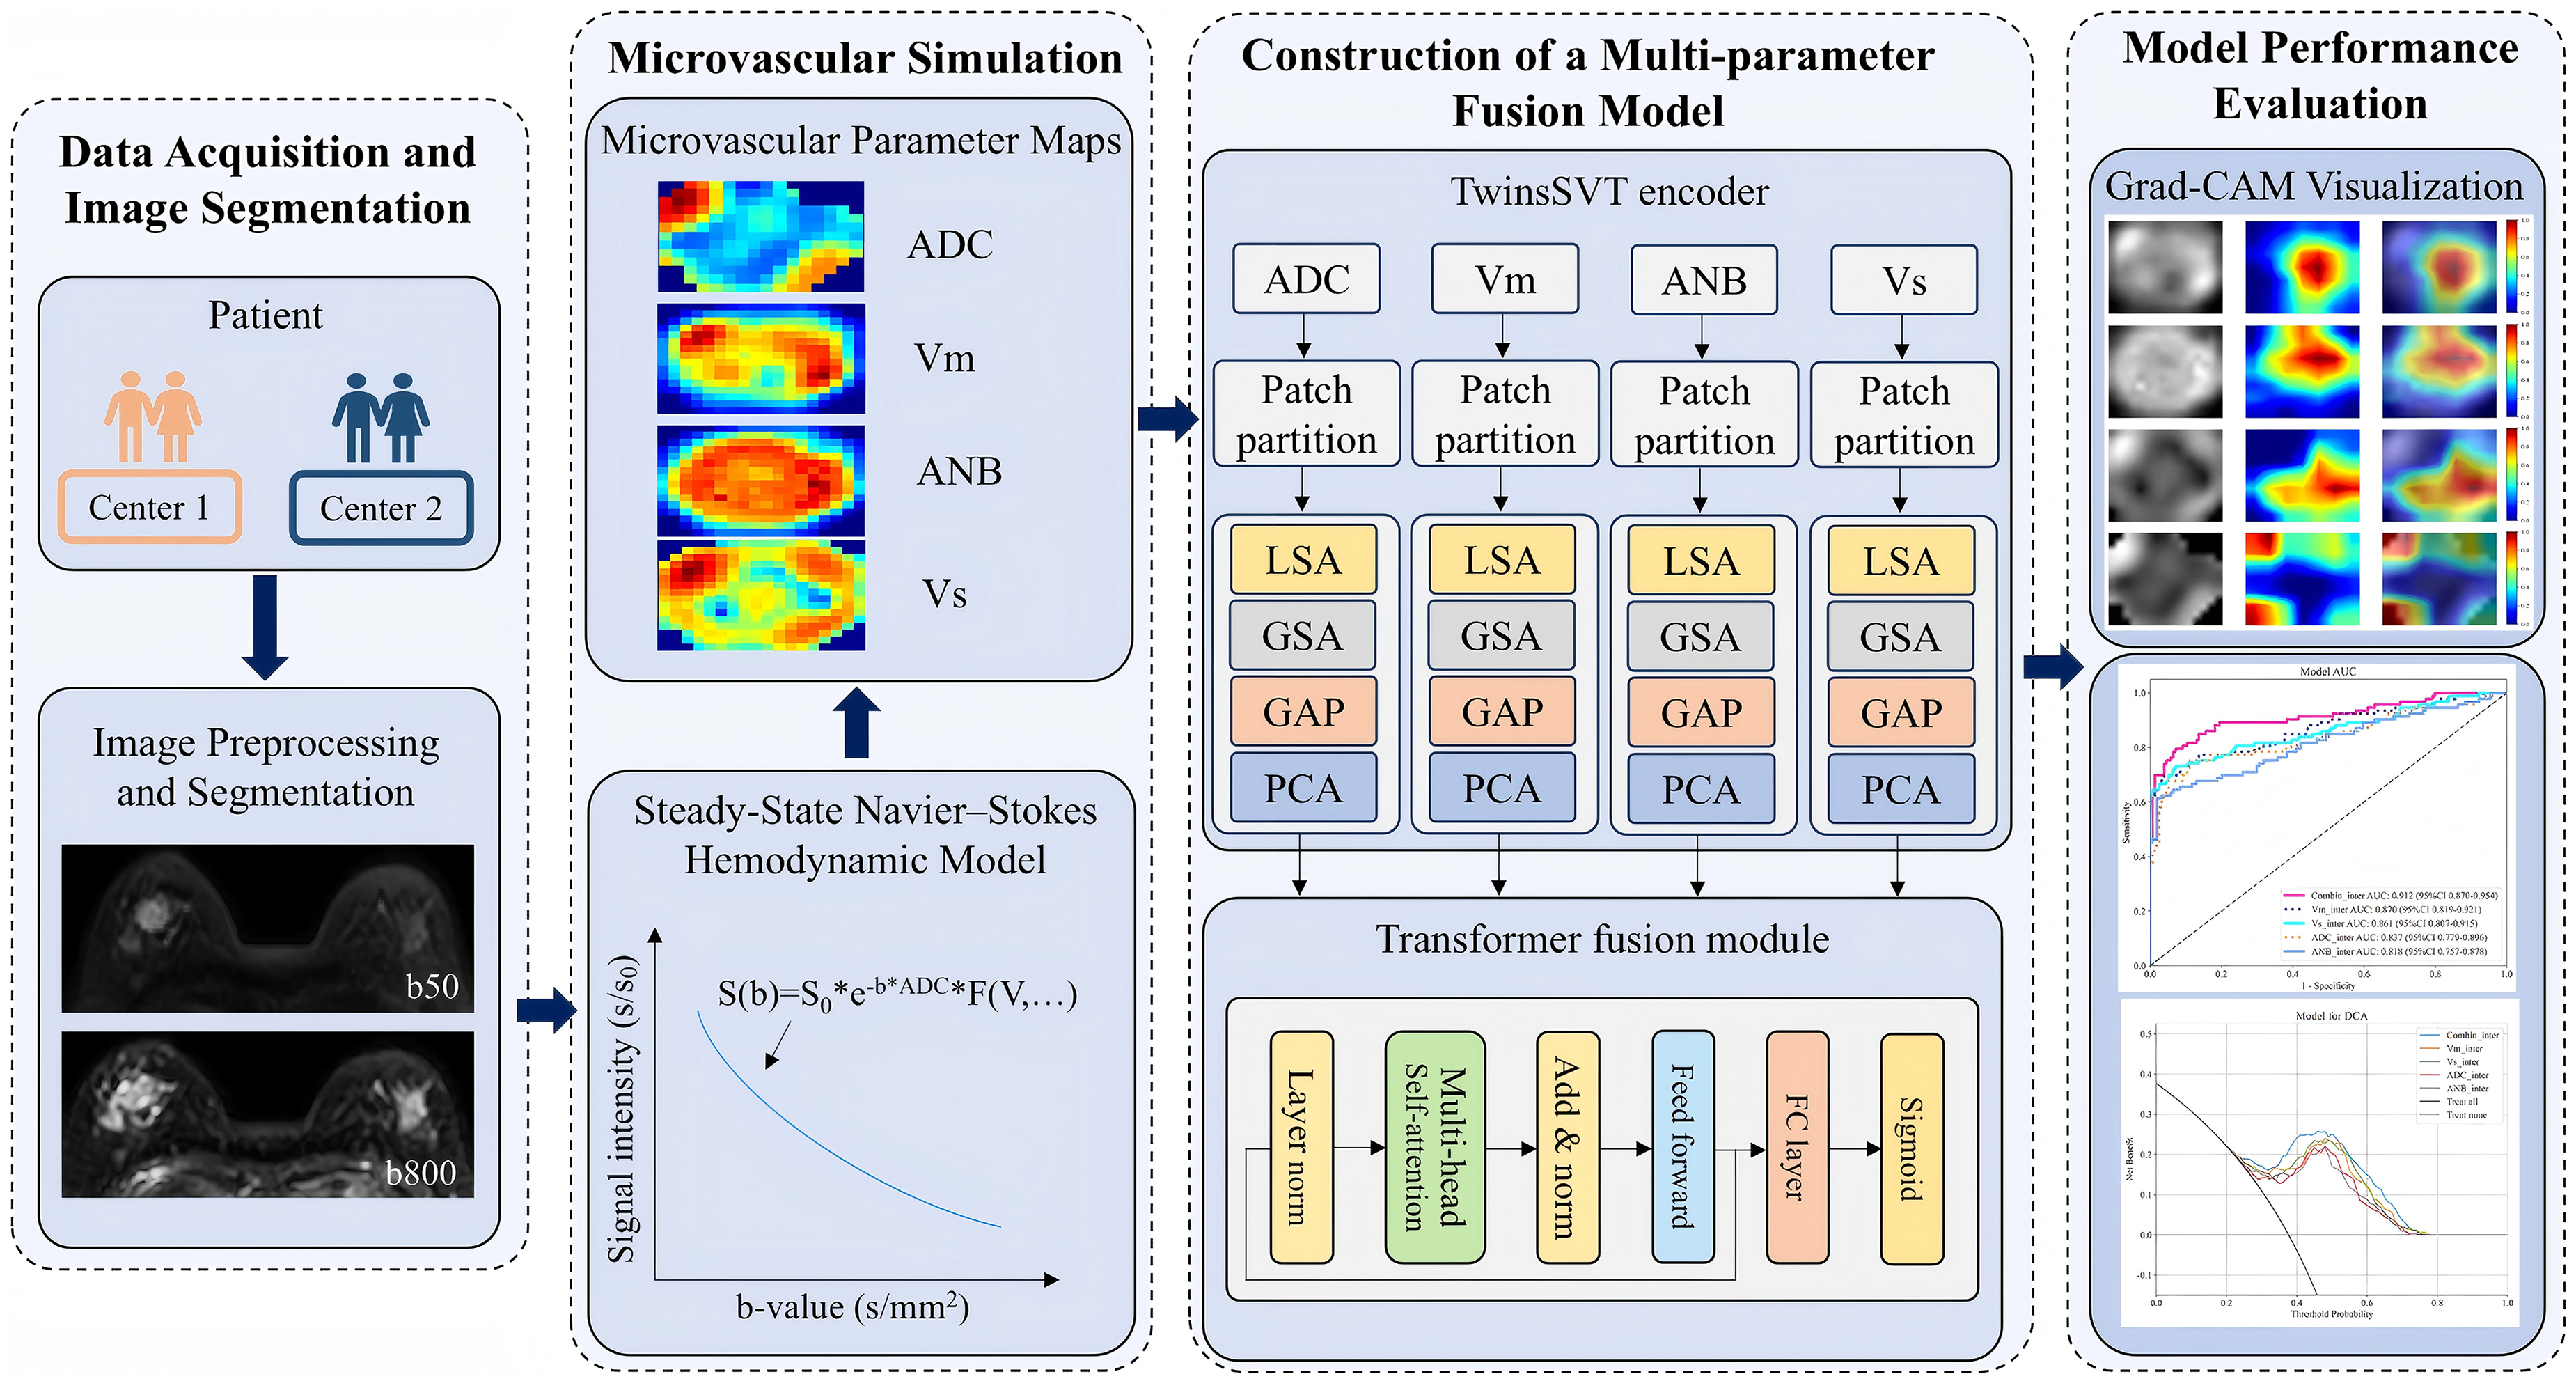
Overall workflow of the study, including data acquisition, microvascular simulation, multi-parameter model construction, and performance evaluation. Patient images from two independent centers underwent preprocessing and tumor segmentation. Based on a steady-state Navier–Stokes hemodynamic model and the Bloch–Torrey equation, microvascular parameter maps—including ADC, mean flow velocity (V_m), velocity dispersion (V_s), and apparent number of branches (ANB)—were generated via numerical inversion. A multi-parameter fusion model based on the TwinsSVT framework and Transformer modules was constructed for classification tasks. Model interpretability and diagnostic performance were evaluated using Grad-CAM visualizations, receiver operating characteristic (ROC) curves, and decision curve analysis (DCA).
Statistical Analysis
All statistical analyses were performed using R software (version 4.1.3; www.R-project.org) and SPSS software (version 25.0; IBM Corp., Armonk, NY, USA).For continuous variables, independent-samples t-tests were used to compare groups if the data followed a normal distribution. For non-normally distributed variables, the Mann–Whitney U test was applied. Categorical variables were presented as counts and percentages (n, %), and group differences were analyzed using either the Chi-square test or Fisher's exact test, as appropriate. Model performance was evaluated using the F1-score and the AUC. Gradient-weighted Class Activation Mapping (Grad-CAM) was employed to visualize the model's attention distribution for interpretability analysis. Statistical differences in performance between models were assessed using the DeLong test. All statistical tests were two-sided, and a p-value < .05 was considered statistically significant.
Results
Clinical Data
Based on the inclusion and exclusion criteria, a total of 436 patients diagnosed with breast cancer were retrospectively enrolled from two medical centers between January 2022 and January 2025. Patients from Center 1 (n = 353) were randomly divided into a training cohort (n = 247) and an internal validation cohort (n = 106) using a 7:3 ratio. Patients from Center 2 (n = 83) constituted the external validation cohort. Among all patients, 143 (32.8%) were classified as LVI-negative, and 293 (67.2%) were LVI-positive based on postoperative pathological findings. The clinical baseline characteristics of the included patients are summarized in Table 1.
Clinical Baseline Information for Patients.
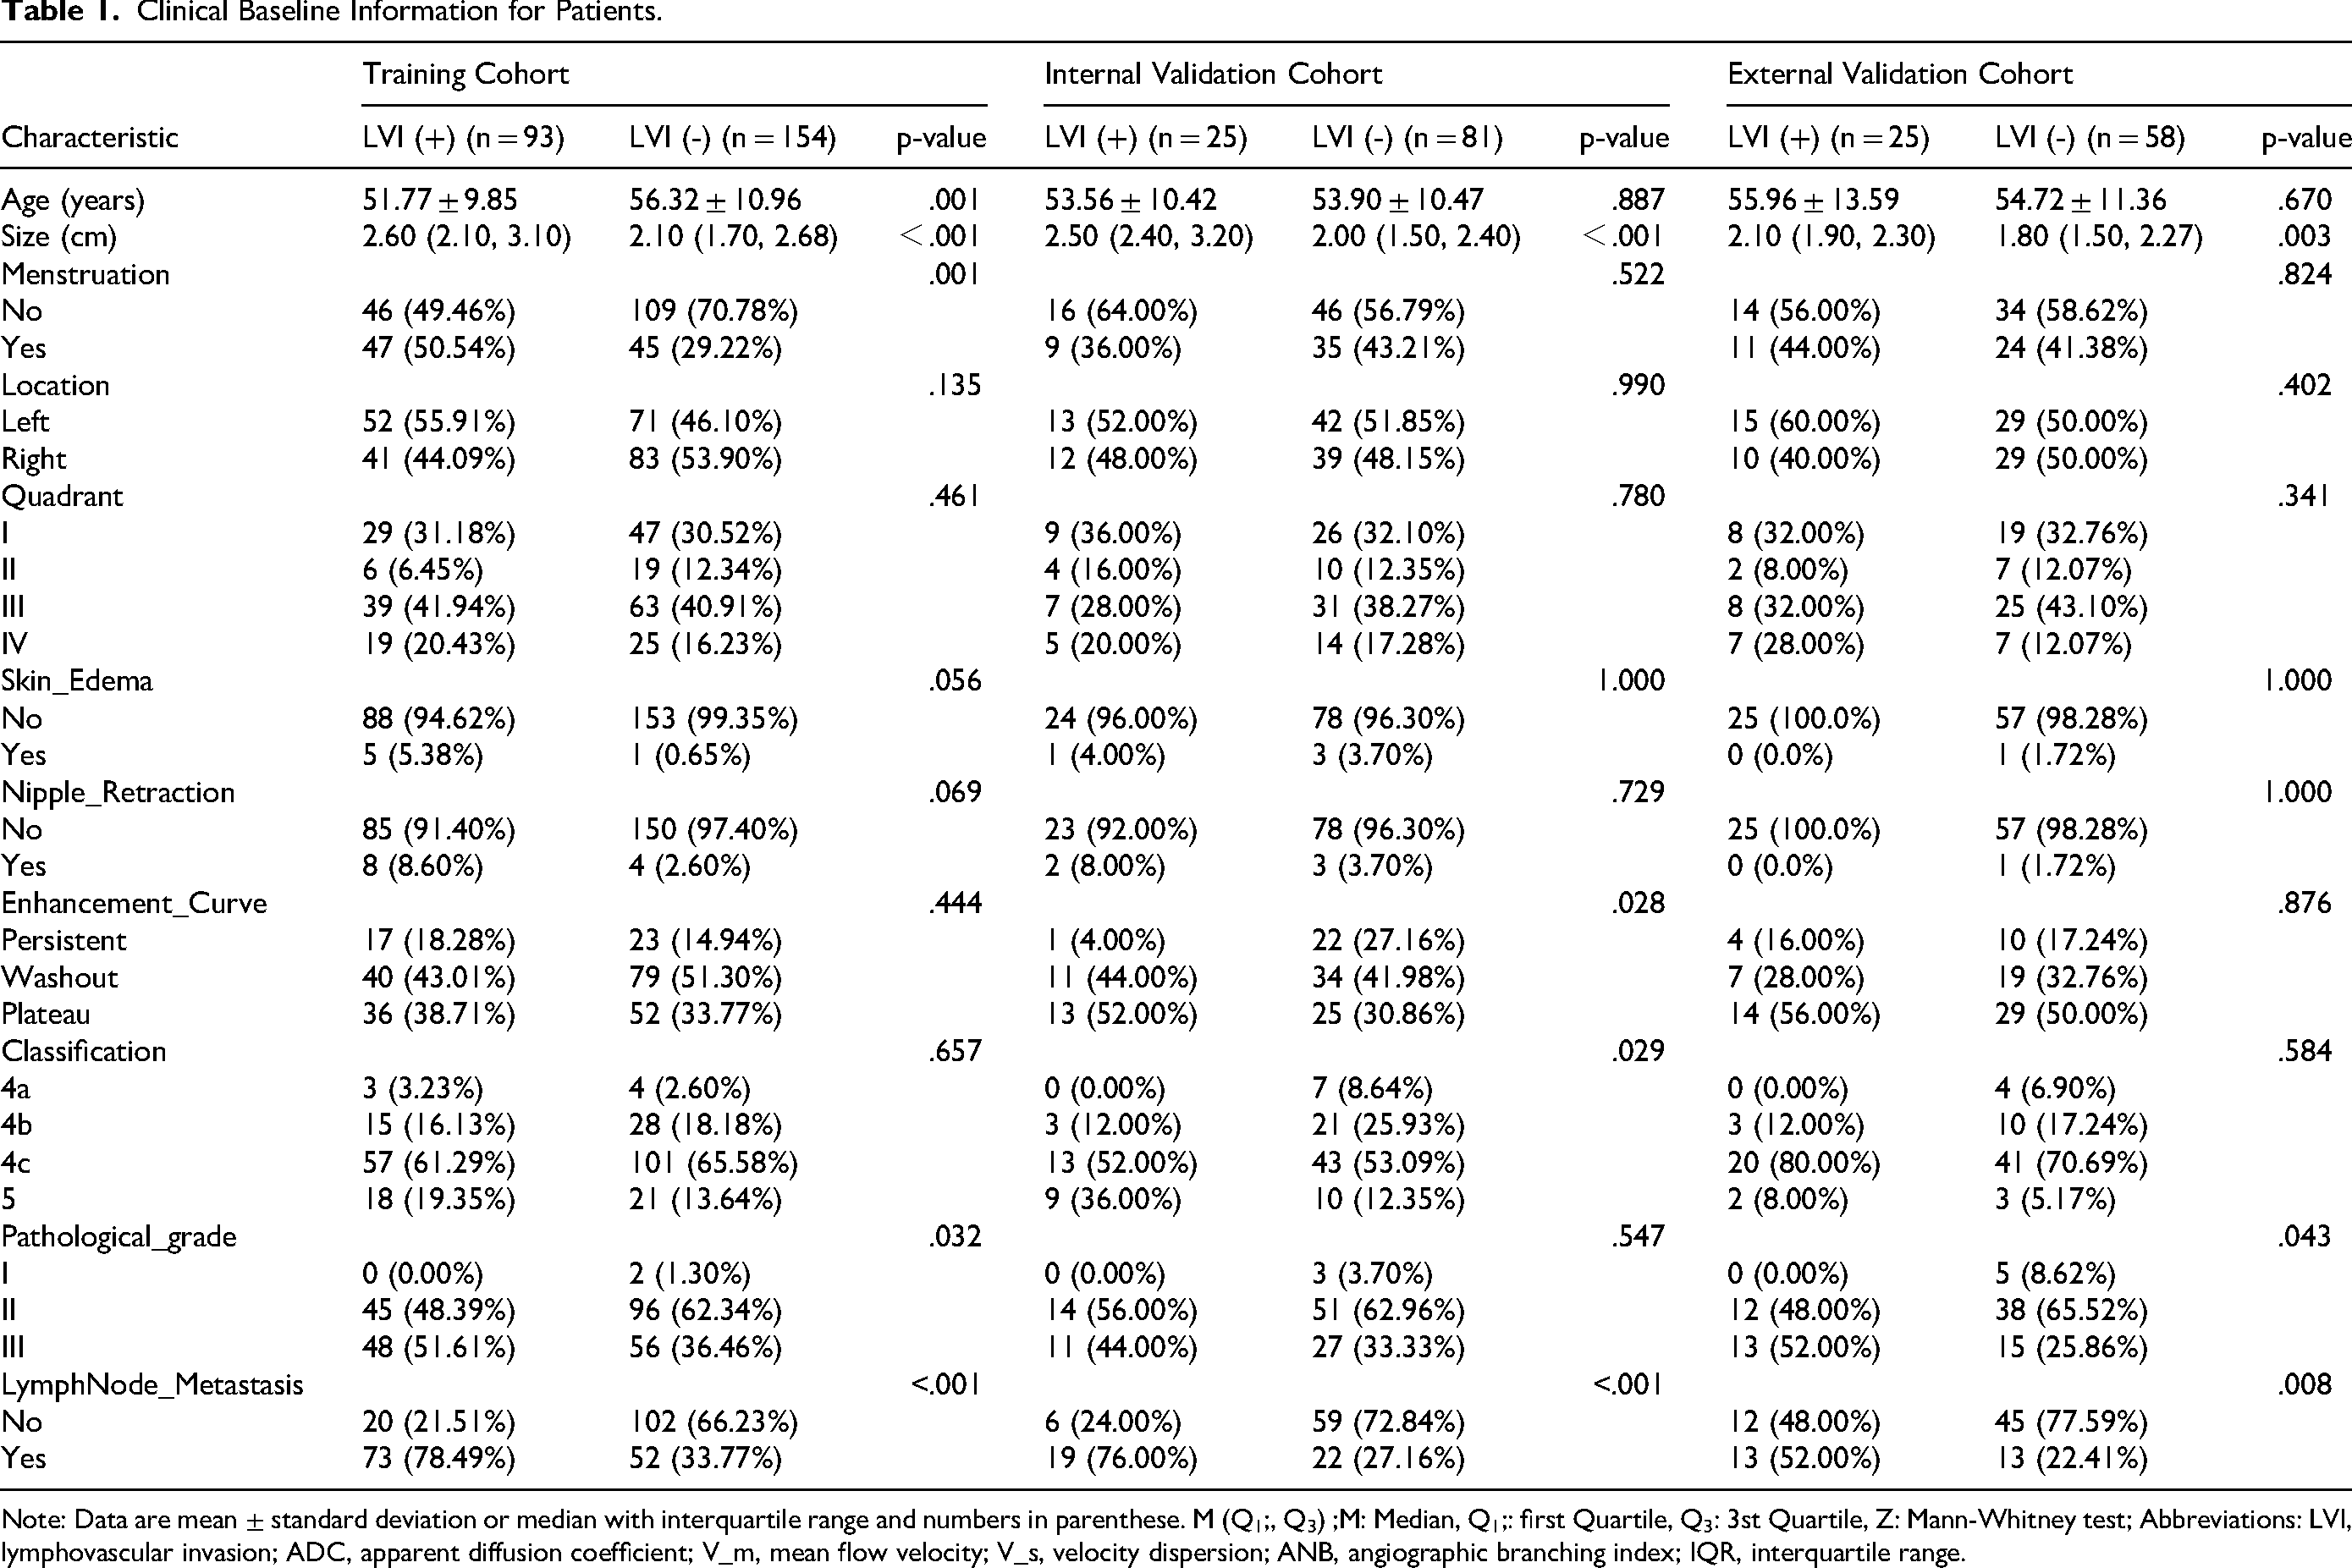
Note: Data are mean ± standard deviation or median with interquartile range and numbers in parenthese. M (Q1;, Q3) ;M: Median, Q1;: first Quartile, Q3: 3st Quartile, Z: Mann-Whitney test; Abbreviations: LVI, lymphovascular invasion; ADC, apparent diffusion coefficient; V_m, mean flow velocity; V_s, velocity dispersion; ANB, angiographic branching index; IQR, interquartile range.
Deep Learning Models Based on TwinsSVT Architecture
Multiple single-parameter deep learning models were constructed based on the TwinsSVT architecture, each corresponding to one type of parametric input. The vm-map model achieved an AUC of 0.852 (95% CI: 0.764-0.941) and F1-score of 0.642 in the internal validation cohort, and an AUC of 0.832 (95% CI: 0.735-0.930) with an F1-score of 0.681 in the external validation cohort. The vs-map model yielded an AUC of 0.849 (95% CI: 0.758-0.941) and an F1-score of 0.681 internally, while externally achieving an AUC of 0.825 (95% CI: 0.728-0.921) and an F1-score of 0.706. The ADC-map model demonstrated an AUC of 0.821 (95% CI: 0.723-0.918) with an F1-score of 0.600 in the internal cohort, and an AUC of 0.798 (95% CI: 0.697-0.899) with an F1-score of 0.667 in the external cohort. The ANB-map model showed the lowest performance, with an internal AUC of 0.804 (95% CI: 0.704-0.905) and F1-score of 0.581, and an external AUC of 0.794 (95% CI: 0.685-0.904) with F1-score of 0.689.
Establishment and Evaluation of the Multi-Sequence Fusion Model
A multi-parametric fusion model was constructed based on the Transformer-based feature fusion module. The model achieved an AUC of 0.881 (95% CI: 0.781-0.982) in the internal validation cohort and 0.859 (95% CI: 0.764-0.953) in the external cohort (Figure 3A and B), with corresponding F1-scores of 0.844 and 0.756, respectively. Compared to single-parameter models, the fusion model demonstrated superior predictive performance (Table 2). Calibration curves revealed good agreement between the predicted probabilities and actual outcomes, indicating adequate model calibration (P > .05, Figure 3C and D). Decision curve analysis (DCA) further showed that the fusion model provided greater net clinical benefit than single-parameter models across a wide range of reasonable decision thresholds in both internal and external validation cohorts (Figure 3E and F).

Model performance evaluation using ROC curves, calibration curves, and decision curve analysis (DCA). (A–B) Receiver operating characteristic (ROC) curves of the fusion model and individual microvascular parameters (V_m, V_s, ADC, ANB) on internal (A) and external (B) validation cohorts, respectively. (C–D) Calibration curves showing agreement between predicted probabilities and observed outcomes in the external (C) and internal (D) cohorts. (E–F) Decision curve analysis (DCA) evaluating the clinical net benefit of different models across a range of threshold probabilities in internal (E) and external (F) validation cohorts. The fusion model consistently demonstrated superior discriminative ability and clinical utility across both cohorts.
F1-Score, Sensitivity, Specificity, and AUC Values in the Three Models.

Abbreviations: AUC, area under the curve; CI, confidence interval; Combin, multi-parameter fusion model; V_m, mean flow velocity; V_s, velocity dispersion; ANB, angiographic branching index.
According to the DeLong test, in the training cohort, the fusion model showed no statistically significant difference compared with the v_m-map model (P > .05). However, in both the internal and external validation cohorts, the fusion model showed statistically significant improvements over the ANB-map model (P < .05) (Supplemental Materials 4 and 5). Grad-CAM visualization indicated that the model predominantly focused on tumor margins and regions with high vascular density, suggesting a strong alignment between the model's attention regions and actual pathological structures (Figure 4).
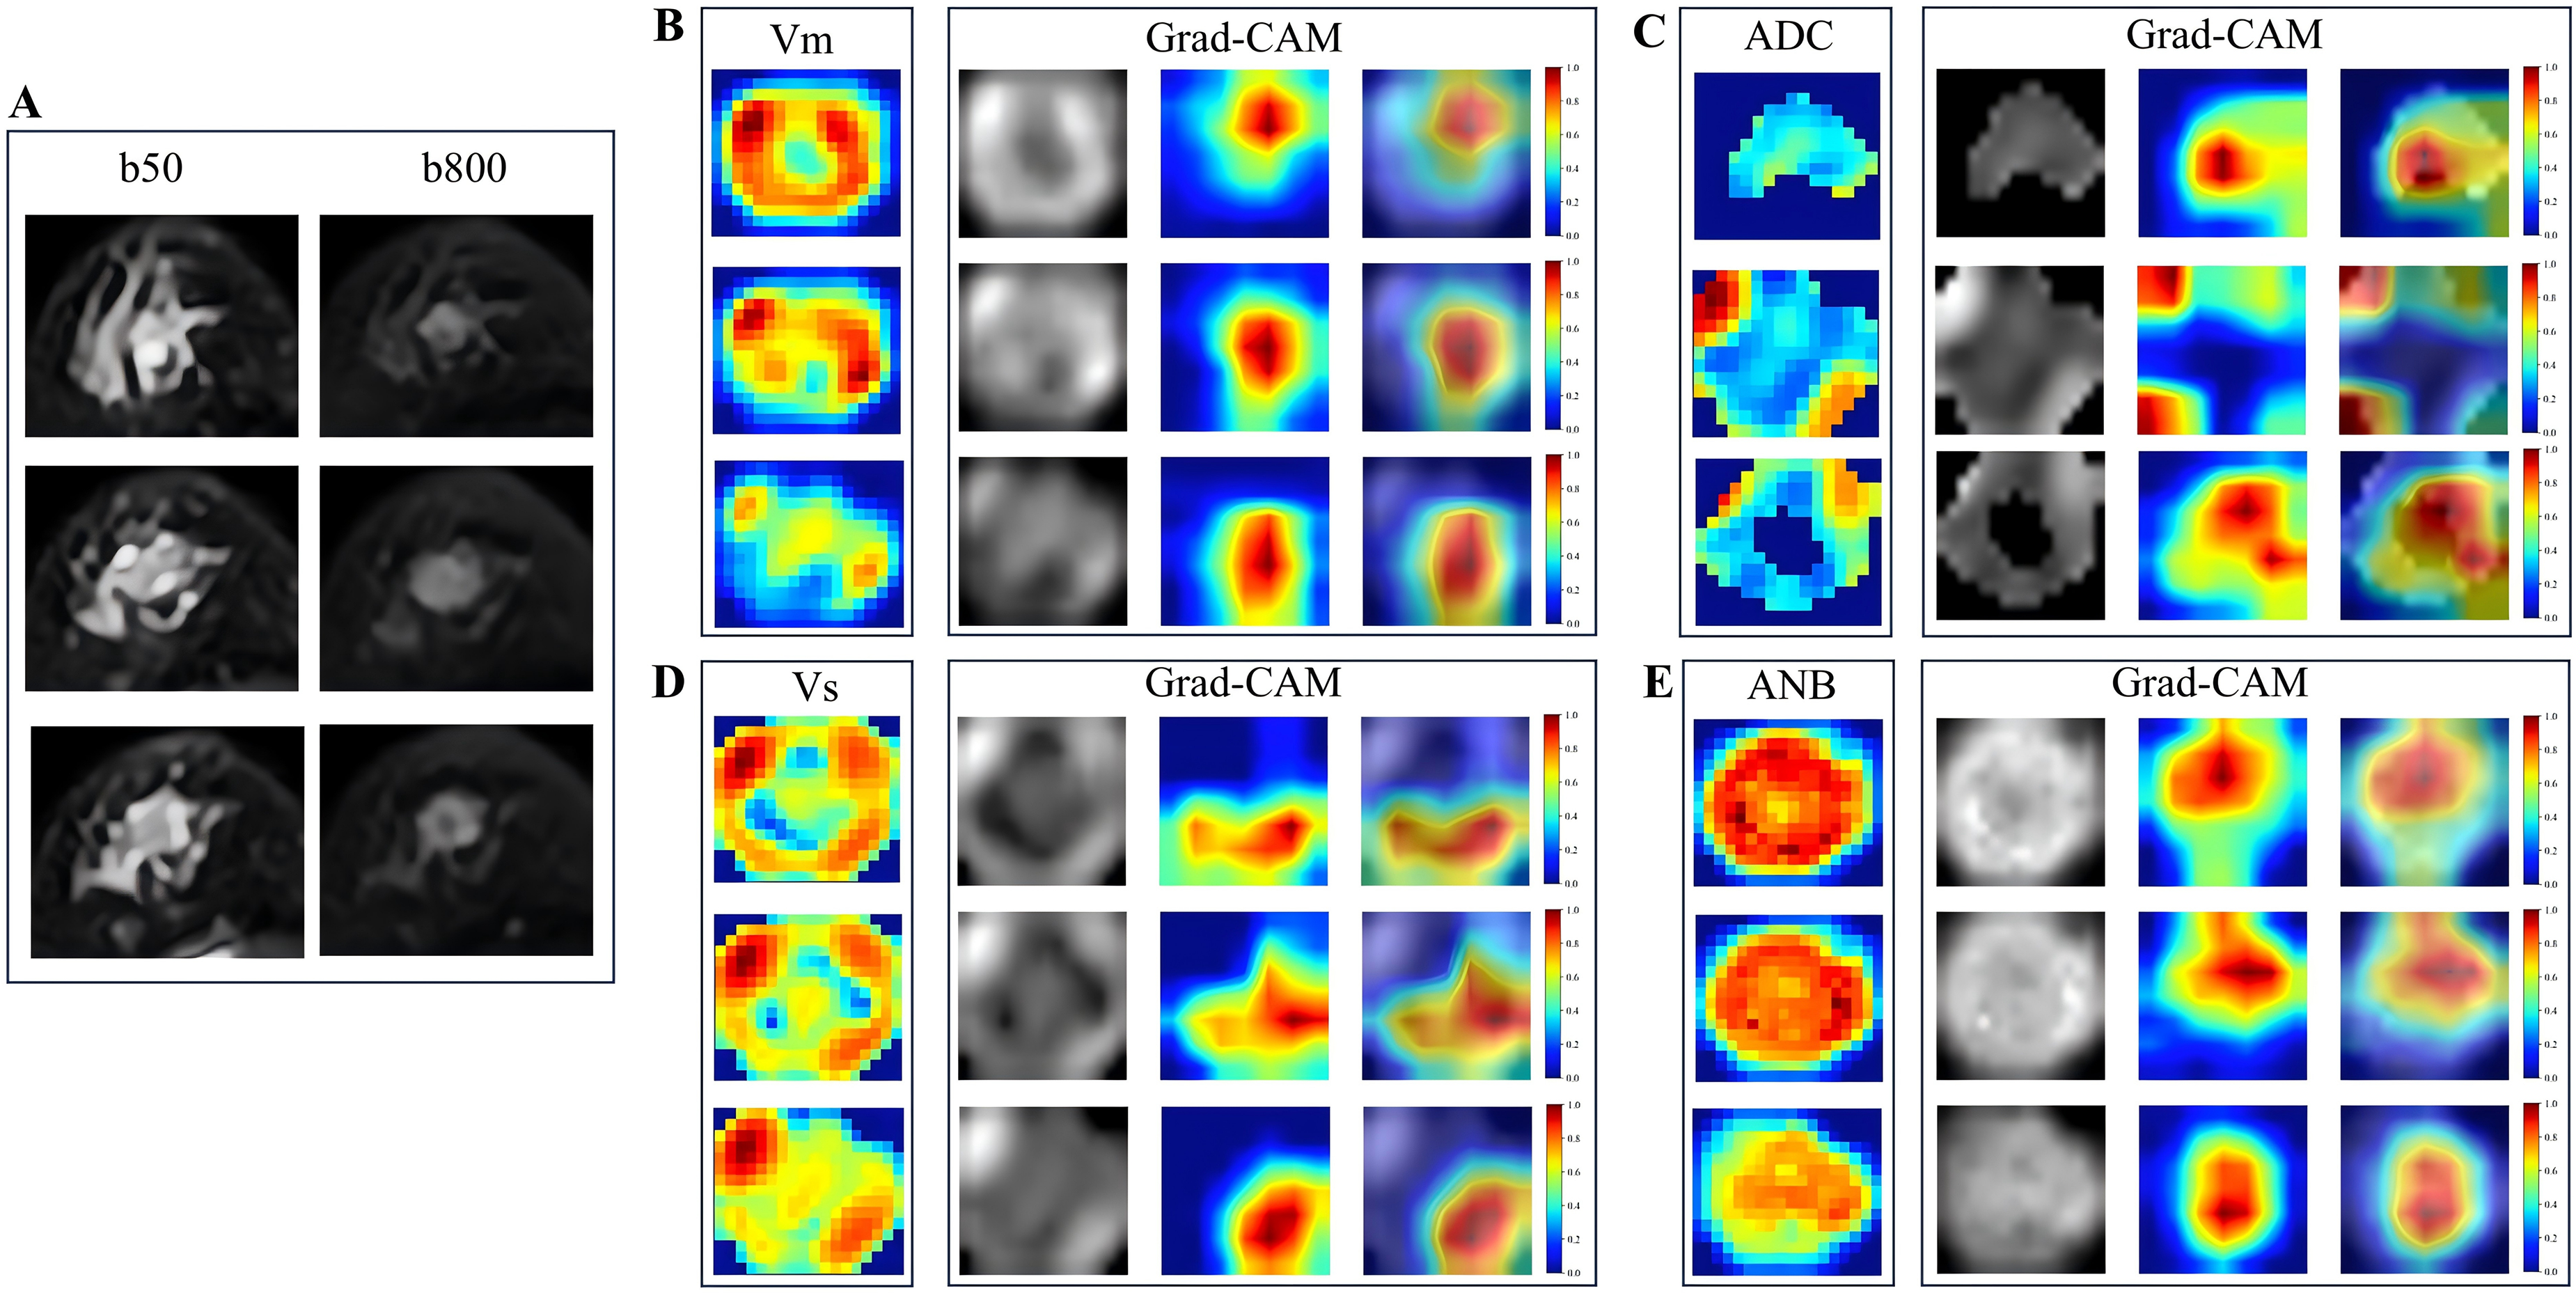
Grad-CAM–based visualization of model attention for lymphovascular invasion prediction. Representative examples illustrating the interpretability of the proposed 2.5D deep learning framework. (A) Original MRI slice with the corresponding tumor region of interest. (B–E) Corresponding microvascular simulation parameter maps—mean flow velocity (v_m), apparent diffusion coefficient (ADC), angiographic branching index (ANB), and velocity dispersion (v_s)—together with their respective Grad-CAM activation maps generated from the trained model. The Grad-CAM visualizations highlight spatial regions that contribute most strongly to the model's predictions, with high-attention areas predominantly localized within the tumor and peritumoral regions. These results indicate that the model focuses on biologically relevant regions associated with microvascular heterogeneity.
Discussion
This study is the first to integrate MRI-derived microvascular simulation parameter maps with a Transformer-based architecture to establish a deep learning model capable of preoperative prediction of LVI in breast cancer. Compared to single-parameter models, the proposed fusion model demonstrated superior predictive performance in both internal and external validation cohorts, indicating strong robustness and generalizability.
In recent years, although several studies have attempted to utilize MRI-based radiomics or deep learning techniques to assist in LVI prediction, most have relied primarily on grayscale, texture, or morphological features extracted from conventional imaging. These features often fail to reflect the underlying microvascular remodeling and hemodynamic alterations that are closely linked to the development of LVI. For example, Zhang 13 extracted radiomic features from T2WI and DCE-MRI sequences to build machine learning models for predicting LVI status. Among the models tested, the K-nearest neighbor (KNN) algorithm performed best. While the results showed some promise, the models lacked mechanism-driven feature inputs, limiting their biological interpretability. Liang 14 developed a deep learning model (MLP-radiomic) for predicting LVI status in patients with invasive breast cancer by integrating clinical and radiomic features. The model achieved an AUC of 0.835 in the validation set, demonstrating good discriminative ability. However, the input features and network design were not specifically tailored to vascular functional mechanisms or structural abnormalities, thus lacking physiological relevance. In efforts to improve interpretability and information integration, Chen 15 proposed a radiomic model that incorporated features from both intratumoral and peritumoral regions. The model achieved favorable predictive performance and further adopted SHAP analysis to enhance explainability. Similarly, Pan 16 integrated MRI-based radiomic features with clinical data to predict LVI status using deep learning, improving the model's ability to capture multidimensional information. Nonetheless, despite these advancements, most existing models still do not incorporate vascular structure– or hemodynamics-related features, which are directly associated with the pathogenesis of vascular invasion. This omission limits their clinical translatability and restricts their potential in real-world diagnostic workflows.
In breast cancer, LVI commonly occurs at the tumor periphery, often accompanied by abnormal neovascular proliferation and hemodynamic remodeling. Macroscopically, these changes may manifest as perfusion hotspots and clusters of aberrant vasculature. 17 Mori 18 demonstrated that the peritumoral region plays a significant role in predicting the LVI status of clinically node-negative breast cancer, suggesting that the spreading characteristics of peritumoral tissue can reflect early invasive biological behavior. To better capture such vascular phenomena, this study utilized three types of microvascular simulation parameter maps—mean velocity (v_m), velocity dispersion (v_s), and angiographic branching index (ANB)—each characterizing the tumor microcirculation from a distinct physiological perspective: perfusion intensity, flow heterogeneity, and vascular morphological complexity, respectively. These parameters not only have clear pathological relevance, but also offer complementary information dimensions. 19 Importantly, the signal spatial structures and distribution patterns of these parametric maps are markedly different. 20 Among all single-parameter models, the v_m-map model exhibited the best overall performance, with higher AUC, F1-score, sensitivity, and specificity compared to the others. This may be attributed to the strong spatial continuity and peripheral concentration of signals in v_m maps, reflecting the overall increase in perfusion commonly seen in LVI-positive regions. Such characteristics are well-suited for local attention mechanisms within the TwinsSVT encoder, allowing the model to focus effectively on the peritumoral flow hotspots and transition zones, which are critical to LVI recognition. 21 Building on this, we further introduced a Transformer-based fusion module, specifically designed to accommodate the heterogeneity across modalities. The stacked self-attention layers enabled deep cross-modality interaction, compensating for the spatial expressiveness limitations of ANB maps and enhancing functional complementarity among v_m, v_s, and ANB features.22,23 As a result, the fusion model achieved AUCs of 0.881 and 0.859 in internal and external validation cohorts, respectively—surpassing the performance of all single-parameter models. These findings suggest that integrating diverse microvascular parameter maps provides a more accurate and comprehensive representation of LVI-related vascular pathology. Overall, this study demonstrates a modeling framework that is biologically grounded from parameter generation to architectural integration, enhancing not only the predictive performance but also the interpretability and generalizability of the model. This represents a promising and translatable pathway for noninvasive preoperative assessment of LVI in clinical breast cancer management.
From a biological perspective, the three parametric maps used in this study correspond to distinct mechanisms underlying vascular invasion (VI). The vm-map, which reflects local perfusion levels, aligns well with areas of neovascular proliferation and perfusion enhancement—phenomena frequently observed in regions of high LVI incidence in breast cancer. This spatial correspondence was consistent with Grad-CAM visualizations, which showed the model's attention focused on peritumoral perfusion hotspots, thereby supporting the pathological plausibility of the model's decision-making process. Compared to previous studies,24,25 our results also demonstrated that the vs-map, which captures spatial heterogeneity in blood flow velocity, may reflect increased vascular permeability and microcirculatory instability commonly present in LVI-positive tumors. This enhances the model's sensitivity to features indicative of tumor aggressiveness. The ANB-map quantifies vascular branching complexity, potentially representing the distorted and excessive angiogenesis that anatomically facilitates LVI. Collectively, these three maps contribute complementary information across functional, dynamic, and structural dimensions. When integrated through the fusion strategy, they enable deep signal synergy, resulting in a model that is not only highly accurate but also biologically interpretable.
Despite these promising findings, several limitations should be acknowledged. First, the generation of microvascular simulation parameters relies on preset modeling assumptions, which may not fully reflect individual-level vascular heterogeneity. Second, ROI delineation was manually performed; although reviewed in a double-blinded fashion, subjectivity may persist. Third, the study cohort was relatively limited in size and drawn from only two centers, and scanner protocol variability may affect the generalizability of the model. Fourth, although Grad-CAM provided visual interpretability, the internal mechanisms of the model cannot yet be fully validated against histopathological evidence. Fifth, the training and internal validation cohorts were generated using a random split rather than stratified sampling based on LVI status, which may have resulted in some differences in class proportions between subsets. Sixth, although several baseline clinical variables were associated with LVI status, they were not incorporated into the predictive model, as this study focused on an imaging-driven framework to evaluate the independent contribution of MRI-derived microvascular parameters. Future studies may explore integrated clinical–imaging models. Lastly, the retrospective design of the study restricts causal inference; therefore, prospective, multicenter studies with larger cohorts are warranted to further assess the clinical utility of the proposed approach.
Conclusion
This study developed a Transformer-based deep learning model that integrates MRI-derived microvascular simulation atlases for the preoperative prediction of LVI in breast cancer. The proposed multi-parametric fusion model demonstrated robust and superior performance in both internal and external validation cohorts. Furthermore, attention visualization indicated that the model primarily focused on tumor margins and regions with high vascular density, supporting its biological interpretability. Overall, this noninvasive imaging-based framework shows potential value for preoperative risk stratification and clinical decision support in breast cancer management.
Supplemental Material
sj-docx-1-tct-10.1177_15330338261426280 - Supplemental material for Transformer-Based Deep Learning Model Using MRI-Derived Microvascular Atlas for Predicting Lymphovascular Invasion in Breast Cancer Patients
Supplemental material, sj-docx-1-tct-10.1177_15330338261426280 for Transformer-Based Deep Learning Model Using MRI-Derived Microvascular Atlas for Predicting Lymphovascular Invasion in Breast Cancer Patients by Hui Zhang, Qiaomei Zhao, Qian Wang, Yan Zhu, Yating Wang, Wenting Guan, Bo Zhu and Genji Bai in Technology in Cancer Research & Treatment
Footnotes
Abbreviations
Acknowledgments
Contributions: (I) Manuscript writing: All authors; (II) Final approval of manuscript: All authors.
Ethics Approval and Consent to Participate
This study was performed in line with the principles of the Declaration of Helsinki and was approved by the Ethics Committee of The Huai’an Maternity and Child Clinical College of Xuzhou Medical University (Approval No.2025028) and the Ethics Committee of The Affiliated Huaian No.1 People's Hospital of Nanjing Medical University (Approval No.YX-Z-2023-063-01). The requirement for written informed consent was waived because of the retrospective design of the study.
Author Contributions Statement
Hui Zhang and Qiaomei Zhao contribute equally to this work. Hui Zhang, Qiaomei Zhao and Genji Bai contributed to the conception of the study. Qian Wang, Yan Zhu, Wenting Guan and Yating Wang performed the data measurement. Hui Zhang and Bo Zhu performed the model development. Hui Zhang, Qian Wang and Qiaomei Zhao contributed significantly to analysis and manuscript preparation. Hui Zhang and Genji Bai performed the data analysis and wrote the manuscript. Qiaomei Zhao, Qian Wang, Yan Zhu, Yating Wang, Wenting Guan and Bo Zhu helped perform the analysis with constructive discussions. All authors contributed to the article and approved the submitted version.
Funding
The authors disclosed receipt of the following financial support for the research, authorship, and/or publication of this article: This work was supported by the Health and Medical Research Project of the Jiangsu Province Huai’an Basic Research Program (Joint Special Project), (grant number No. HABL2023061).
Declaration of Conflicting Interests
The authors declared no potential conflicts of interest with respect to the research, authorship, and/or publication of this article.
Data Availability Statement
The datasets generated during and/or analysed during the current study are available from the corresponding author on reasonable request.
Supplemental Material
Supplemental material for this article is available online.
References
Supplementary Material
Please find the following supplemental material available below.
For Open Access articles published under a Creative Commons License, all supplemental material carries the same license as the article it is associated with.
For non-Open Access articles published, all supplemental material carries a non-exclusive license, and permission requests for re-use of supplemental material or any part of supplemental material shall be sent directly to the copyright owner as specified in the copyright notice associated with the article.