
Abstract
Keywords
Introduction
Lung cancer remains one of the leading malignancies worldwide in both incidence and mortality.1,2 Treatment options for patients with advanced-stage lung cancer are extremely limited.3,4 Anlotinib, an orally administered multi-targeted anti-angiogenic agent, was approved by the China National Medical Products Administration on May 9, 2018, for third-line treatment in patients with advanced non-small cell lung cancer (NSCLC). 5 In recent years, its use has expanded to include advanced small cell lung cancer as well. 6 Clinical data have shown that anlotinib significantly prolongs progression-free survival (PFS) and overall survival (OS) in patients with advanced lung cancer.7,8
Radiomics, an emerging analytical method, extracts high-throughput quantitative features from medical images and combines them with bioinformatics tools for analysis. This approach provides new avenues for disease diagnosis, treatment response evaluation, and prognosis prediction. 9 It has been widely applied in predicting therapeutic efficacy and prognosis across various cancers.10,11
However, comprehensive studies combining radiomics and the efficacy of anlotinib in advanced lung cancer remain relatively limited. Specifically, research focusing on survival analysis based on radiomics-driven efficacy prediction is scarce. 12
Therefore,this study aims to construct a predictive model based on chest CT radiomics features to explore the efficacy of anlotinib in patients with advanced lung cancer and to further analyze its impact on patient survival outcomes.
Materials and Methods
This study was reported in accordance with the TRIPOD guidelines. 13
Patient Selection and Clinical Data
This retrospective study collected data from 68 patients with advanced lung cancer treated with anlotinib monotherapy at a tertiary grade-A hospital in China between January 2021 and July 2024. The clinical data collected included gender, age, Eastern Cooperative Oncology Group (ECOG) performance status, pretreatment tumor markers such as carcinoembryonic antigen (CEA), neuron-specific enolase (NSE), cytokeratin 19 fragment (CYFRA21-1), and PFS. Additionally, chest CT images of patients before treatment were obtained. Flow-diagram of study was shown in Figure 1.

Flow-Diagram of Study.
Treatment and Evaluation Criteria
Treatment
Patients with advanced lung cancer received anlotinib monotherapy. The prescribed dosage of anlotinib was 14 mg/day, administered for two consecutive weeks followed by a one-week break as one treatment cycle. For patients with intolerable side effects, the dosage could be reduced to 8 mg/day. Efficacy was evaluated after at least two treatment cycles.14,15 No other medications, such as targeted agents, were administered concurrently during the period of anlotinib treatment.
Efficacy Evaluation
Treatment efficacy was assessed according to the Response Evaluation Criteria in Solid Tumors (RECIST 1.1). 16 Patients were classified into the following categories: complete response (CR), partial response (PR), stable disease (SD), and progressive disease (PD). The specific classifications were as follows: CR: Complete disappearance of all target lesions, sustained for at least 4 weeks. PR: A reduction of at least 30% in the sum of the diameters of target lesions compared with baseline, sustained for at least 4 weeks. SD: Lesion shrinkage that did not meet the criteria for PR, or lesion enlargement that did not meet the criteria for PD. PD: An increase of at least 20% in the sum of the diameters of target lesions compared with the smallest recorded value, with an absolute increase of at least 5 mm, or the appearance of new lesions. In this study, patients with CR, PR, and SD were categorized into the control group, while those with PD were placed in the observation group.
Eastern Cooperative Oncology Group (ECOG) Performance Status
The ECOG performance status was used as one of the study variables. The scale ranges from 0 to 5, with 0 indicating fully active with no limitations; 1 indicating restricted in physically strenuous activity but able to carry out light work; 2 indicating capable of self-care but unable to work, with more than 50% of waking hours spent out of bed; 3 indicating limited self-care, with more than 50% of waking hours spent in bed or sitting; 4 indicating completely disabled and confined to bed or chair; and 5 indicating death.17,18
Imaging, Segmentation, and Feature Extraction
Imaging
All patients underwent chest CT scans prior to anlotinib treatment. CT scans were performed using a Siemens Somatom CT machine with the following parameters: tube voltage of 120 kV, current of 109 mA, and slice thickness and interval both set to 1 mm.
Segmentation and Feature Extraction
All chest CT images were exported via the PACS system and processed using 3D Slicer software (version 5.2.1) as follows: Lesion segmentation: A radiologist (Reader A) with 5 years of experience in thoracic oncology imaging manually delineated the three-dimensional regions of interest (ROIs) of the tumors. All segmentations were performed in a blinded manner, with the reader unaware of the patients’ treatment responses to anlotinib. Feature extraction: Radiomics features were extracted using the PyRadiomics plugin (version 3.0.1), including four categories: first-order statistical features (18 features), three-dimensional shape features (14 features), texture features (68 features, including GLCM, GLRLM, GLSZM, GLDM, and NGTDM), and wavelet-transformed features (744 features).Reproducibility assessment: One month later, a second radiologist (Reader B) with equivalent qualifications re-segmented 20 randomly selected cases from the training set. Feature stability was evaluated using the intraclass correlation coefficient (ICC), and features with ICC > 0.75 were retained for subsequent analysis.
Feature Selection and Radiomics Model Construction
The extracted features were subjected to screening using the least absolute shrinkage and selection operator (LASSO) method, with L1 regularization applied to reduce redundant features. Ten-fold cross-validation was employed to determine the optimal penalty parameter (λ), achieving the best balance between model complexity and predictive performance. Features with non-zero coefficients were retained for inclusion in binary logistic regression, and a radiomics score (Radscore) was calculated for each patient based on the model formula.
Clinical Model Construction and Combined Model
Clinical data, including age, gender, smoking history, ecog score, CEA, NSE, CYFRA21-1, neutrophil-to-lymphocyte ratio (NLR), and platelet-to-lymphocyte ratio (PLR), were subjected to univariate analysis. Variables with a P-value < .1 were included in a multivariate logistic regression model using forward and backward stepwise selection to identify the final predictive factors for constructing the clinical model. The radiomics score (Radscore) was combined with the selected clinical factors to build the combined model.
Follow-Up
Patients underwent follow-up chest CT scans every two months (after two treatment cycles) to assess tumor response. Efficacy was evaluated according to RECIST 1.1 criteria. OS, the secondary endpoint of this study, was defined as the time from the start of treatment to either tumor progression, death, or the last follow-up. The last follow-up was on July 1, 2024. Kaplan-Meier curves were generated to compare survival outcomes between patients classified as having progressed disease based on treatment response after two cycles and those classified as having progression by the optimal model prediction.
Statistical Analysis
Data analysis was performed using R version 4.4.1 and SPSS version 27. Descriptive statistics were presented as mean ± standard deviation or median and interquartile range for normally and non-normally distributed continuous variables, respectively. Group comparisons for normally distributed data were conducted using t-tests, while the Mann-Whitney U test was used for non-normally distributed data. Categorical variables were summarized as percentages and compared using the Chi-square test. Binary logistic regression was used for variables with statistical significance. The optimal model was visualized using a nomogram, and receiver operating characteristic (ROC) curves were generated to evaluate model discrimination, calibration curves for model calibration, and decision curve analysis (DCA) for assessing clinical net benefit at various risk thresholds. DeLong's test was used to compare the area under the curve (AUC) between models. A P-value < .05 was considered statistically significant.
Outcomes
Baseline Characteristics
The baseline characteristics of the 68 patients with advanced lung cancer treated with anlotinib monotherapy are presented in Table 1. After at least two treatment cycles, 47 patients (classified as complete response, partial response, or stable disease) showed no disease progression, while 27 patients experienced disease progression. Significant differences were observed in ecog scores, NLR, and PLR between the two groups (P < .05).
Baseline Characteristics of Patients Stratified by Treatment Response.

Construction of the Radiomics Model
Radiomics Analysis
The extracted features were subjected to screening using the LASSO method, with L1 regularization applied to reduce redundant features. Ten-fold cross-validation was employed to determine the optimal penalty parameter (λ), achieving the best balance between model complexity and predictive performance. Features with non-zero coefficients were retained for inclusion in binary logistic regression, and a radiomics score (Radscore) was calculated for each patient based on the model formula (Figure 2).

(A) Selection of the Tuning Parameter λ in the LASSO Model. (B) Three Non-Zero Coefficient Features Obtained Based On the Optimal λ.
Construction of the Radiomics Model
The three radiomic features selected in 3.2.1 were: wavelet-HLL-glcm-Imc1, wavelet-HHL-glszm-LowGrayLevelZoneEmphasis, and wavelet-HHH-ngtdm-Coarseness. These features were incorporated into a multivariate logistic regression model, resulting in the following radiomics model expression:
radmodel = 0.431-0.032wavelet-HLL-glcm-Imc1-12.66wavelet-HHL-glszm-LowGrayLevelZoneEmphasis (Note: The feature wavelet-HHH-ngtdm-Coarseness was excluded from the final model due to a near-zero coefficient).
The radiomics score (RadScore) was calculated using this formula for subsequent integration into the combined model.
Construction of the Clinical Model
Clinical variables with a P-value < .1 from univariate analysis were included in a forward and backward stepwise multivariate logistic regression. Two significant variables, the NLR and Eastern Cooperative Oncology Group (ECOG) score, were selected. The clinical model was constructed as follows:
Construction of the Combined Model
The combined model was developed by integrating the RadScore with the significant clinical factors. The combined model expression was as follows:
A nomogram was constructed to visualize the combined model, as shown in Figure 3.

Nomogram of the Combined Model Predicting the Efficacy of Anlotinib. “Radscore” Represents the Radiomics Score (Radscore), “nlr” Represents the Neutrophil-to-Lymphocyte Ratio, and “Ecog” Represents the Ecog Score.
Model Evaluation
Evaluation Using Receiver Operating Characteristic (ROC) Curves
The ROC curve analysis showed that the AUC for the radiomics model (RadModel) was 0.721 (95% CI: 0.589-0.854). The AUC for the clinical model (CliModel) was 0.812 (95% CI: 0.699-0.924). The AUC for the combined model (CombineModel) was 0.866 (95% CI: 0.757-0.975). Pairwise Delong tests revealed that the differences between the models were statistically significant (P < .05 for all comparisons). See Figure 4A.
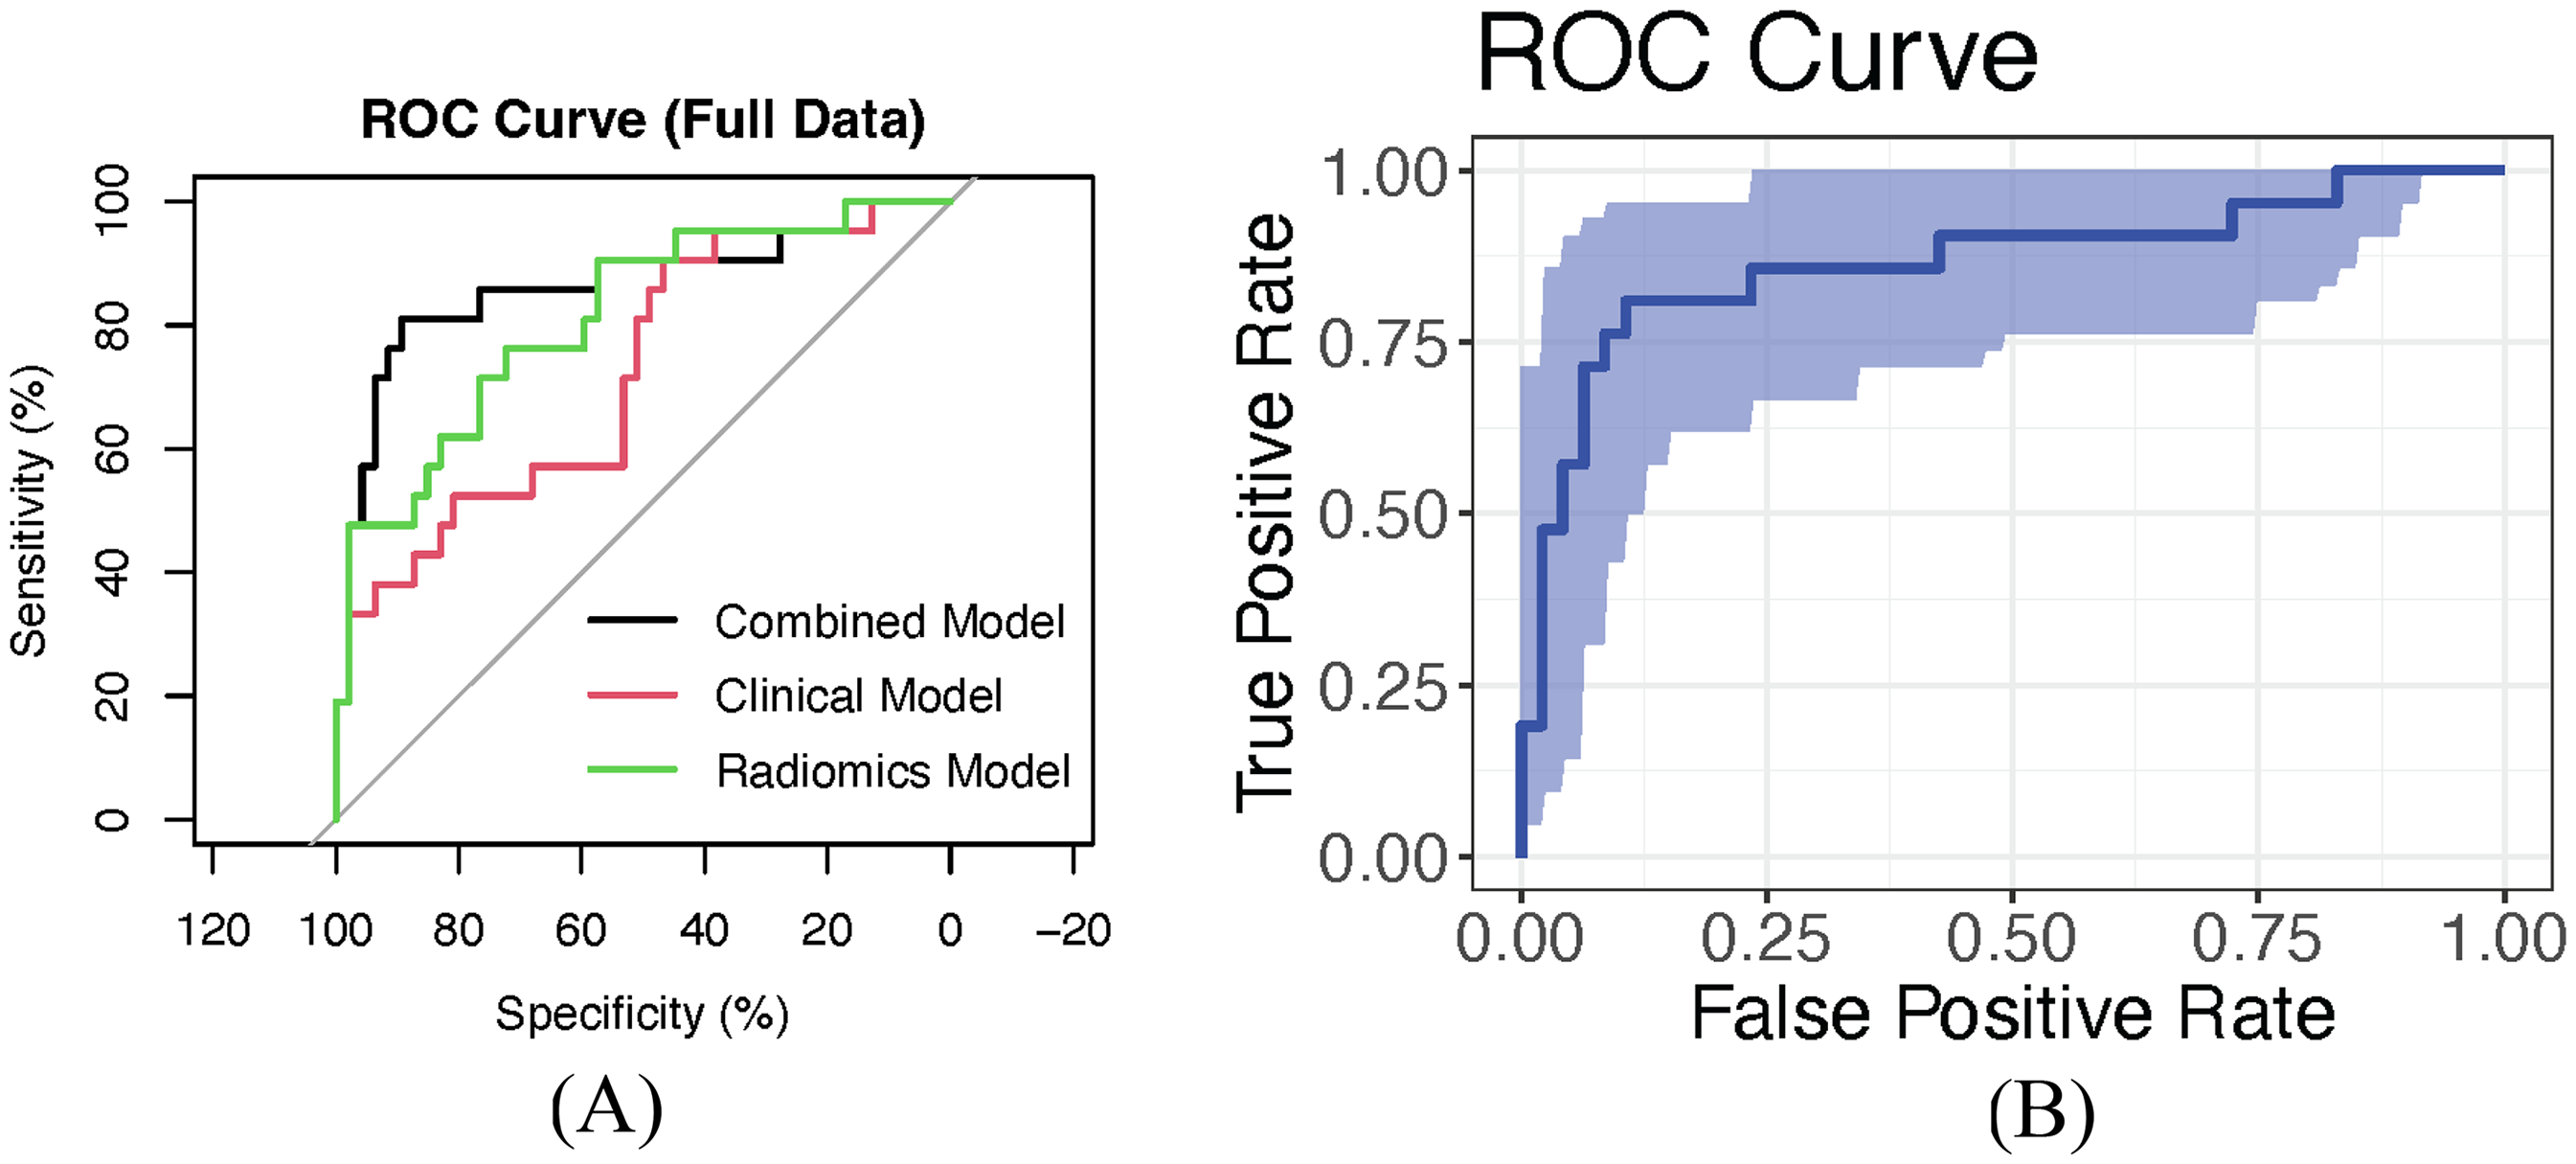
(A) ROC Curves for the Radiomics Model, Clinical Model, and Combined Model Predicting the Efficacy of Anlotinib. (B) ROC Curve for the Combined Model, Internally Validated Using 500 Bootstrap Resamples, with an AUC of 0.866 (95% CI: 0.751-0.967). The Shaded Area Represents the 95% Confidence Interval of the AUC.
The best-performing model, the combined model (CombineModel), was further validated internally using bootstrap sampling with 500 iterations. In the validation set, the AUC of the combined model was 0.866 (95% CI: 0.751-0.967), as shown in Figure 4B.
Model Calibration Evaluation
The calibration of the clinical model, radiomics model, and combined model was assessed using the Hosmer-Lemeshow test. The results were as follows: for the clinical model, X² = 7.178623, P = .6185282; for the radiomics model, X² = 7.57307, P = .0404625; and for the combined model, X² = 7.810795, P = .5533204. The calibration curve for the combined model is shown in Figure 5.

Calibration Curve for Predicting the Efficacy of Anlotinib in Advanced Lung Cancer Patients Using the Combined Model.
Clinical Decision Curve
The decision curve analysis showed that the combined model provided a net benefit and clinical value within the threshold range of 0.15 to 0.85 (Figure 6).

Clinical Decision Curve for Predicting the Efficacy of Anlotinib in Advanced Lung Cancer Patients Using the Combined Model.
Survival Prediction
As of July 1, 2024, all patients had completed follow-up. TEfficacy-based subgroup analysis revealed significantly prolonged median PFS in the anlotinib-responsive group (409 days; 95% CI: 224 days-not reached) compared to the non-responsive group (72 days; 95% CI: 59-176 days), with this difference being statistically significant (log-rank P = 5.02 × 10⁻¹¹).Risk-stratified analysis using the combined model demonstrated superior median PFS in the low-risk group (321 days; 95% CI: 206-not reached) versus the high-risk group (90 days; 95% CI: 69-211 days; log-rank P = .00114). The 6-month PFS rate was markedly higher in the anlotinib-responsive group (75.02%) than in the non-responsive group (20.17%), with log-rank testing confirming statistically significant between-group differences (P < .0001). Similarly, the model-predicted 6-month PFS rates showed significant discrimination between risk groups (low-risk: 47.3% vs high-risk: 73%; log-rank P = .0011), indicating robust risk stratification capability (Figure 7).

(A) Shows the Kaplan-Meier Survival Curves Based On the Actual Efficacy of Anlotinib in Advanced Lung Cancer Patients (Group = 0 Indicates Effective, Group = 1 Indicates Ineffective). (B) Shows the Kaplan-Meier Survival Curves Based On the Predicted Efficacy of Anlotinib by the Combined Model (Predmodel1 = High Indicates Effective, Predmodel1 = Low Indicates Ineffective). The X-Axis Represents Time in Days, and the Shaded Area Represents the 95% Confidence Interval of Survival Probability.
Discussion
We developed and validated a novel integrated model combining thin-section chest CT radiomics with clinical features to predict treatment response and prognosis in advanced lung cancer patients receiving anlotinib. As a broad-spectrum oral antiangiogenic agent developed in China, anlotinib has gained widespread clinical application for advanced lung cancer.19–22 While chest CT remains the standard imaging modality for therapeutic evaluation, radiomics provides a transformative approach by extracting quantitative imaging features that capture tumor heterogeneity beyond visual assessment.23,24
Radiomics Model Construction
The LASSO regression-selected radiomics model achieved an AUC of 0.721 (95% CI: 0.589-0.854), demonstrating the predictive value of wavelet-HLL-glcm–Imc1 and wavelet-HHL-glszm-LowGrayLevelZoneEmphasis features. These wavel- et-transformed features may reflect tumor vascularity - particularly relevant si-nce anlotinib primarily exerts antitumor effects through angiogenesis inhibition. Our findings align with Cui's research suggesting wavelet features can indirectl-y characterize tumor vasculature. 25 However, as radiomics alone may not fully capture patients’ clinical status, we pursued multimodal integration.26,27
The Clinical Model in This Study
Through univariate analysis and stepwise regression, we identified NLR (reflecting systemic inflammation) and ECOG performance status as key predictors. The clinical model showed superior performance (AUC = 0.812, 95% CI: 0.699-0.924), underscoring the prognostic value of host factors. 28
The Combined Model in the Study
The combined radiomics-clinical model demonstrated significantly enhanced predictive accuracy (AUC = 0.866, 95% CI: 0.757-0.975), providing a robust tool for personalized therapeutic decision-making.29,30
Model Validation
Bootstrap internal validation confirmed model stability (AUC = 0.866, 95% CI: 0.751-0.967). Excellent calibration was evidenced by Hosmer-Lemeshow testing (χ² = 7.81, P = .553). Decision curve analysis revealed substantial clinical net benefit across threshold probabilities of 15%-85%.
Survival Analysis
The model effectively stratified patients into distinct prognostic groups (log-rank P < .05). While predicted median survival (low-risk: 321 days; high-risk: 95 days) showed some deviation from observed outcomes (responders: 409 days; non-responders: 72 days), the model maintained strong discriminative ability. Multivariable Cox regression confirmed the nomogram score as an independent OS predictor (HR = 1.263, 95% CI: 1.090-1.463, P = .002).
Model Benefits, Challenges and Next Steps
The combined model developed in this study demonstrates certain innovations and clinical value. A review of the literature shows that most predictive models focus on NSCLC, such as the anlotinib prediction model for NSCLC developed by Chen et al 23 In contrast, this study includes patients with small cell lung cancer (SCLC), offering the first radiomics-based efficacy prediction exploration for SCLC patients. Although this study includes advanced lung cancer patients with different pathological types (including SCLC, squamous cell carcinoma, and adenocarcinoma), a statistical test was performed on the pathological distribution between the effective and ineffective anlotinib groups. The results showed a Z-value of 3.090 and a P-value of .378, suggesting no significant difference in pathological type distribution between the two groups. Therefore, despite not including pathological type as a model variable, this result indicates its limited influence on treatment efficacy grouping and is unlikely to be a significant source of bias.
Secondly, the features used in the model are all derived from routine CT scans performed before medication. This allows clinicians to perform risk assessments and predict survival time before making treatment decisions. Furthermore, since anlotinib is a high-cost drug and patients often face a significant financial burden, this model provides evidence-based treatment recommendations for advanced-stage patients. Clinically, the combined model can be used to predict the efficacy of anlotinib for a specific advanced lung cancer patient. If the model's prediction is favorable, a doctor can consider prescribing anlotinib and predicting the patient's survival time, based on the patient's overall condition and financial capacity. This can help avoid unnecessary financial expenses and enhance the patient's confidence in treatment. Conversely, if the prediction suggests poor efficacy, alternative treatment plans can be considered.
Despite the significant predictive capabilities of the combined model, several limitations must be addressed. First, due to the relatively small sample size and the diverse tumor morphologies of patients receiving anlotinib, there were challenges in outlining ROIs and extracting features. This, combined with the limited sample size, may increase the risk of overfitting in the radiomics model. Moreover, image delineation was performed manually, and while consistency was evaluated through repeated segmentation, the potential for subjectivity cannot be entirely avoided. 31
Additionally, the Eastern Cooperative Oncology Group (ECOG) performance status has a strong subjective component, which can lead to inter-rater variability. The NLR is susceptible to various non-tumor factors, such as infections or stress responses, which may interfere with its accuracy in cancer prognosis.32,33 This study was a retrospective analysis, which may be subject to selection bias, and some clinical data were incomplete. Finally, this study did not perform a stratified analysis on dose adjustments, so the potential impact of dose on radiomics and biomarkers cannot be completely ruled out. Future research should consider controlling for dose in the study design or evaluating its effect through subgroup analysis. Therefore, future studies should consider conducting prospective, multi-center, large-scale studies to further validate the predictive performance and clinical application value of the model.
Conclusion
This study demonstrates that a combined model based on chest CT radiomics and clinical features has significant clinical value in predicting the efficacy and prognosis of anlotinib in advanced lung cancer patients. Despite some limitations, the results of this study provide a valuable reference for developing personalized treatment strategies in the future. Larger-scale prospective studies will help confirm these findings and advance the application of precision medicine in lung cancer treatment.34–36
Footnotes
Abbreviations
Ethics Approval
This study was approved by the Ethics Committee of Dazhou Central Hospital (Approval No. 2022-YX-071). All procedures involving human participants were conducted in accordance with the ethical standards of the institutional research committee and the Declaration of Helsinki, as well as any relevant national regulation.
Consent to Participate
Informed consent was obtained from all participants included in the study.
Funding
The authors disclosed receipt of the following financial support for the research, authorship, and/or publication of this article: This work was supported by the the Key Research and Development Program of Sichuan Science and Technology Department, (grant number 2023YFS0469).
Declaration of Conflicting Interests
The authors declared no potential conflicts of interest with respect to the research, authorship, and/or publication of this article.
Data Availability
The datasets generated during and/or analysed during the current study are available from the corresponding author on reasonable request.