
Abstract
Background
Traditional dynamic contrast-enhanced MRI (DCE-MRI) radiomics approaches for predicting lymphovascular invasion (LVI) in invasive breast cancer (IBC) frequently neglect the importance of dynamic phase alterations, and their diagnostic efficacy is often constrained by limited sample sizes. We have developed the Tabular Prior-data Fitted Network (TabPFN) algorithm, which synergistically combines clinical and MR morphological features with delta-radiomics, thereby substantially improving the performance of binary classification.
Method
In this retrospective study, 276 IBC patients were divided into a training group (n = 193, 70%) and a validation set (n = 83, 30%). A radiomic score (Radscore) was developed using 1239 radiomic features derived from lesion masks in delta images, establishing the delta-radiomics model. To preoperatively predict LVI, we utilized the TabPFN algorithm alongside traditional machine learning methods. This approach combined the Radscore with both clinical and MR morphological features for binary classification.
Results
The delta-radiomics model achieved an area under the curve (AUC) of 0.775. Among the evaluated machine learning models, the TabPFN algorithm demonstrated superior performance by effectively integrating the Radscore along with clinical and MR morphological features, resulting in an AUC of 0.899. Additionally, it recorded an accuracy of 0.88, a precision of 0.667, a recall of 0.571, and an F1-score of 0.615.
Conclusion
Delta-radiomics analysis shows potential for predicting preoperative LVI in IBC patients. To tackle small sample sizes, we developed the TabPFN algorithm, combining clinical and MR morphological features with Radscore, enhancing binary classification and demonstrating strong predictive performance.
Keywords
Introduction
Breast cancer accounts for 24.2% of cancer cases worldwide, with disproportionately higher incidence rates observed among women in developed regions. 1 Lymphovascular invasion (LVI) is recognized as a crucial histopathological marker of invasive breast cancer (IBC), characterized by the infiltration of tumor cells into lymphatic or vascular channels. This phenomenon occurs in 20-30% of cases and carries significant prognostic implications. 2 Beyond its role in histological characterization, LVI serves as a pivotal determinant in clinical decision-making, particularly for operable IBC patients with lymph node involvement. Its presence correlates with elevated risks of locoregional recurrence, distant metastasis, and diminished survival rates.3-5 Consequently, this pathological characteristic greatly impacts therapeutic strategies, often requiring more aggressive surgical interventions, such as mastectomy instead of breast-conserving surgery, as well as intensified radiotherapy protocols or guiding decisions regarding adjuvant chemotherapy.6,7 Despite its clinical importance, the preoperative identification of LVI remains problematic due to the inherent limitations of biopsy-based sampling methods, which are prone to sampling errors and may inadequately assess intratumoral heterogeneity. 8
Magnetic resonance imaging (MRI), particularly dynamic contrast-enhanced MRI (DCE-MRI), has emerged as a noninvasive tool for characterizing tumor angiogenesis and providing vital information about the tumor's vascular system, which contributes significantly to the rapid growth of malignant tumors and intratumoral heterogeneity. 9 Building on these advances, recent developments in radiomics enable the quantitative extraction of high-dimensional imaging features, effectively capturing subtle tumor heterogeneity and demonstrating potential value for predicting LVI in IBC.10,11 However, existing research has primarily concentrated on analyzing pre- and first post-contrast DCE-MRI to evaluate LVI status, often neglecting the dynamic changes in angiogenesis that can reflect variations in tumor heterogeneity and aggressiveness.10,11 Delta-radiomics, which analyzes temporal changes in DCE-MRI features (eg, pre- and first post-contrast phases), investigates the relative net change in subtracted images across a series of longitudinal images. This emerging field integrates time components, enabling the quantification of hemodynamic changes,12,13 and has shown superior performance in predicting LVI in IBC. 14
Previous studies on radiomics analysis have typically relied on logistic regression for model construction following dimensionality reduction.8,12-14 However, these studies often overlook advanced machine learning approaches that provide greater flexibility for addressing complex feature interactions, particularly in scenarios involving small sample sizes (eg, n < 1000), where conventional methods face heightened risks of overfitting and suboptimal generalizability. 15 To address this gap, journal Nature recently featured the Tabular Prior-data Fitted Network (TabPFN), a foundational model based on transformers that amalgamates Prior-Data Fitted Networks with a generative architecture. 16 TabPFN is pre-trained on millions of synthetic datasets using structural causal models, allowing it to approximate Bayesian predictions through in-context learning. Unlike traditional iterative methods, TabPFN processes entire datasets in a single forward pass, utilizing a dual-attention mechanism to manage interactions at both the sample and feature levels. This design ensures invariance to permutations of samples or features, making it uniquely suited for heterogeneous tabular data. By significantly outperforming conventional methods (eg, gradient-boosted trees) in small-to-medium datasets (≤10,000 samples) while requiring minimal training time, TabPFN mitigates overfitting risks and captures nonlinear relationships and multi-modal distributions. 16
Building on this advancement, this study applies TabPFN alongside other machine learning algorithms to analyze delta-radiomics and MR morphological features for predicting LVI in patient with IBC. This approach aims to establish a robust and efficient predictive tool to guide surgical decision-making and preparative management, addressing the critical need for precision in oncology workflows where traditional radiomics pipelines often fall short due to their reliance on simplistic statistical assumptions. We present this article in accordance with the TRIPOD reporting checklist. 17
Materials and Methods
Patient Enrollment
The protocol for this retrospective study was approved by the Xiangtan Central Hospital Review Board (approval number: 2024-01-002) in compliance with the Declaration of Helsinki. The requirement for informed consent was waived due to the use of anonymized data. From June 2019 to June 2024, a consecutive cohort of 489 female patients suspected of having IBC underwent preoperative breast MRI scans. The inclusion criteria were as follows: (i) primary breast lesions detectable on MRI, (ii) postoperative pathological confirmation of IBC, and (iii) surgery conducted within 14 days of the MRI. The exclusion criteria were: (i) significant artifacts present on MR imaging, (ii) patients who had undergone preoperative chemotherapy or chemoradiotherapy, and (iii) cases of bilateral breast cancer. A flow diagram of the enrolled participants is provided in Figure 1.

Enrollment Flow Diagram. This Figure Delineates the Specific Inclusion and Exclusion Criteria Utilized for the Selection and Enrollment of Patients Diagnosed With IBC in This Study, Thereby Ensuring the Establishment of a Well-Defined and Representative Sample Population.
After applying the study's inclusion and exclusion criteria, we identified a cohort of 276 consecutive patients diagnosed with IBC, with a median age of 51 years (interquartile range [IQR] 45-58). All patients underwent surgical resection and preoperative MRI. The cohort was subsequently divided into training (n = 193) and validation (n = 83) sets using a stratified randomization approach in a 7:3 ratio. The training set had a median age of 52 years (IQR 46-58), whereas the validation set had a median age of 50 years (IQR 43.5-57).
MR Morphological Feature
The MRI protocol is detailed in Supplemental Material 1, and MR imaging data were retrieved from the institutional picture archiving and communication system (PACS). Assessments were conducted in accordance with the latest edition of the Breast Imaging Reporting and Data System (BI-RADS), specifically BI-RADS 5 (2013). 18
Two board-certified radiologists, each specializing in breast imaging and possessing over 10 years of experience, performed blinded interpretations of anonymized and randomized scans. To objectively assess the degree of agreement between the radiologists and quantify inter-observer variability, we calculated the kappa statistic. Kappa values are interpreted as follows: < 0.00: poor agreement; 0.00–0.20: slight agreement; 0.21–0.40: fair agreement; 0.41–0.60: moderate agreement; 0.61–0.80: substantial agreement; 0.81–1.00: almost perfect agreement.
MRI-reported axillary lymph node (mrALN) positivity was determined using multiparametric criteria10,11,14: (1) short-axis measurement ≥10 mm, (2) long-to-short axis ratio <1.6, (3) asymmetric cortical thickening, and (4) obliteration of hilar fat architecture. The time intensity curve (TIC) is classified into three types: Type I: persistent/progressive enhancement, in this type, the curve demonstrates a gradual and continuous increase in signal intensity over time, without exhibiting a clear peak or washout phase. Type II: plateau/stable enhancement, the curve rapidly rises to a peak, followed by a plateau phase during which there is minimal change in intensity. Type III: washout/rapid enhancement and decline, is characterized by a steep initial rise, a quick peak, and a subsequent sharp decline (“washout”) as the contrast agent exits the tumor rapidly.11,14,19-22 Besides, peritumoral edema presents as a hyperintense signal on T2-weighted images, resulting in a bright region surrounding the tumor margins.11,14,19-22 The adjacent vessel sign occurs when vascular structures either penetrate enhancing lesions or make direct contact with the lesion margins.11,14,19-22 Moreover, increased ipsilateral vascularity is defined by a minimum difference of one vessel between the cancerous breast and the unaffected breast.11,14,19-22 Internal enhancement patterns are classified into three categories: homogeneous, heterogeneous, and rim enhancement.11,14,19-22 The DWI rim sign, derived from DWI semiquantitative analysis, is characterized by hyperintense peritumoral demarcation observable on DWI images and is subclassified as complete (≥90% circumferential visualization) or incomplete (<90% lesion encapsulation).11,14,19-21,23
Image Registration and Lesion Segmentation
DCE-MRI images from the A0 and A1 phases, formatted in DICOM, were retrieved from PACS. The image preprocessing pipeline consisted of three critical stages. First, we performed intensity standardization using z-score normalization (z = [x-μ]/σ) to harmonize grayscale distributions across subjects. Second, we conducted volumetric resampling to create isotropic 1 mm³ voxels through B-spline interpolation, specifically utilizing the sitkBSpline method with order = 3. Third, we applied intensity discretization, categorizing the pixel values into five equal-width bins across the range of 0 to 255.
Following these preprocessing steps, we aligned the A0 and A1 images using an image registration algorithm, transforming the A1 image to match the anatomy and positioning of the A0 image. For the image registration process, we utilized the 3D Slicer software and employed the general registration module (Elastix), which offers several preset registration methods, including the breast-specific “3D DCE-MRI.” The registration quality was assessed qualitatively by two board-certified radiologists, each with over 10 years of experience, through a consensus review. If necessary, manual adjustments to the registrations were performed in this study. This approach is consistent with previous studies on A0 and A1 image registration in breast MRI [11, 14].
Next, we segmented the lesion mask using the A1 images. Lesion segmentation was performed in ITK-SNAP version 4.0.2, 24 where a junior radiologist manually contoured a volume of interest around the tumor to encompass its entirety. Subsequently, a senior radiologist reviewed the lesion delineation and made necessary refinements.
Delta-Radiomics Feature Extraction
After image registration and lesion segmentation, the A0 and A1 images are aligned to match anatomical structures, compensating for patient movement or scanner variations to ensure accurate pixel comparisons. Next, a crucial step in delta-radiomics involves creating a delta image by subtracting the A0 image from the A1 image. This process highlights regions of signal intensity change and correlates these changes with treatment-induced effects, such as tumor regression, growth, or necrosis. The delta image is generated through pixel-wise subtraction, allowing for detailed observation of these variations. Additionally, applying a threshold and spatial smoothing (eg, Gaussian blur) to the delta image can significantly enhance the signal-to-noise ratio, improving the overall clarity of the image. 14
Radiomics features are subsequently extracted from the lesion mask in the delta image utilizing PyRadiomics version 3.0. The features extracted encompass the gray-level co-occurrence matrix, the gray-level run-length matrix, the neighboring gray-tone difference matrix, the gray-level dependence matrix, and the gray-level size zone matrix. Additionally, various filters, such as Wavelet and Laplacian of Gaussian filters, are employed to enhance the analysis and capture additional textural information. 25
Delta-Radiomics Model
To optimize the selection of radiomics features and mitigate multicollinearity, we implemented a multi-stage dimensionality reduction strategy. The initial features screening utilized two sample Student's t-tests to identify discriminative biomarkers between the LVI-positive and LVI-negative groups. Features that demonstrated nonsignificant associations (p ≥ 0.05) with pathological labels were discarded from further analysis. Following this, we applied bivariate correlation analysis (Pearson's r) to prune redundant variables that exhibited strong intercorrelations (|r|>0.9), thereby prioritizing features with lower p-values from the initial screening.
The refined subset of features was subjected to further selection using least absolute shrinkage and selection operator (LASSO) regression within a 10-fold cross-validation framework. This approach completed the identification of radiomics features with the LASSO method, optimizing the regularization strength (λ = 0.2) through the 10-fold cross-validation process. LASSO automatically shrinks the coefficients of unimportant features to zero via L1 regularization, effectively achieving feature selection. This mechanism helps simplify the model, improve its interpretability, and reduce the risk of overfitting. Consequently, this process facilitated the identification of optimal radiomics predictors that maintained non-zero regression coefficients [11, 14].
Finally, the Rad score was calculated through a weighted summation of the selected features, determined as the dot product of the retained feature values and their corresponding LASSO-determined coefficients (Supplementary Figure S1). The equation is as follows:

Machine Learning Framework
The study design is illustrated in Figure 2. The Radscore, derived from delta-radiomics analysis, was synergistically combined with both clinical and MR morphological features, serving as composite predictors within our computational modeling framework. To enhance the preoperative prediction of LVI in patients with IBC, we employed the TabPFN algorithm along with several traditional machine learning techniques. These techniques included categorical boosting (CatBoost), linear discriminant analysis, logistic regression, random forest, gradient boosting, extreme gradient boosting (XGBoost), light gradient boosting machine (LightGBM), adaptive boosting (AdaBoost), and decision trees.

Study Design Framework. This Figure Illustrates a Block Diagram That Elucidates the Comprehensive Architecture and Workflow of the Research Design, Providing an Overview of the Methodological Approach Employed in This Investigation.
TabPFN Architecture Design
The architecture design for the TabPFN algorithm is illustrated in Figure 3. TabPFN is a transformer-based foundation model specifically designed for small-to-medium-sized tabular datasets, effectively addressing challenges such as feature heterogeneity, missing values, and permutation invariance. By leveraging in-context learning, TabPFN processes entire datasets in a single forward pass, seamlessly integrating training and inference. It implicitly encodes algorithmic behaviors associated with techniques like logistic regression and Gaussian processes by training on synthetic input-output pairs. Notably, TabPFN approximates Bayesian posterior predictions without requiring explicit gradient updates. Optimized for datasets containing up to 10,000 samples and 500 features, TabPFN strikes a balance between architectural innovation and practical efficiency, positioning it as a powerful transformer-driven solution for challenges in tabular data. 16
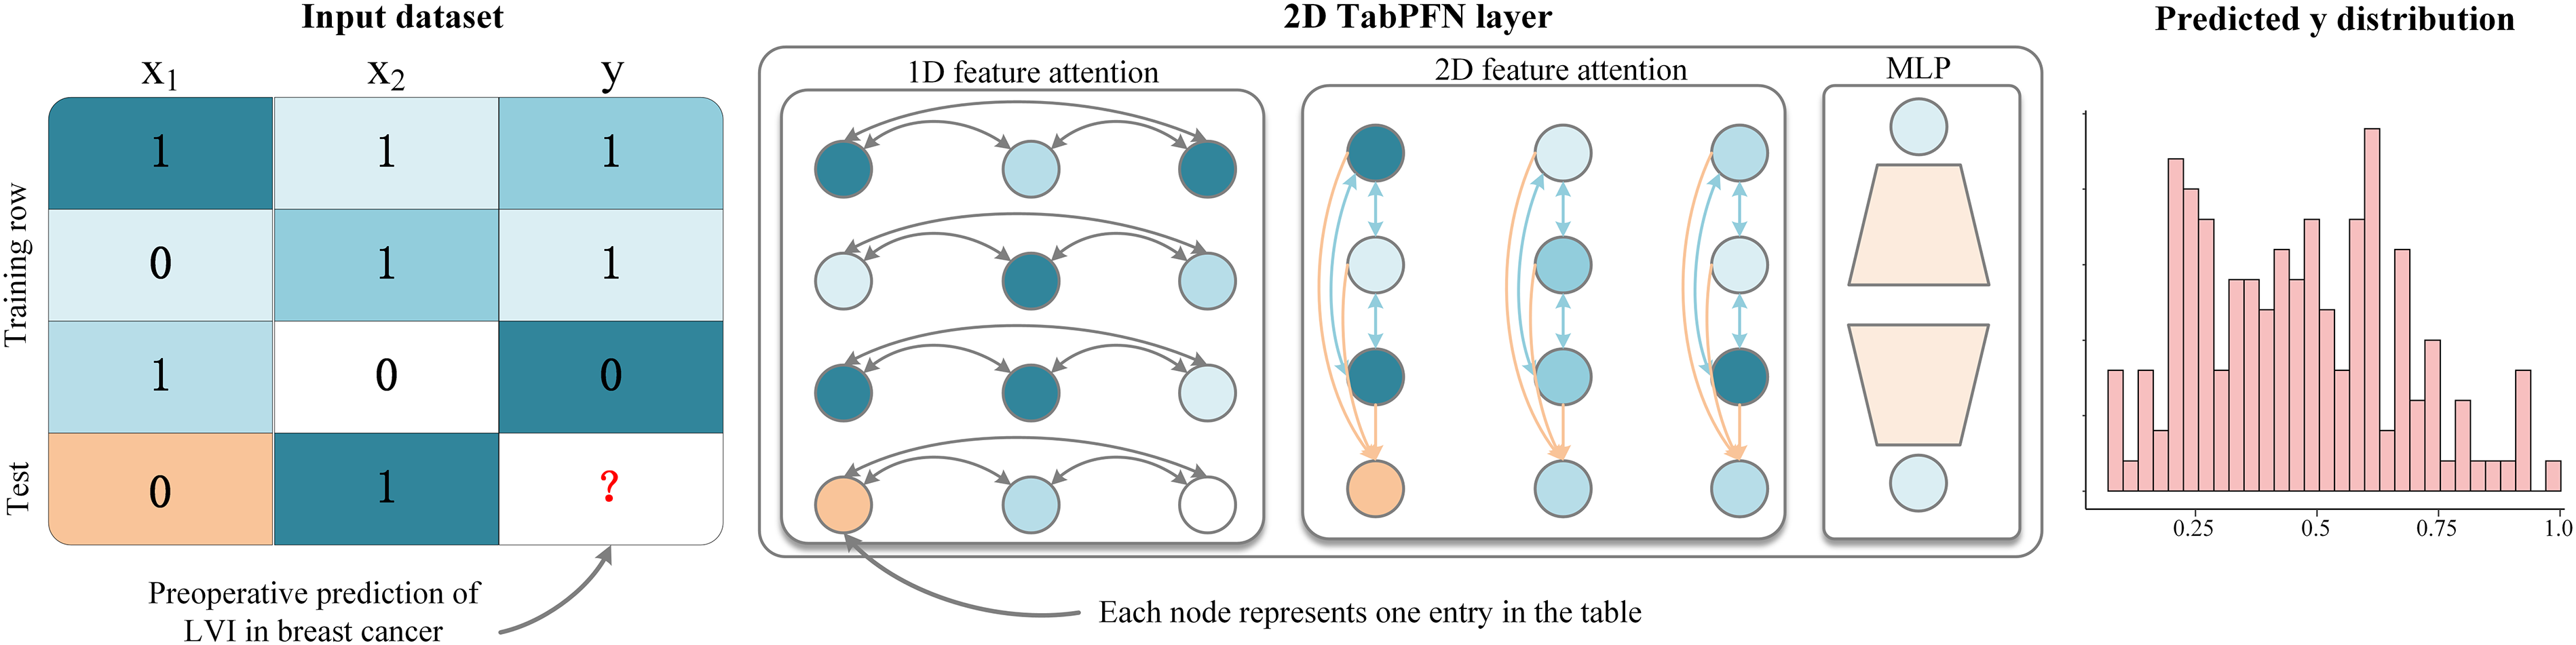
Architectural Design of the TabPFN Algorithm. This Figure Presents a Visual Representation of the TabPFN Algorithm. It Outlines the pre-Training Process and Application of the Model, Which has Been Trained on Over 100 Million Synthetic Tasks. the Architecture Represents an Adaptation of the Standard Transformer Encoder Tailored for the Two-Dimensional Data Typically Encountered in Tabular Formats.
In this study, we develop a preoperative LVI prediction model for patients with IBC using the TabPFN algorithm, focusing on multimodal feature fusion and efficient learning from small samples. The model incorporates two key preoperative predictors: (1) Radscore, a dynamic radiomics score derived from delta-radiomics analysis that quantifies tumor heterogeneity evolution; and (2) clinical and MR morphological features that include semantics like age, location, enhancement patterns, and peritumoral edema. To effectively handle feature heterogeneity, TabPFN's cell-wise independent encoding processes both numerical features (Radscore) and categorical features (location, enhancement patterns, and peritumoral edema) without the need for manual preprocessing. This approach also enhances permutation invariance for MRI-derived attributes through randomized feature embeddings. The bidirectional attention mechanism enables detailed analysis: row-wise attention identifies local interactions between Radscore and specific MR morphological features, clarifying the relationships between heterogeneity and LVI, while column-wise attention reveals global correlations through cross-sample comparisons. Robustness in small sample sizes is achieved through synthetic medical data generated via structural causal models during pre-training, which effectively simulates tumor growth causal networks and imaging noise. Furthermore, implicit Bayesian inference addresses challenges related to the scarcity of real-world data. For binary classification, critical technical components include temperature-scaled confidence calibration, which produces clinically interpretable LVI probabilities, as well as post hoc ensembling. This comprehensive approach underscores TabPFN's capacity to integrate delta-radiomics analysis with clinical and imaging semantic features, offering a scalable solution for precision binary classification in small-sample medical datasets. Detailed hyperparameter tuning information for TabPFN and other machine learning models is provided in Supplemental Material 2.
Model Selection Protocol
The evaluation of model performance primarily utilized the area under the receiver operating characteristic curve (ROC-AUC) with a 95% confidence interval (CI) as the key metric. Complementary assessments were conducted using additional indicators such as accuracy, precision, recall, and the F1-score. The classifier that exhibited the highest AUC robustness during validation analyses was identified as the optimal configuration. 26
Interpretability Analysis Framework
To enhance model interpretability, Shapley Additive Explanations (SHAP) values were implemented to quantify feature contributions hierarchically. By employing a game-theoretic method, SHAP interprets medical machine learning models through the lens of individual feature contributions to their predictions. Rooted in cooperative game theory, SHAP allocates credit to features based on their impact across all possible combinations, effectively addressing confounding interactions and nonlinearities. Importantly, it maintains additive consistency and manages multicollinearity by evaluating features in groups. By combining insights derived from SHAP with causal frameworks, we can significantly improve the design of clinical trials, optimize therapies, and enhance our understanding of outcomes across diverse populations.27-28
To achieve optimal feature subset selection, we established an iterative framework that progressively incorporates features based on SHAP-derived importance scores. This process involves cyclic retraining of classification models, where features are added sequentially, and the AUC is recalibrated on validation sets after each addition. This staged integration approach allows continuous tracking of improvement in predictions while monitoring the dynamics of AUC values for the new model. Through incremental learning cycles, gradient-based visualization techniques illustrate the individual effects of features on overall performance, revealing the quantitative relationships between changes in the feature space and variations in performance metrics throughout successive training phases.
Result
Baseline Characteristics
A total of 276 consecutive patients diagnosed with IBC were divided into training (n = 193) and validation (n = 83) sets. A comprehensive analysis of baseline characteristics, as outlined in Table 1, revealed no statistically significant differences between the groups regarding demographic, clinical, or imaging parameters (all p-values >0.05).
Comparison of Baseline Characteristics Between the Training and Test Sets.

Furthermore, all MRI morphological features achieved kappa values ranging from 0.869 to 0.936, indicating near-perfect inter-observer agreement (Table 1). Patients diagnosed with IBC more frequently exhibited peritumoral edema, mrALN status, and the DWI rim sign, all of which were associated with a higher Rad score (Supplementary Table S1).
Delta-Radiomics Analysis
A total of 1239 radiomics features were derived from lesion masks segmented on delta image. Subsequently, batch two-sample t-tests were conducted at a significance level of α = 0.05, resulting in the retention of 332 discriminative features. To refine this selection further, a pairwise correlation analysis was performed with a Pearson's correlation coefficient threshold of |r| > 0.9, which reduced the feature set to 80 non-redundant predictors. Finally, the identification of radiomics features was completed using the LASSO method, with 10-fold cross-validation optimizing the regularization strength (λ = 0.2). This process successfully identified 11 features with non-zero coefficients (Supplementary Figure S2). Additionally, the correlation heatmap for the identified radiomics features demonstrated minimal multicollinearity as well as low relevance and redundancy (Supplementary Figure S3).
Machine Learning Performance Comparison
We utilized Radscore, along with clinical and MR morphological features, as input variables for the TabPFN algorithm and several traditional machine learning techniques to preoperatively predict LVI in patients with IBC. The ROC curve analysis (Figure 4) demonstrated that among the TabPFN algorithm and traditional machine learning methods, the TabPFN algorithm excelled on these small-sized datasets, achieving an AUC of 0.899 (95%CI: 0.817-0.956) in classification tasks. Furthermore, Figure 5 provides detailed performance metrics across various machine learning models, including AUC, accuracy, recall, precision, and F1-score.

ROC Curve Analysis. This Figure Demonstrates That, Among the TabPFN Algorithm and Conventional Machine Learning Methodologies, the TabPFN Algorithm Exhibits Superior Performance.
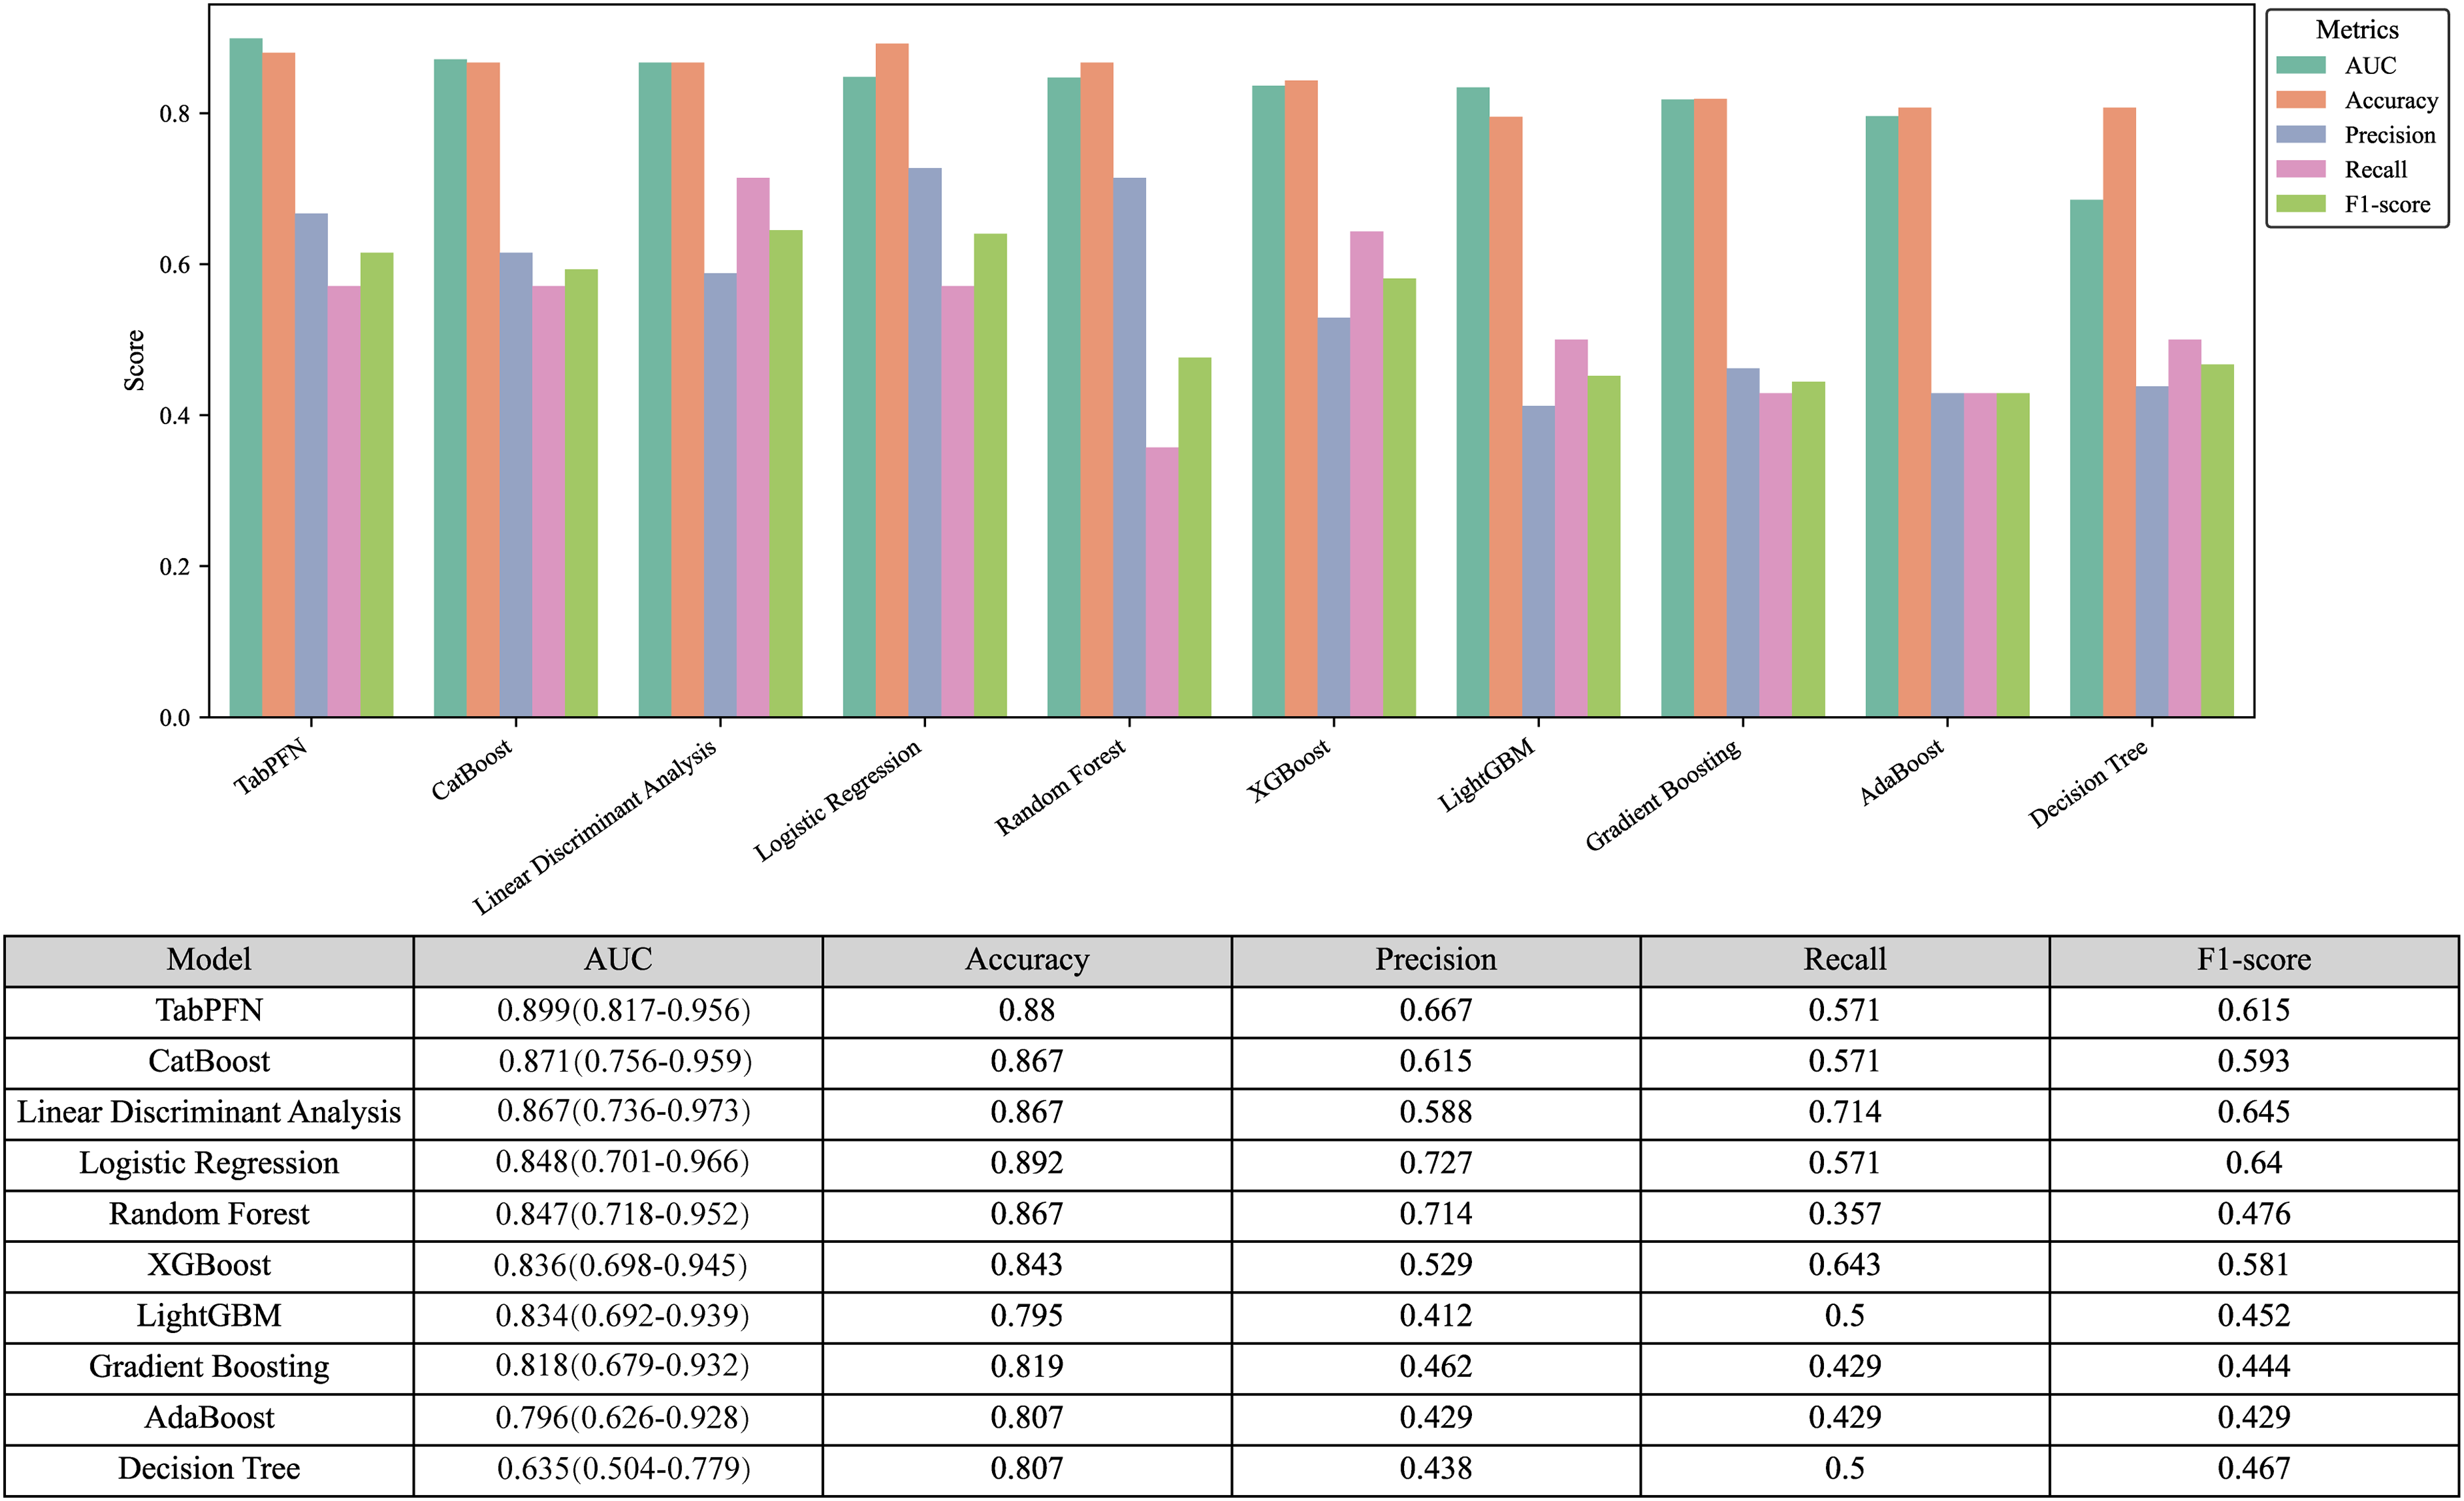
Performance Metrics Visualization. This Figure Provides an in-Depth Visualization of Key Performance Metrics Across Various Machine Learning Models, Including AUC, Accuracy, Recall, Precision, and F1-Score, Indicating That the TabPFN Algorithm Achieved the Highest AUC Among the Tested Models.
Model Interpretation
Figure 6(a-b) offers a comprehensive interpretation of the TabPFN algorithm using SHAP values, illustrated in both a beeswarm plot and a bar graph. This analysis reveals that Radscore is the feature with the most significant contribution to the model. Following Radscore, the next most important features are peritumoral edema, the DWI rim sign, mrALN status, age, the TIC curve, intratumoral necrosis, increased ipsilateral vascularity, adjacent vessel sign, and other variables.

Comprehensive Interpretation of the TabPFN Algorithm Using SHAP Values. Illustrated Through Both a Beeswarm Plot (a) and a Bar Graph (b), This Analysis Reveals That Radscore is the Feature That Contributes Most Significantly to the Model's Predictions. Following Radscore, the Next Most Influential Features Include Peritumoral Edema, the DWI Rim Sign, mrALN Status, Age, the TIC, Intratumoral Necrosis, Increased Ipsilateral Vascularity, the Adjacent Vessel Sign, and Various Other Variables.
Furthermore, Figure 7 highlights the contributions of various features to the model's predictive performance, along with their respective AUC scores. The four most influential features (Radscore, peritumoral edema, the DWI rim sign, and mrALN status), consistently exhibit significantly higher contribution values compared to the other variables. Notably, Radscore stands out with the greatest contribution, which is reflected in a marked increase in cumulative AUC value. The three subsequent features also exhibit a gradual increase in both contribution magnitude and cumulative AUC values. However, as additional features are incorporated, a gradual decline and plateau in the cumulative AUC is observed. Despite this decline, the AUC metric remains above 0.75 for all primary features, demonstrating that the model consistently maintains a satisfactory level of discriminative ability.
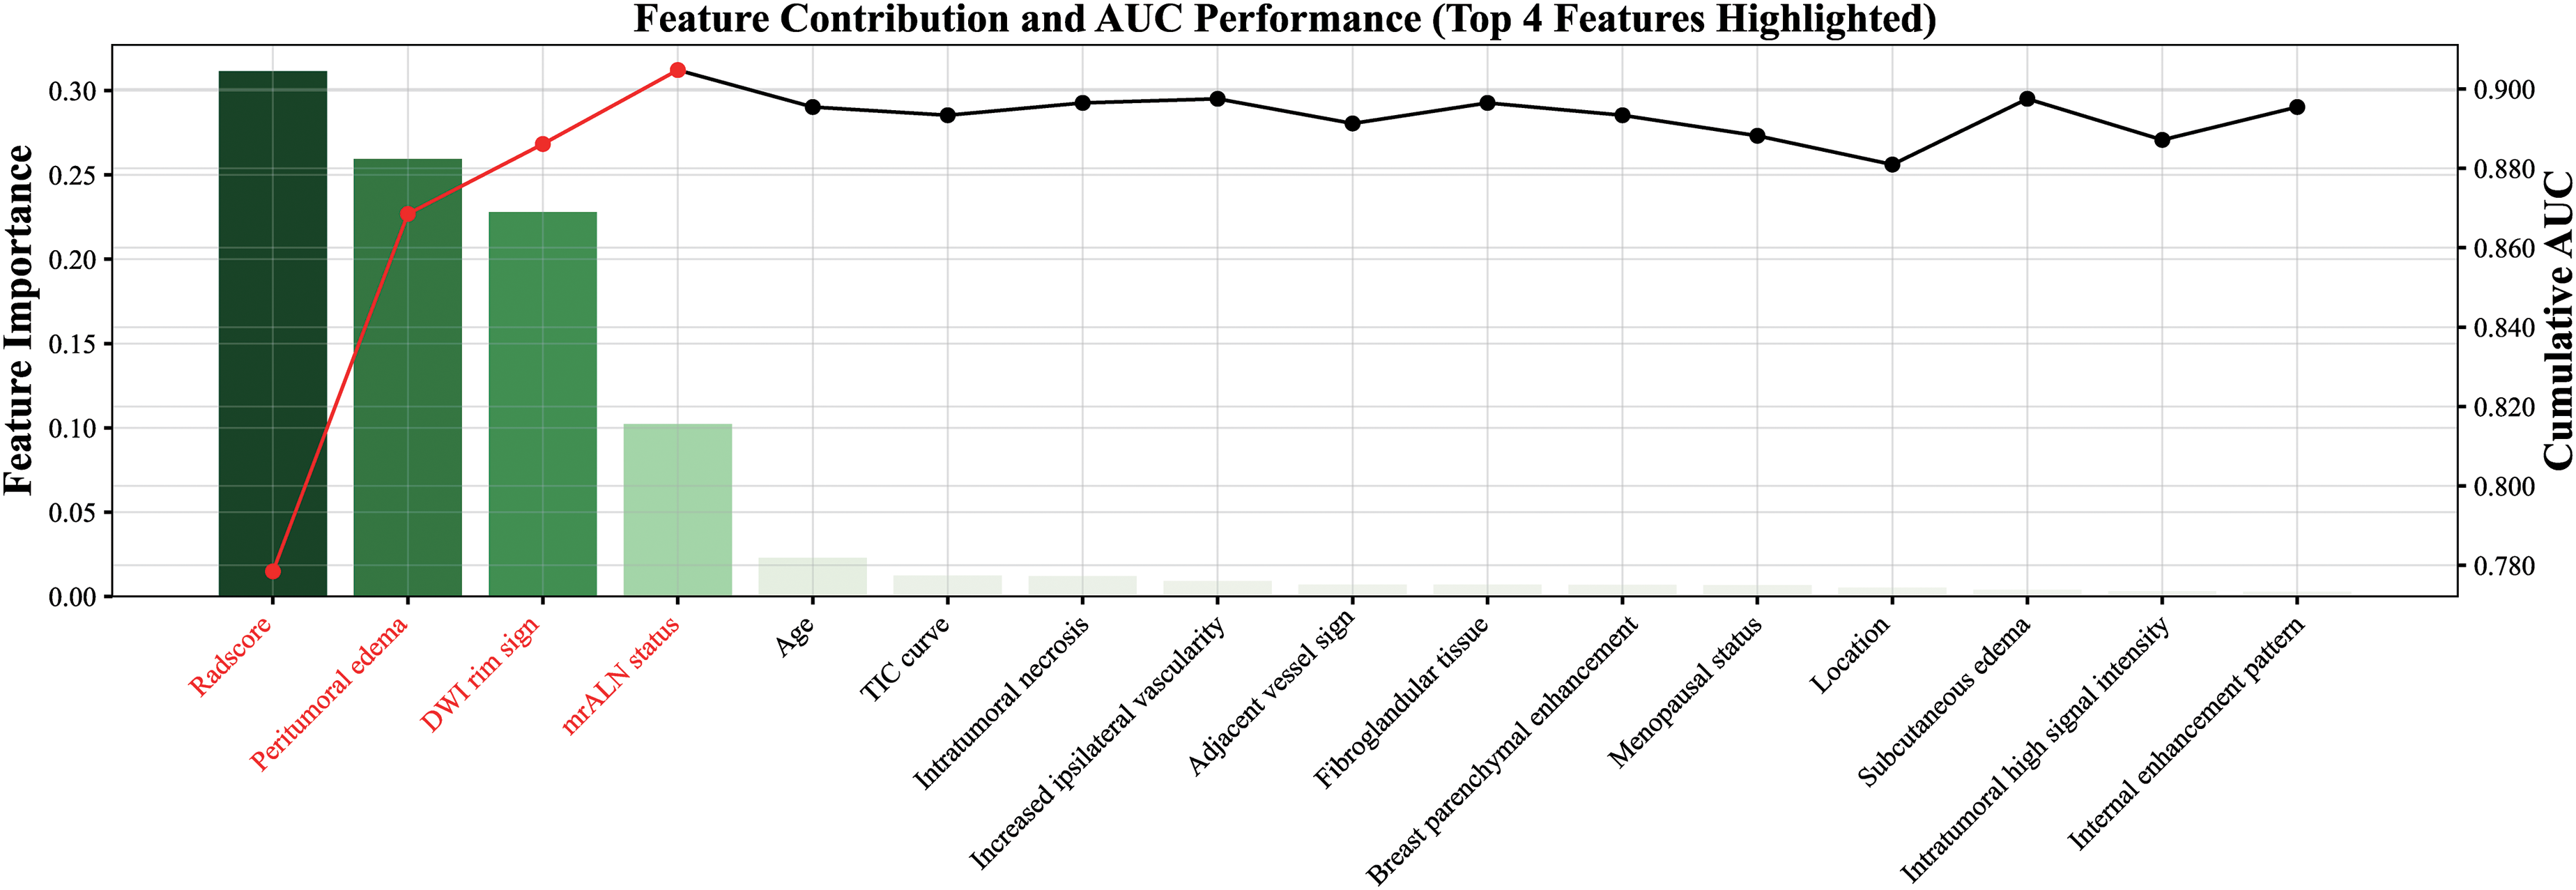
Contributions of Key Features to Predictive Performance. This Figure Illustrates the Relative Contributions of Various Features to the Model's Predictive Performance, Along With Their Corresponding AUC Scores. the Four Most Influential Features—Radscore, Peritumoral Edema, the DWI rim Sign, and mrALN Status—Consistently Display Markedly Higher Contribution Values Compared to Other Variables.
Comparative Efficiency of Hybrid Model Versus Clinical and Delta-Radiomics
In this study, we developed the TabPFN algorithm as a hybrid model that integrates clinical and MR morphological features with Radscore for the preoperative prediction of LVI in patients with IBC. The clinical and MR morphological features served as input to the TabPFN algorithm, which was tailored for the clinical model, while Radscore was specifically designed for the delta-radiomics model.
We then conducted a performance comparison among the hybrid model, the delta-radiomics model, and the clinical model using ROC curves (Supplementary Figure S4). The corresponding AUC values, along with accuracy, recall, precision, and F1-score, are presented in Table 2. Ultimately, the hybrid approach demonstrated superior performance, with an AUC of 0.899 (95%CI: 0.817-0.956), surpassing both the delta-radiomics model alone (0.775[95% CI: 0.615-0.808]) and the clinical model (0.866[95% CI: 0.802-0.925]).
Comparative Analysis of Diagnostic Efficacy Across Diverse Clinical Models.

Discussion
In this study, radiomics analysis was conducted using delta images obtained by subtracting the A0 image from the A1 image in DCE-MRI, demonstrating strong performance in the preoperative prediction of LVI in patients with IBC. Among the models evaluated, the TabPFN algorithm, which integrates clinical and MR morphological features with the Radscore, exhibited superior performance. Consequently, we designed TabPFN algorithm as a hybrid model for this binary classification task that exceeded the efficacy of models based solely on delta-radiomics or MR morphological features.
Due to the high costs and time demands associated with MR examinations, large-scale datasets remain scarce, creating a significant limitation acknowledged in prior studies.8,12-14 In the present study, we utilized clinical and MR morphological features, along with Radscore, as inputs to the TabPFN algorithm. We compared its performance against several traditional machine learning methods, including CatBoost, linear discriminant analysis, logistic regression, random forest, gradient boosting, XGBoost, LightGBM, AdaBoost, and decision trees, and found that TabPFN demonstrated superior performance among these models. We speculate that this enhanced performance is attributable to several factors. First, in this small-sample binary classification (n = 276), TabPFN excels in integrating meta-learning and in-context learning, which is particularly beneficial for limited tabular data. Unlike conventional models such as CatBoost and XGBoost, which often depend on dataset-specific biases, 29 TabPFN leverages a pre-trained transformer optimized on 100 million synthetic datasets. This innovative approach enables it to approximate Bayesian predictions and uncover complex feature-target relationships, including nonlinear and sparse interactions that conventional methods frequently overlook.
Moreover, the two-way attention mechanism employed in TabPFN effectively addresses varying feature scales and outliers without requiring manual preprocessing, a critical capability for managing noisy biomedical datasets. In contrast, tree-based models often struggle with variance in small samples due to their reliance on greedy splits, whereas linear models (eg, linear discriminant analysis, logistic regression) fall short in capturing complex interactions without meticulous feature engineering. 30 Additionally, TabPFN's permutation invariance and cell-wise representations help mitigate biases from arbitrary row and column orderings, ensuring robust generalization even when training datasets exhibit class imbalances or low signal-to-noise ratios.
In this study, SHAP-based interpretability analysis revealed four dominant features that exhibited significantly higher SHAP values than others: Radscore, peritumoral edema, DWI rim sign, and mrALN status. Notably, Radscore emerged as the most influential predictor, reinforcing its established role in quantifying tumor heterogeneity. This heterogeneity serves as a key biomarker indicating biological processes, such as dysregulated angiogenesis and heterogeneous cellular proliferation, as supported by Zheng et al. 14 Peritumoral edema, while secondary in importance, aligns with previous findings.11,14,19-21 Mechanistically, fluid retention and vascular leakage in the peritumoral regions contribute to abnormal neovascularization and lymphatic dysfunction, subsequently elevating interstitial fluid pressure. These pathophysiological changes are evidenced by hyperintense signals on T2-weighted image, a recognized imaging hallmark of LVI. 31 Moreover, the accumulation of hyaluronic acid in the peritumoral stroma serves as a biomarker for aggressive tumor progression and contributes to prolonged T2 relaxation times, indicating a remodeling of the microenvironment. 32 The DWI rim sign, validated as a critical imaging marker for assessing LVI in IBC lesion,11,14,19-21,23 also demonstrates a tentative correlation with Ki-67 expression, which serves as a proliferation index linked to tumor invasiveness.33,34 Lastly, mrALN status is recognized as a reliable diagnostic indicator for axillary lymph node metastasis and shows a direct relationship with LVI, aligning with its role as an early metastatic pathway. 35 These findings bolster previous evidence10,11,14 that establishes a connection between mrALN status and LVI in the progression of in patients with IBC.
Our study possesses several significant limitations that warrant acknowledgment. Firstly, the disproportionate representation of LVI-positive compared to LVI-negative cases may limit the external validity of our conclusions. To improve the robustness and generalizability of these findings, future research should prioritize multi-institutional prospective studies. Second, the manual segmentation of lesion masks may introduce interobserver discrepancies and requires significant computational resources, which could diminish the clinical reproducibility of our methodology. To address this issue, integrating automated segmentation algorithms and exploring lighter-weight model variants is crucial for standardizing analyses and minimizing manual bias. Thirdly, while our internal validation of the TabPFN model using cross-validation provides initial insights into its performance, future external validation is essential to confirm its applicability to broader patient populations and diverse clinical settings. Lastly, the restricted follow-up period has hindered longitudinal prognostic evaluations, particularly regarding the long-term effects of surgical interventions and adjuvant chemoradiotherapy. Therefore, extending observation timelines in future studies is essential for increasing the translational relevance of these outcomes for diverse patient populations.
Conclusions
In conclusion, delta-radiomics analysis demonstrates significant potential for the preoperative prediction of LVI in patients with IBC. To mitigate the limitations associated with small sample sizes, we developed a TabPFN algorithm that integrates clinical and MR morphological features with the Radscore for this binary classification task. This model exhibits robust predictive performance and provides valuable insights for the development of personalized treatment strategies.
Supplemental Material
sj-docx-1-tct-10.1177_15330338251362050 - Supplemental material for MRI Delta-Radiomics and Morphological Feature-Driven TabPFN Model for Preoperative Prediction of Lymphovascular Invasion in Invasive Breast Cancer
Supplemental material, sj-docx-1-tct-10.1177_15330338251362050 for MRI Delta-Radiomics and Morphological Feature-Driven TabPFN Model for Preoperative Prediction of Lymphovascular Invasion in Invasive Breast Cancer by Yunhua Li, Jianfeng Yang, Pan Xiao, Haibo Liu, Yingjun Zhou, Xiuqi Yang, Gangwen Chen and Zhichao Zuo in Technology in Cancer Research & Treatment
Supplemental Material
sj-docx-2-tct-10.1177_15330338251362050 - Supplemental material for MRI Delta-Radiomics and Morphological Feature-Driven TabPFN Model for Preoperative Prediction of Lymphovascular Invasion in Invasive Breast Cancer
Supplemental material, sj-docx-2-tct-10.1177_15330338251362050 for MRI Delta-Radiomics and Morphological Feature-Driven TabPFN Model for Preoperative Prediction of Lymphovascular Invasion in Invasive Breast Cancer by Yunhua Li, Jianfeng Yang, Pan Xiao, Haibo Liu, Yingjun Zhou, Xiuqi Yang, Gangwen Chen and Zhichao Zuo in Technology in Cancer Research & Treatment
Supplemental Material
sj-docx-3-tct-10.1177_15330338251362050 - Supplemental material for MRI Delta-Radiomics and Morphological Feature-Driven TabPFN Model for Preoperative Prediction of Lymphovascular Invasion in Invasive Breast Cancer
Supplemental material, sj-docx-3-tct-10.1177_15330338251362050 for MRI Delta-Radiomics and Morphological Feature-Driven TabPFN Model for Preoperative Prediction of Lymphovascular Invasion in Invasive Breast Cancer by Yunhua Li, Jianfeng Yang, Pan Xiao, Haibo Liu, Yingjun Zhou, Xiuqi Yang, Gangwen Chen and Zhichao Zuo in Technology in Cancer Research & Treatment
Supplemental Material
sj-docx-4-tct-10.1177_15330338251362050 - Supplemental material for MRI Delta-Radiomics and Morphological Feature-Driven TabPFN Model for Preoperative Prediction of Lymphovascular Invasion in Invasive Breast Cancer
Supplemental material, sj-docx-4-tct-10.1177_15330338251362050 for MRI Delta-Radiomics and Morphological Feature-Driven TabPFN Model for Preoperative Prediction of Lymphovascular Invasion in Invasive Breast Cancer by Yunhua Li, Jianfeng Yang, Pan Xiao, Haibo Liu, Yingjun Zhou, Xiuqi Yang, Gangwen Chen and Zhichao Zuo in Technology in Cancer Research & Treatment
Footnotes
Abbreviations
Ethical Considerations
Ethical approval for the study was obtained from the Ethics Committees of Xiangtan Central Hospital (approval number: 2024-01-002).
Consent to Participate
Owing to the retrospective design of the study, the Ethics Committee waived the requirement for informed consent.
Authors’ Contributions
Yunhua Li and Zhichao Zuo contributed to the writing and revision of the manuscript. Jianfeng Yang, Pan Xiao, and Haibo Liu were responsible for conceptualizing and designing the study. Haibo Liu, Yingjun Zhou, and Xiuqi Yang collected the data. Gangwen Chen and Zhichao Zuo provided supervision and contributed to the revision of the manuscript.
Funding
The authors received no financial support for the research, authorship, and/or publication of this article.
Declaration of Conflicting Interests
The authors declared no potential conflicts of interest with respect to the research, authorship, and/or publication of this article.
Availability of Data and Materials
The datasets generated or analyzed during the study are available from the corresponding author on reasonable request.
Supplemental material
Supplemental material for this article is available online.
References
Supplementary Material
Please find the following supplemental material available below.
For Open Access articles published under a Creative Commons License, all supplemental material carries the same license as the article it is associated with.
For non-Open Access articles published, all supplemental material carries a non-exclusive license, and permission requests for re-use of supplemental material or any part of supplemental material shall be sent directly to the copyright owner as specified in the copyright notice associated with the article.