
Abstract
Single-dose preoperative stereotactic body radiotherapy is a novel radiotherapy technique for the early-stage breast cancer, and the treatment response pattern of this technique needs to be investigated on a quantitative basis. In this work, dynamic contrast-enhanced magnetic resonance imaging and diffusion-weighted magnetic resonance imaging were used to study the treatment response pattern in a unique cohort of patients with early-stage breast cancer treated with preoperative radiation. Fifteen female qualified patients received single-dose preoperative radiotherapy with 1 of the 3 prescription doses: 15 Gy, 18 Gy, and 21 Gy. Magnetic resonance imaging scans including both diffusion-weighted magnetic resonance imaging and dynamic contrast-enhanced magnetic resonance imaging were acquired before radiotherapy for planning and after radiotherapy but before surgical resection. In diffusion-weighted magnetic resonance imaging, the regional averaged apparent diffusion coefficient was calculated. In dynamic contrast-enhanced magnetic resonance imaging, quantitative parameters K trans and v e were evaluated using the standard Tofts model based on the average contrast agent concentration within the region of interest, and the semiquantitative initial area under the concentration curve (iAUC6min) was also recorded. These parameters’ relative changes after radiotherapy were calculated for gross tumor volume, clinical target volume, and planning target volume. The initial results showed that after radiotherapy, initial area under the concentration curve significantly increased in planning target volume (P < .006) and clinical target volume (P < .006), and v e significantly increased in planning target volume (P < .05) and clinical target volume (P < .05). Statistical studies suggested that linear correlations between treatment dose and the observed parameter changes exist in most examined tests, and among these tests, the change in gross tumor volume regional averaged apparent diffusion coefficient (P < .012) and between treatment dose and planning target volume K trans (P < .029) were found to be statistically significant. Although it is still preliminary, this pilot study may be useful to provide insights for future works.
Keywords
Introduction
Breast cancer is a major cause of cancer death in women in most Western countries. Statistics shows that 1 (12.5%) of 8 women will be affected by breast cancer during her lifetime. Radiation therapy plays an important role in breast cancer treatment. Currently, breast-conserving treatment consisting of lumpectomy followed by 3 to 6 weeks of daily external beam radiation therapy (RT) is a standard treatment option. Studies have proved that this approach significantly decreases the local recurrence rate in women receiving conservative surgery. 1,2 However, some women electing to receive breast conserving surgery are not able to complete the recommended RT due to financial concerns or distance to the nearest treatment facility. 3 As a result, partial breast radiation therapy (PBI) was developed to decrease the treatment burden for patients. In early studies, PBI technique has been demonstrated to have efficacy comparable to historical controls. 4,5 Several techniques exist for delivery of partial breast treatment but may require additional equipment or specialized training. 6 Given the fact that most modern radiotherapy centers are able to deliver stereotactic and intensity-modulated radiotherapy, 7 –9 external beam partial breast irradiation might be a viable option. However, preliminary data have suggested higher rates of suboptimal cosmesis, possibly related to the large volumes of normal breast tissue treated. 10,11 Compared to postoperative PBI, preoperative radiotherapy has been shown to reduce treatment volumes significantly. 12,13 In addition, preoperative treatment provides an opportunity to evaluate pre- and postradiation imaging in order to better understand radiation response and potentially identify the functional imaging biomarkers that can be used as prognostic and predictive tools. 14 As a result, in consideration of all mentioned issues simultaneously, we developed a novel clinical trial evaluating the use of a highly conformal preoperative stereotactic body radiotherapy (SBRT) approach with the single-fraction delivery, and we utilized dynamic contrast-enhanced magnetic resonance imaging (DCE-MRI) and diffusion-weighted magnetic resonance imaging (DW-MRI) for the radiation response investigation
A typical DCE-MRI involves a serial acquisition of T1-weighted magnetic resonance (MR) images of region of interest (ROI) before and after the intravenous injection of a low molecular, T1-shortening paramagnetic compound as the contrast agent (CA), and the evolution curve of CA concentration as a function of time can be acquired from the signal intensities of sampled images. As convenient and robust analysis metrics, semiquantitative parameters including initial area under the MR signal evolution curve (iAUC), variance of enhancement slope, and early contrast uptake have been frequently used in fast DCE-MRI analysis. 15 –18 In quantitative analysis, biological parameters depicting microvascularity permeability, tissue perfusion, and extracellular volume fraction can be derived by fitting the CA concentration evolution curves into an appropriate pharmacokinetic model with certain pathological assumptions. In earlier assessment studies, relationship between the change in a lesion’s pharmacokinetic parameters and the pattern of tumor vasculature integrity change following drug treatment and chemotherapy has been shown. 19 –21 Compared with DCE-MRI, DW-MRI utilizes the natural sensitivity of MR to motion. The thermally induced random motion of water molecules is described as self-diffusion or Brownian motion. The water diffusion rate can be described by a logarithmic parameter apparent diffusion coefficient (ADC), which is derived quantitatively from 2 sets of diffusion-weighting strength in the pulse sequence in aspect of pulse amplitude, duration, and spacing of a diffusion gradient, jointly expressed as a “b” value. 22 Previously, ADC has been correlated with tissue cell density. 23 In recent non-breast studies, changes in ADC during radiotherapy have been correlated with treatment responses and clinical outcomes and have been demonstrated to be useful in treatment assessment. 24,25
Although this new single-dose preoperative breast radiotherapy treatment is promising, its treatment response pattern needs to be further investigated on a quantitative basis. In this study, DCE-MRI and DW-MRI were firstly used to assess the response of the new single-dose preoperative radiotherapy treatment scheme in breast cancer. The semiquantitative parameter iAUC and the quantitative tissue permeability parameters from the classic compartment pharmacokinetic models were investigated in DCE-MRI analysis, and in DW-MRI analysis, ADC was chosen as the biomarker to assess radiation-induced changes. Our primary objective was to assess the relative changes in selected parameters after radiation treatment. Our secondary objective was to investigate the potential linear relationship between parameter changes and delivered radiation dose.
Materials and Methods
Patients
Fifteen patients were involved in this Institutional Review Board-approved study (Table 1). Each patient was required to have a complete history and biopsy-proven invasive/infiltrating or in situ breast carcinoma. For each patient, the gross tumor volume (GTV) was delineated based on magnetic resonance imaging (MRI) and generally has a volume of less than 1 cm3. The prescription dose was delivered in a single fraction using intensity-modulated RT. The MRI scans were acquired about 1 week before and 1 week after radiotherapy. All patients underwent surgical tumor resection within 10 days of radiotherapy using standard surgical procedure.
Patient History and Treatment Information.
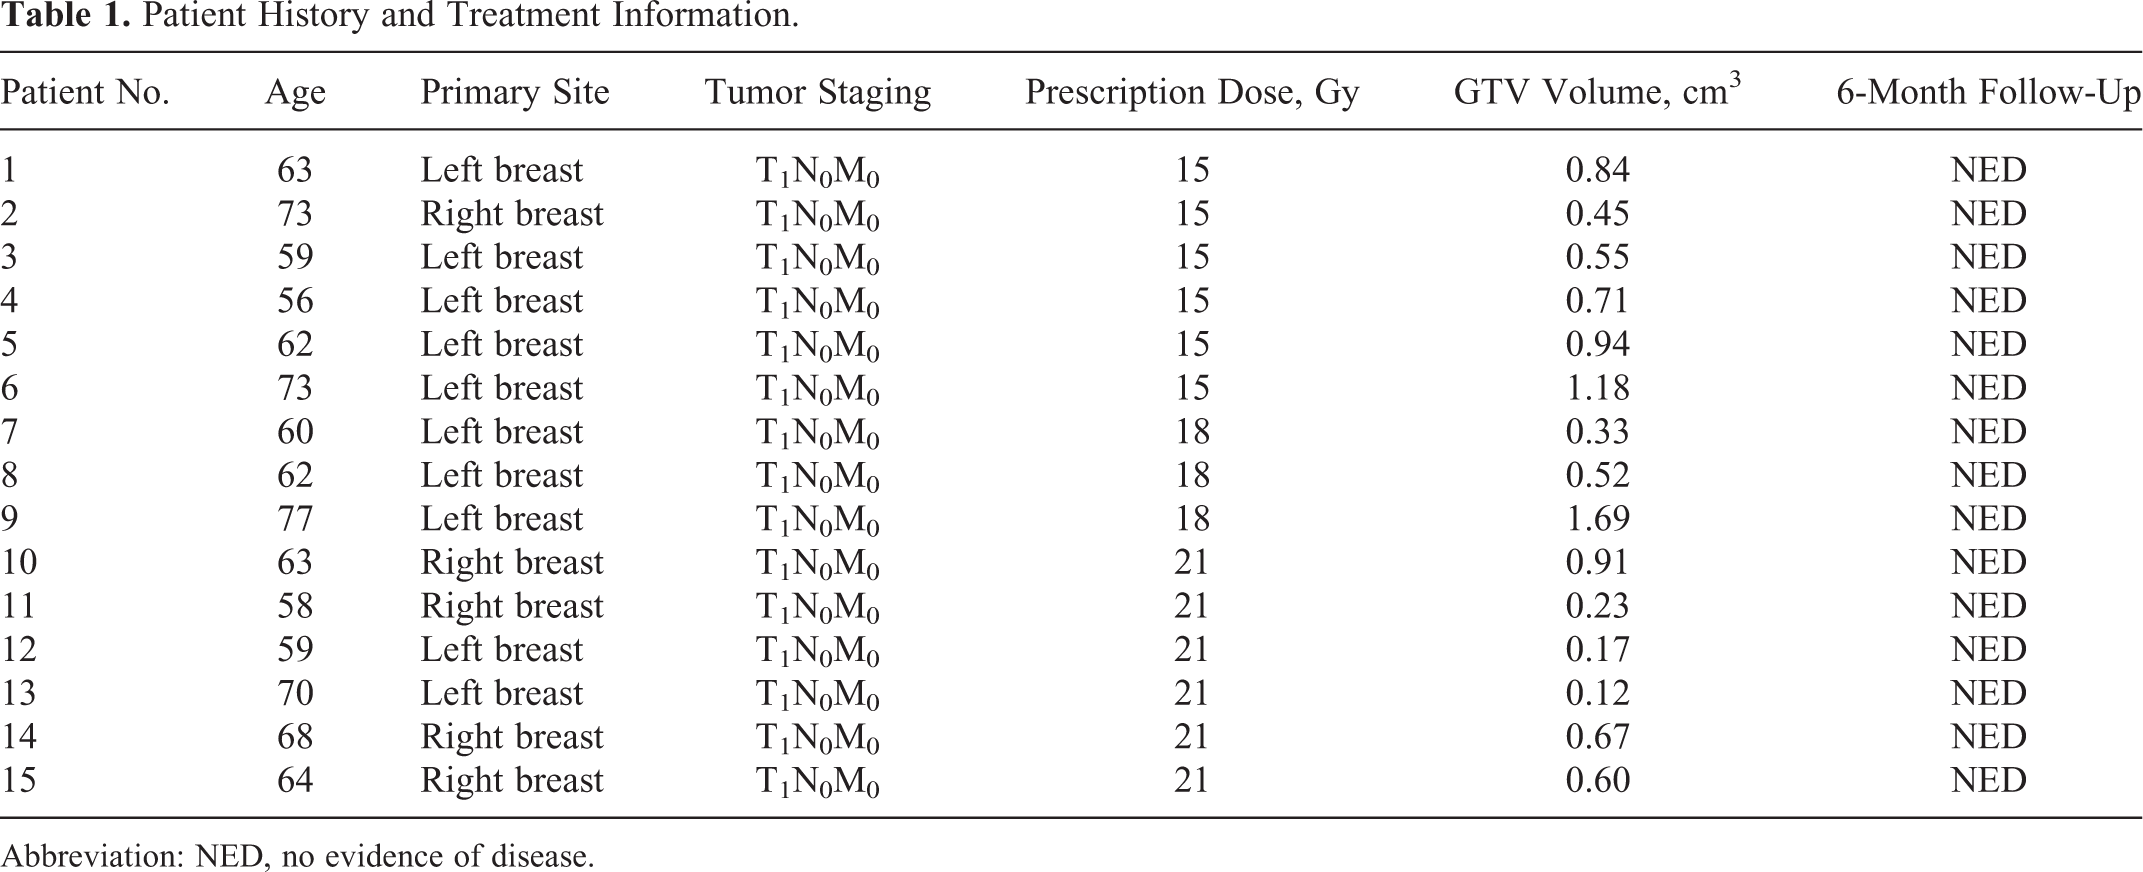
Abbreviation: NED, no evidence of disease.
Image Acquisition
All MRI scans were acquired with patients’ in the prone position on a 1.5-T clinical scanner (GE Healthcare, Milwaukee, Wisconsin) using a standard 4-channel breast coil. The imaging protocol included T1- and T2-weighted imaging, DW-MRI, and DCE-MRI. In this work, DCE-MRI data acquired were used for tumor delineation and radiotherapy planning and as such demands high spatial resolution with adequate fat saturation. A balanced choice between high spatial resolution and high temporal resolution was made. 20 In DCE-MRI, 2 T1 calibration scans using dual flip angles 5° and 15° were acquired first to get the T1 value before CA injection. 26 The CA gadopentetate dimeglumine (Magnevist; Schering, Berlin, Germany/Bayer, Whippany, New Jersey) was intravenously administered by power injection with a dose of 0.1 mmol/kg bodyweight at 2 mL/s flow rate. The DCE-MRI scans were acquired in the sagittal plane with 1 pre-enhanced and 6 postenhanced series using a T1-weighted fast 3D Spoiled Gradient Echo (SPGR) dynamic sequence (repetition time [TR] = 6 ms, echo time [TE] = 2.9 ms, field of view = 24 × 24 cm2, matrix size = 256 × 256, slice thickness = 3.4 mm, no averages). One preinjection volume and 6 postinjection volumes were acquired in each scan, and the temporal resolution was about 1 minute.
The DW-MRI scans were acquired in the sagittal plane using a spin-echo Echo Planar Imaging (EPI) sequence (TR = 3125 ms, TE = 77 ms, field of view = 30 × 30 cm2, matrix size = 256 × 256, slice thickness = 5 mm, 4 averages). The diffusion-sensitized gradient encoding with a diffusion weighting factor of b = 500 mm2/s was applied in 6 directions, and 1 set of images without diffusion-sensitized gradient encoding (eg, b = 0 mm2/s) was also acquired.
Analysis of DCE-MRI
The posttreatment scans were rigidly registered to the pretreatment scans using a feature-based algorithm using the mutual information of the chosen points’ location information. 27 The T1 values before CA administration, T10, and T1 values at 6 time point after CA administration, T1(t1-6), were derived from the signal ratio of scans with dual flip angles. The change in longitudinal relaxation rate R 1(t) (1/T1(t)) is assumed to have a linear dependence on the measured CA concentration C(t) 28 :

where R 10 is the calibrated longitudinal relaxation rate before CA administration, and r is the longitudinal relaxivity of the CA at the magnitic field strength during MR scans. In this study, the r value was 4.3 mmol/L−1 s−1 at 1.5-T magnetic field. 29 From Equation 1, the CA concentration at each time point can be obtained in a pixel-by-pixel pattern, after which the CA concentration evolution curves for different ROIs can be derived by averaging the CA concentration of all voxels inside the specific ROI volume. For each curve, the model-free iAUC6min, which stands for the area under ROI concentration curve in the 6-minute postinjection scan time, was calculated using trapezoidal integration rule. In the quantitative analysis, the standard 2-compartment Tofts model was adapted. 30 By assuming that the plasma volume fraction is very small and ignorable, the measured concentration curve is expressed as follows with Kety rate law employed:

In Equation 2, C(t) is the measured CA concentration, and Cp (t) is the CA concentration in blood plasma. Two quantitative permeability parameters are investigated: K trans, the rate constant describing the transport of CA from blood plasma to EES, and v e, the volume fraction of EES in tissue. The ratio of K trans over v e, also known as kep, depicts the rate constant of CA from EES returning back to blood plasma.
The CA concentration evolution in the blood plasma Cp (t), also called as arterial input function (AIF), must be known prior to the model fitting. This knowledge can be achieved by imaging the major arterial structures inside the field of view of MR images. 31,32 However, such structures were available for a clinical breast MR scan, so the term Cp (t) was approximated by population-based biexponential decay:

In the Equation 3, D is the CA administration dose 0.1 mmol/kg bodyweight, and the 2 exponential terms correspond to the fast dynamic equilibrium of CA between blood plasma and EES and the slow renal removal of CA. In this study, a group of published parameters were employed: a 1 = 3.99 kg/L, a 2 = 4.78 kg/L, m 1 = 0.144 min−1, m 2 = 0.111 min−1. 33,34 Substituting Equation 3 into Equation 4, the standard Tofts model is expressed as follows:

Equation 4 was used to resolve 2 unknown variables (K trans and v e) using nonlinear Levenburg-Marquart fitting algorithm.
The GTV, clinical target volume (CTV), and planning target volume (PTV) were selected as ROI for analysis. The values for iAUC6min, K trans, and v e for different ROIs were investigated using the averaged CA concentrations within the structures for both pretreatment and posttreatment data, and the percentage change in each parameter after radiotherapy was also obtained. All procedures described earlier were performed on the software developed in-house with MATLAB (MathWorks, Natick, Massachusetts).
Analysis of DW-MRI
Given the fact that the DW-MRI images were inherently aligned with the DCE-MRI images by sharing the same coordinate of each scan, the posttreatment DW-MRI images were registered to the pretreatment images with the DCE-MRI registration information. Based on the DW-MRI images, the ADC value is calculated by Equation 5:

S(b) denotes the signal intensity at b = 500 mm2/s, and S(0) denotes the signal intensity in the absense of diffusion gradient. The ADC values are first computed in a pixel-by-pixel pattern. Then, the regional ADC (rADC) values for GTV, CTV, and PTV were calculated by averaging the ADC values of all voxels within the ROI, excluding those with zero or very small ADC values below a cutoff threshold determined by the in-house software automatic histogram segmentation algorithm. Similar to the DCE-MRI analysis, the rADC values for GTV, CTV, and PTV were calculated for both pretreatment data and posttreatment data for each patient, and the percentage change after radiotherapy was also recorded.
Statistical Analysis
Statistical analysis was performed using the commericial software referred to as SPSS program (SPSS Software Products, Chicago, Illinois). The Wilcoxon signed-rank test was used to assess the relative changes in iAUC6min, K trans, v e, and rADC for each structure after the radiotherapy. The same analysis was also performed in each group of patients receiving different perscription doses. A correlation test was used to examine the potential linear relationship between the parameter relative changes and the prescription dose. Statistical significance was considered at P < .05.
Results
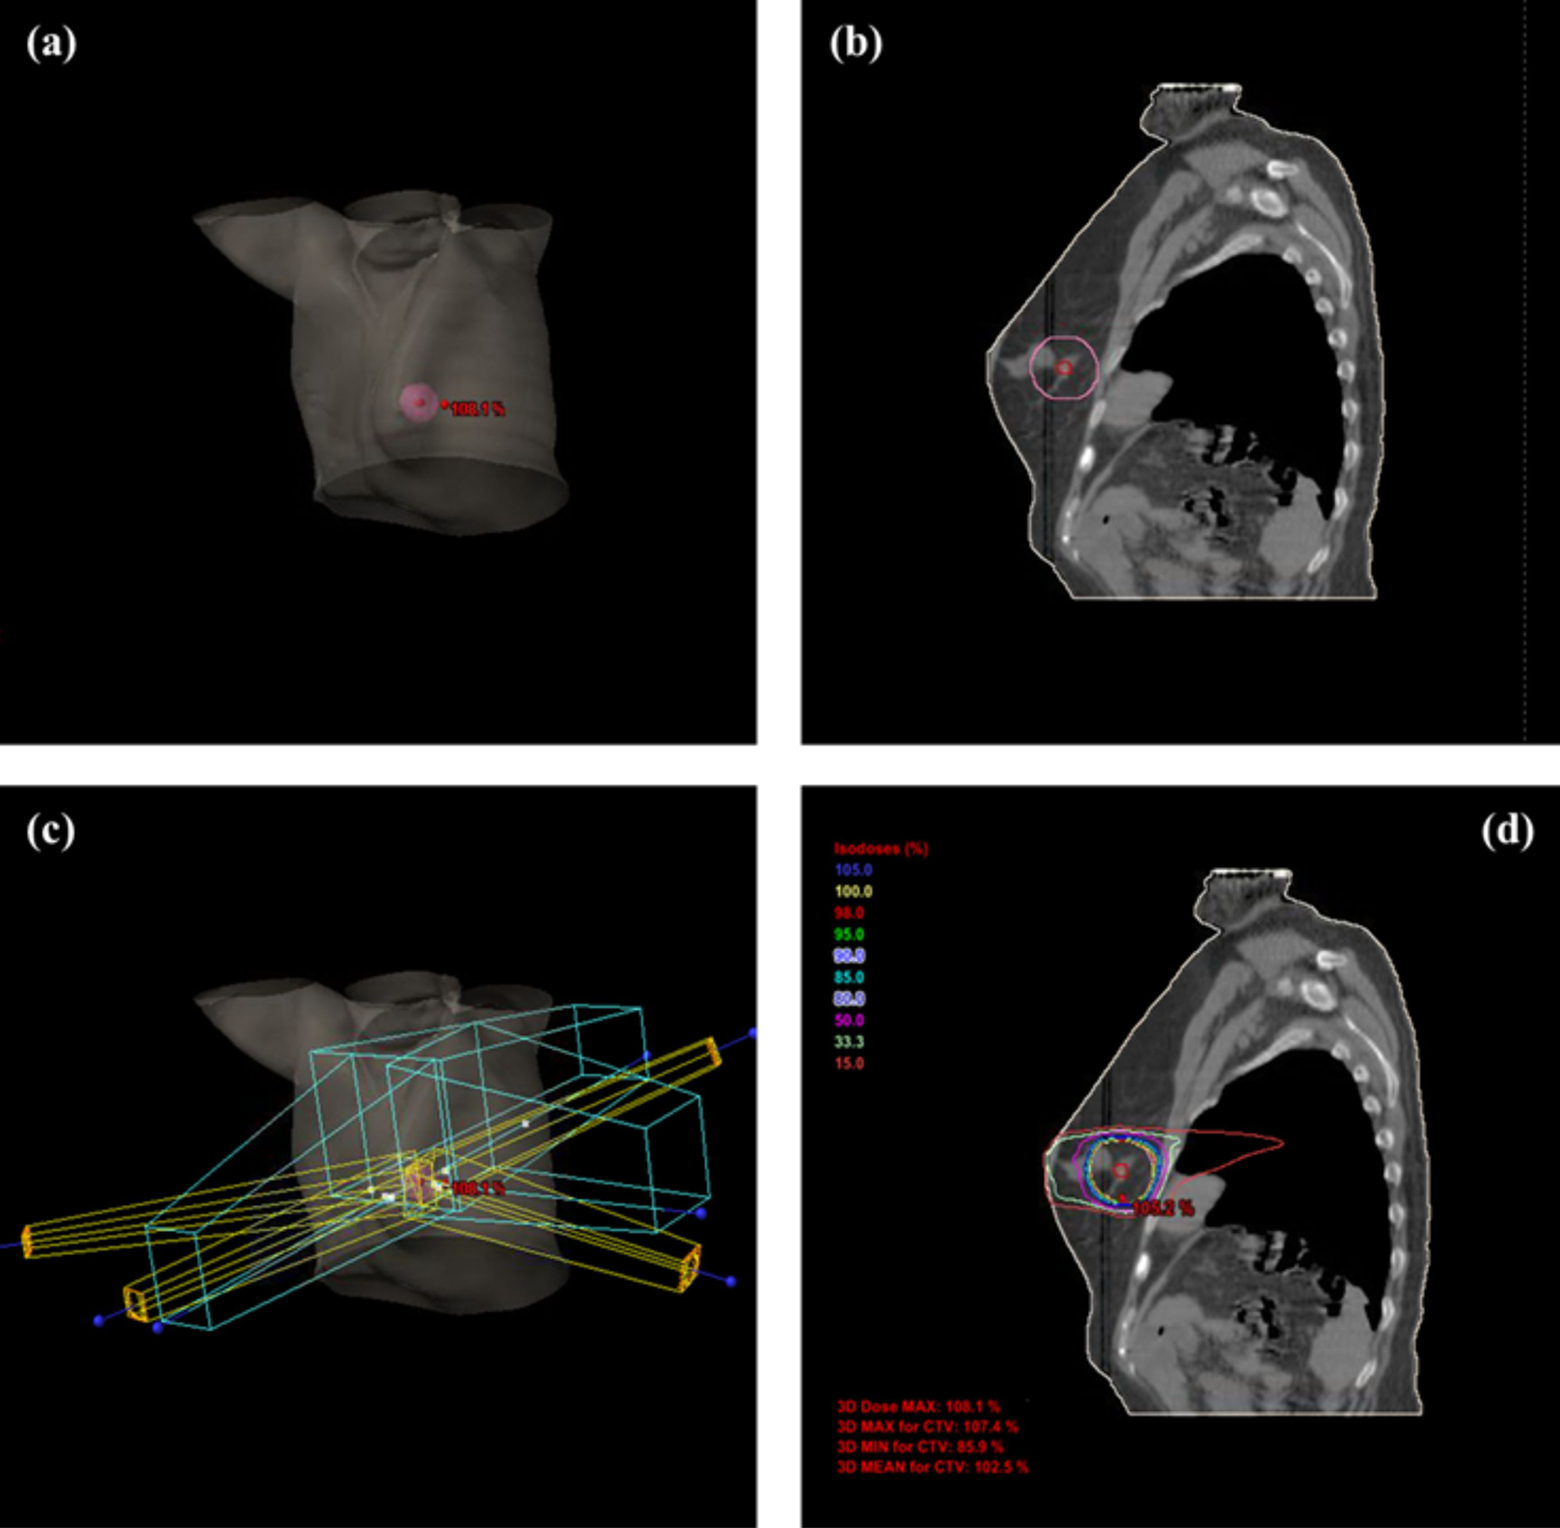
All the patients received radiotherapy as planned. Figure 1 shows the radiotherapy from a selected patient. The GTV (0.71 cm3) and PTV (35.37 cm3) are displayed in red and pink, respectively. Figure 2 shows the same patient’s paired DW-MRI and DCE-MRI images. Figure 3A presents the same patient’s preinjection T1 map (T10) at the pretreatment scan day. The 3D mean value of the CTV (indicated by the red contour) T10 was 689.1 ± 56.2 ms. Figure 3B shows the AIF, CTV CA concentration measurement, and its fitting. The measured CA curve was successfully fitted by the Tofts model (R 2 > .95).

Treatment plan from a selected patient. A, GTV (red, 0.71 cm3) and PTV (pink, 35.37 cm3) shown in 3D body; (B) GTV and PTV shown in a selected slice of CT; (C) field arrangement in 3D body; and (D) dose distribution within a selected slice of X-ray computed tomography (CT). GTV indicates gross tumor volume; PTV, planning target volume.
MR images from a selected patient. A, Pretreatment DCE-MRI of a selected temporal frame; (B) posttreatment DCE-MRI of the same temporal frame as (A); (C) pretreatment DW-MRI; and (D) posttreatment DW-MRI. All pretreatment and posttreatment images are registered. MR indicates magnetic resonance; DCE-MRI, dynamic contrast-enhanced magnetic resonance imaging; DW-MRI, diffusion-weighted magnetic resonance imaging.
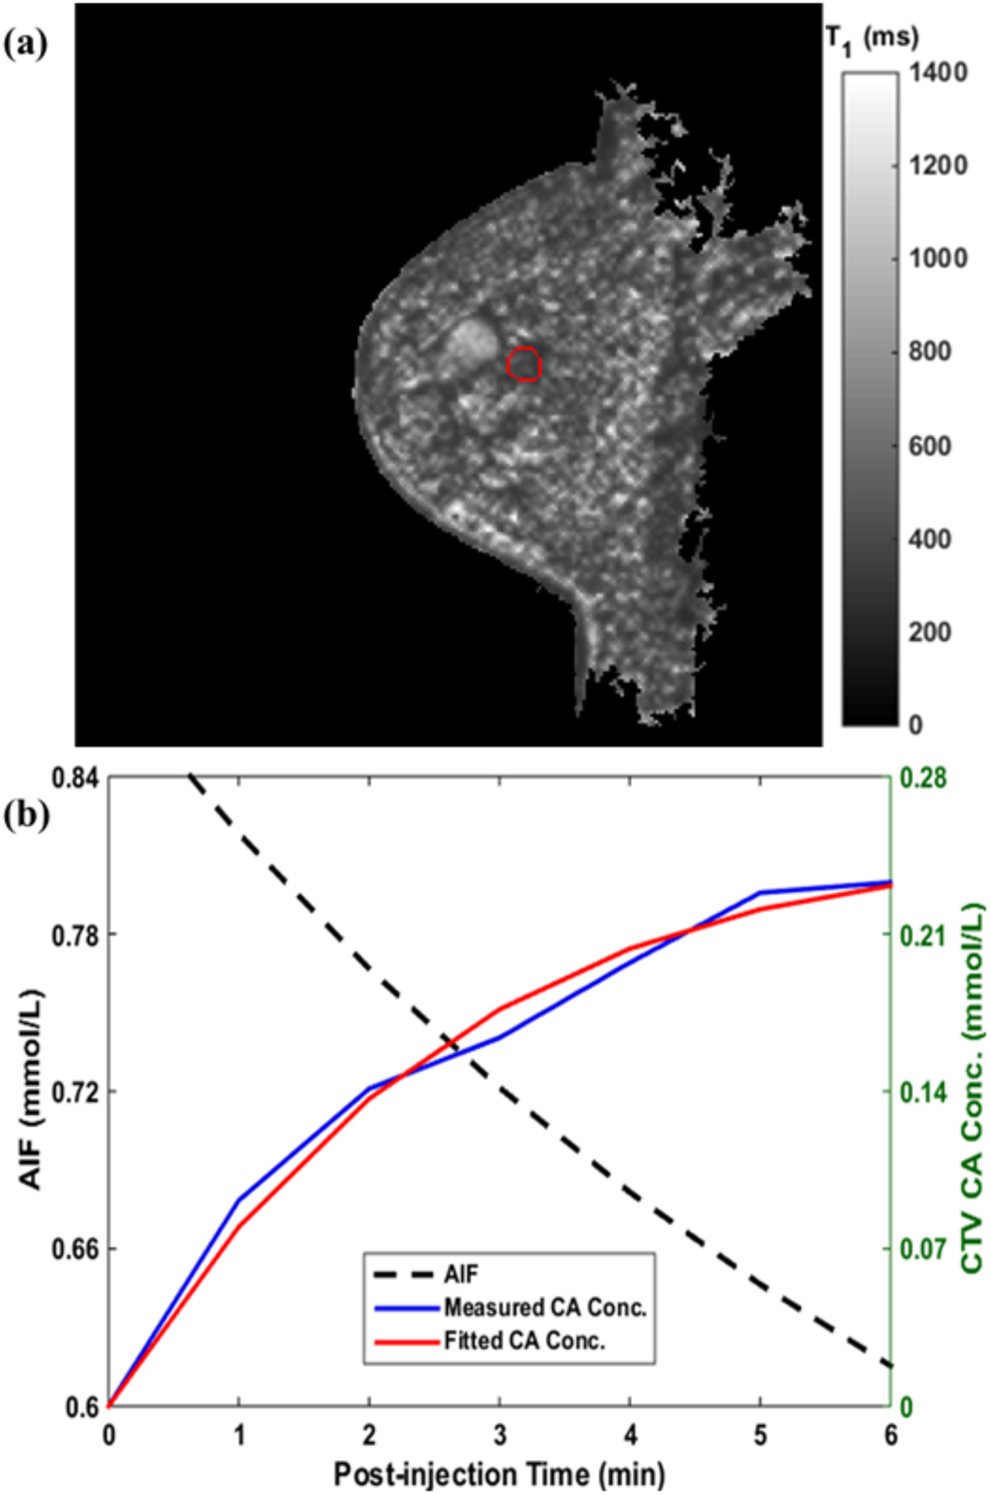
Pretreatment scan analysis. A, Preinjection T10 map and (B) AIF (black), CTV CA concentration measurement (blue) and its fitting (red) in pharmacokinetic analysis. AIF indicates arterial input function; CTV, clinical target volume; CA, contrast agent.
Table 2 presents the 15 patients’ average values of the investigated parameters at different ROIs measured before and after radiotherapy. As shown in Table 2, the semiquantitative iAUC significantly increased in PTV (P < .006) and CTV (P < .006) after radiotherapy. The EES volume fraction v e increased after radiotherapy in PTV (P < .05) and CTV (P < .05). These 4 changes were statistically significant. It has to be pointed out that K trans and v e for GTV were not reported in Table 2. This is because that the quantitative model fitting was found to be not appreciable for certain patients’ pre- or posttreatment GTV data, possibly due to the suboptimal signal-to-noise ratio (SNR) within a very small volume as shown in Table 1; as a result, K trans and v e were excluded in GTV study.
The Parameters’ Average Value Before and After Radiotherapy.

Abbreviations: PTV, planning target volume; RT, radiotherapy; CTV, clinical target volume; GTV, gross tumor volume; rADC, regional apparent diffusion coefficient; iAUC, initial area under the concentration curve.
aStatistically significant (P ≤ .05) results.
To investigate the potential parameter changes’ linear dependence on the treatment dose, we then performed correlation tests on each parameter in different ROIs. Table 3 includes the relative changes of each parameter after radiotherapy with 15 Gy, 18 Gy, and 21 Gy prescription dose, Pearson correlation coefficients, and significance P values. The correlation test results of PTV are presented in Figure 4. As can be seen, linear correlation existed in 7 of 10 substudies (|r| > .8) except for CTV K trans, CTV v e, and GTV iAUC6min. Of all the performed tests, the linear correlation between radiation dose and GTV’s rADC (P < .012) change and between PTV’s K trans (P < 0.029) change were found to be statistically significant.
Correlation Test Results Between Parameter Changes and Radiation Doses.

Abbreviations: PTV, planning target volume; CTV, clinical target volume; GTV, gross tumor volume; rADC, regional apparent diffusion coefficient; iAUC, initial area under the concentration curve.
aStatistically significant (P ≤ .05) results.

Linear correlation tests of PTV parameters’ changes and treatment dose. A, iAUC6min; (B) K trans; (C) v e; and (d) rADC. PTV indicates planning target volume; iAUC, initial area under the concentration curve; rADC, regional apparent diffusion coefficient
Discussion
As the first study investigating single-dose preoperative breast SBRT with quantitative MR imaging technique, we used DW-MRI and DCE-MRI for the assessment of a novel breast radiotherapy treatment scheme. In general, the results showed that the model-free iAUC6min and model-based v e in PTV and CTV had significant changes after radiotherapy. As known in radiobiology theory, tumor oxygenation is an important predictor of radiation response, and the state of hypoxia/anoxia leads to decreased cell death and an increased level of free radical scavengers and DNA repair enzyme. The degree of hypoxia is due, in part, to microvasculature abnormalities including a limited perfusion rate. 35 The increase in iAUC6min after radiation treatment suggests potentially enhanced microvessel permeability that may lead to the reduced degree of hypoxia and increased radiation treatment effect. At the same time, the increased v e can be interpreted as extravascular intracellular space (EIS) reduction. In association with reduced cell volume and/or cell density, the reduced EIS might serve as another biomarker for assessment of radiation treatment. As can be seen in Table 2, K trans slightly decreased in CTV and slightly increased in PTV after the treatment, and the changes were not statistically significant. Studies have shown that K trans change pattern in response to treatment is somewhat correlated with the pattern of iAUC change, 36 yet the K trans change is more complicated under the v e impact. Although K trans has been reported to decrease in range of 5% to 97% after various types of treatment, 36,37 some results showed K trans enhancement after treatment in certain scenarios. 38 In this study, the results presented about K trans suggests that the new single-dose preoperative radiotherapy may have a different therapeutic effect, although our sample was small and this finding was hypothesis generating. Larger prospective studies with strong radiologic–pathologic correlation are necessary to validate these prelimary findings.
In this study, the rADC results are interesting. The measured water ADC is often considered to be dominated by the fraction of intracellular water. Due to the existence of organelles, the extracellular water has been estimated to diffuse with the rate constant 2 to 3 times larger than the corresponding rate of intracellular water. 39 The increased ADC has been associated with reduced cell density and restricting barriers of cell membrance induced by radiation cell killing. 20 As a result, the slight decrease in rADC in this study may suggest suboptimal therapeutic effects of this new treament scheme. It shall be noted that the potential linear correlation of rADC change in Table 3 shows that rADC increased in all ROIs after radiotherapy when the treatment dose was 21 Gy. This suggests that rADC change had a different trend depending on the treatment dose, and there could be a potential dose threshold that determines the trend of rADC change.
The results of correlation analysis demonstrated that a linear relationship might be feasible to describe the relationship between the radiotherapy dose and the relative parameter changes in most substudies. This suggests that as the preoperative radiation dose goes up, the surrogate biomarkers may have larger changes. If the linear correlation held valid, it implied that radiation-induced changes in biomarkers could be potentially predicted with a given radiation dose. This finding may be valuable to future work on dosage optimization of breast single-dose preoperative radiotherapy.
There are several limitations in the present study. First, the simple 2-compartment based Tofts model may not be the optimal one to describe the biological environment of breast tumors. In addition, the linear relationship between CA concentration and longitudinal relaxation change assumes the sufficiently fast water exchange from EIS to EES, yet the assumption is not always guaranteed. 40 A second limitation is the failure of nonlinear model fitting for quantitative GTV DCE-MRI analysis for certain patients. A fitting is justified as unsucessful if the obtained parameter violates the model assumption (v e > 1) or the fitting quality is poor (R 2 < .6). In this study, the GTVs were very small (generally less than 1 cm3), and with great sensitivity to the image noise in tiny volumes, the accuracy of averaged CA concentration calculation within may be suboptimal for the nonlinear curve fitting. 41 In addition, the fitting error may come from the nonlinear least-squares fitting itself. With limited data points due to the low temporal resolution, the fitting process might be localized within the local optima, which is determined by the initial searching point. 42 If fast DCE-MRI technique can be employed in the future clinical scans, linear least-squares fitting method may become promising in quantitative parameter generation. 43 –46 Another limitation of the study is the absense of individualized AIF information. The populated-based AIF model ignores the individual physiology difference in aspect of blood circulation, leading to potential quantitative parameter measurement noise. When AIF information is not available, however, the simple biexponential decay model is very convenient and has been used in various studies, 20,47,48 although more complexed AIF model have been reported. 43,49,50
Conclusion
As the first study investigating a new single-dose breast SBRT with quantitative MRI technique, the initial results suggest that the MR quatitiative parameters could potentially be used as radiation response biomarkers. A linear relationship between the radiotherapy dose and the relative parameter changes was observed in various MR quatitiative parameters. The results might provide valuable references for future research on this new single-dose breast radiotherapy. Further work exploring and validating these biomarkers to optimize breast radiation treatment assessment is expected.
Footnotes
Declaration of Conflicting Interests
The author(s) declared no potential conflicts of interest with respect to the research, authorship, and/or publication of this article.
Funding
The author(s) disclosed receipt of the following financial support for the research, authorship, and/or publication of this article: This work was partially supported by grants from the National Institutes of Health grant K12HD043446 - Building Interdisciplinary Research Careers in Women's Health (JH) and Varian Medical Systems (JH).