
Abstract
Purpose
Automating quality assurance (QA) for contours generated by automatic algorithms is critical in radiotherapy treatment planning. Manual QA is tedious, time-consuming, and prone to subjective experiences. Automatic segmentation reduces physician workload and improves consistency. However, an effective QA process for these automatic contours remains an unmet need in clinical practice.
Materials and Methods
The patient data used in this study was derived from the AAPM Thoracic Auto-Segmentation Challenge dataset, including left and right lungs, heart, esophagus, and spinal cord. Two groups of organ-at-risk (OAR) were generated. A ResNet-152 network was used as a feature extractor, and a one-class support vector machine (OC-SVM) was employed to classify contours as ‘high’ or ‘low’ quality. To evaluate the generalizability, we generated low-quality contours using translation and resizing techniques and assessed correlations between detection limits and metrics such as volume, Dice similarity coefficient (DSC), 95% Hausdorff distance (HD95), and mean surface distance (MSD).
Results
The proposed OC-SVM model outperformed binary classifiers n metrics such as balanced accuracy and area under the receiver operating characteristic curve (AUC) . It demonstrated superior performance in detecting various types of contour errors while maintaining high interpretability. Strong correlations were observed between detection limits and contour metrics.
Conclusion
Our proposed model integrates an attention mechanism with a one-class classification framework to automate QA for OAR delineations. This approach effectively detects diverse types of contour errors with high accuracy, significantly reducing the burden on physicians during radiotherapy planning.
Introduction
Accurate contour delineation of targets and organs-at-risk (OARs) is a cornerstone of radiotherapy treatment planning, as it directly influences the quality of radiation delivery and patient outcomes.1–3 This process involves identifying and outlining critical anatomical structures to guide radiation dose distribution while sparing healthy tissues. However, manual contouring is labor-intensive, time-consuming, and prone to inter- and intra-observer variability due to differences in experience, fatigue, and subjective judgment. 4 These challenges underscore the need for efficient solutions to streamline contour delineation while maintaining high accuracy.
Automatic contouring methods have emerged as powerful tools to reduce physicians’ workload and improve consistency in delineation. These methods can be broadly categorized into atlas-based approaches and deep learning-based techniques. Atlas-based methods rely on deformable registration of pre-annotated templates to target images, 5 while deep learning approaches leverage convolutional neural networks (CNNs) to extract hierarchical features for segmentation tasks.6–14 Despite their promise, automatic segmentation algorithms face limitations when applied to clinical datasets that deviate from their training data due to variations in imaging protocols, patient anatomy, or clinical guidelines.15–17 These discrepancies can lead to suboptimal segmentation performance, necessitating rigorous quality assurance (QA) processes.
The quality assurance of automatic contours is critical yet remains an unmet need in clinical practice. Traditionally, QA involves manual review by experienced physicians or the use of evaluation metrics such as Dice similarity coefficient (DSC), Hausdorff distance (HD95), and mean surface distance (MSD). 18 While these metrics provide quantitative assessments of segmentation accuracy, they are insufficient for real-time clinical workflows due to their reliance on manual intervention. Automated QA systems have been proposed to address this gap, leveraging feature-based methods19–22 or deep learning models23–26 to predict contour quality. However, existing approaches often struggle with imbalanced datasets or require extensive labeled error samples for training.
To mitigate the substantial time and workload associated with reviewing automatic delineations - particularly for organs where auto-segmentation methods are prone to errors due to anatomical complexity, low contrast, or size variability–we propose a novel approach that automates the QA process using a one-class classifier. This is critical for organs like the esophagus and spinal cord, where segmentation errors disproportionately impact treatment outcomes. One-class classification is particularly suited for scenarios with limited error samples, as it focuses on learning the characteristics of high-quality contours without requiring explicit examples of errors.27–29 Unlike binary classifiers that may fail to generalize to unseen error types, one-class classifiers excel at detecting anomalies by identifying deviations from learned patterns. To enhance feature extraction, we integrate ResNet-152 with OAR-specific masks, ensuring that the model captures relevant anatomical features while filtering out irrelevant information. Previous quality control methods often used full CT images for inference, which led to poor generalization due to the extraction of irrelevant features unrelated to organ-at-risk (OAR) masks.24,30 Our approach resolves this issue by focusing on image regions corresponding to OAR masks, ensuring that feature extraction is strongly correlated with the delineated regions. This alignment enhances the model’s ability to accurately assess segmentation quality, addressing a critical limitation in prior methodologies.
In this study, we developed a one-class support vector machine (OC-SVM)-based QA model for OAR delineation in thoracic radiotherapy. Our method systematically evaluates contour quality by combining advanced feature extraction with robust classification techniques. To simulate diverse clinical scenarios and assess model generalizability, we generated a comprehensive dataset with various types of low-quality contours using translation and resizing techniques. The proposed model was evaluated using multiple metrics, including balanced accuracy, sensitivity, specificity, and area under the receiver operating characteristic curve (AUC), demonstrating its effectiveness in detecting a wide range of contour errors. By addressing the limitations of existing QA methods and introducing an innovative one-class classification framework, this study aims to streamline the QA process for automatic OAR delineations in thoracic radiotherapy. Our approach not only reduces the burden on clinicians but also enhances the reliability and consistency of radiotherapy treatment planning.
Materials and Methods
As shown in Figure 1, this section provides an overview of several key components in our process, including data acquisition, contour evaluation, data preprocessing, feature extraction, machine learning model, and evaluation metrics.

The workflow of the proposed quality assurance model.
Data Acquisition
The patient data utilized in our study comprised CT images and manually delineated contours from the AAPM Thoracic CT Segmentation Challenge competition, encompassing a total of 60 cases.
31
The CT images were reconstructed to encompass the entire thoracic region, with the number of slices ranging from 103 to 279. These CT scans had a consistent field of view of 50 cm and a reconstruction matrix size of 512
The gold standard atlas for organ-at-risk (OAR) delineation used in this study consisted of manual contours created by expert clinicians following the contouring guidelines outlined in RTOG 1106. 32 These contours served as the ”ground truth” for evaluating the accuracy of automated delineations. The OARs included in this study were the left lung, right lung, heart, esophagus, and spinal cord. To generate automated contours, we utilized AccuContourTM(Manteia Medical Technologies Co. Ltd., Xiamen, China), a commercially available software that employs deep learning techniques. Low-quality contour samples were systematically derived from high-quality contours using automated perturbation techniques such as translation, enlargement, and reduction. These perturbations simulated common clinical errors to create a diverse dataset for robust model evaluation. The primary objective of this study was to develop an automated quality assurance model capable of identifying low-quality contours with high accuracy. A total of 60 cases were included in this study. Of these, 48 cases were randomly assigned to the training set, while 12 cases were allocated to the test set to ensure unbiased evaluation. The number of slices of each organ is as follows: esophagus, 2982; heart, 1891; left lung, 2765; right lung, 2749; spinal cord, 2881.
Contour Evaluation
We used the Dice similarity coefficient (DSC),
33
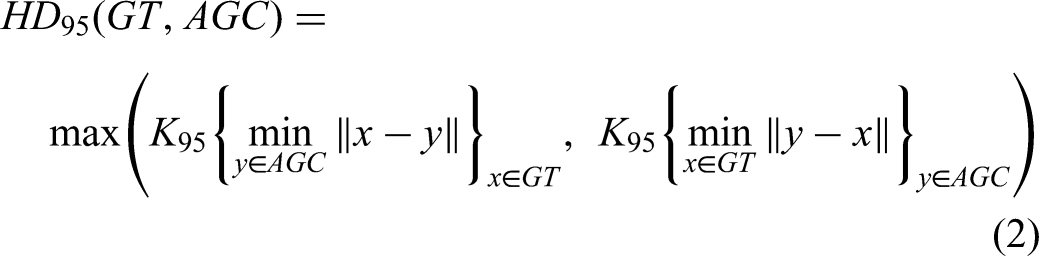
the 95th percentile Hausdorff distance (HD95),
34
and mean surface distance (MSD)
35
to measure the contour quality. These equations 1to 3 quantify similarity between ground truth (GT) and automatically generated contours (AGC) by assessing overlap, boundary proximity, and surface distance, respectively. The results provide a comprehensive assessment of contour quality, as detailed below. The DSC metric quantifies the spatial overlap between structures, with values ranging from 0 (no overlap) to 1 (perfect alignment).


Quality Judgment
Previous single-metric analysis demonstrated DSC and MSD are effective indicators for assessing the similarity between contours in error detection.
23
However, given that different shapes and sizes of OARs may respond variably to these metrics, where smaller contours often exhibit lower DSC values but better HD, it became evident that relying solely on individual metrics could be misleading. Therefore, we introduced a multi-metric approach to establish comprehensive criteria for contour quality.
24
A high-quality contour is defined as one that satisfies all the following criteria:


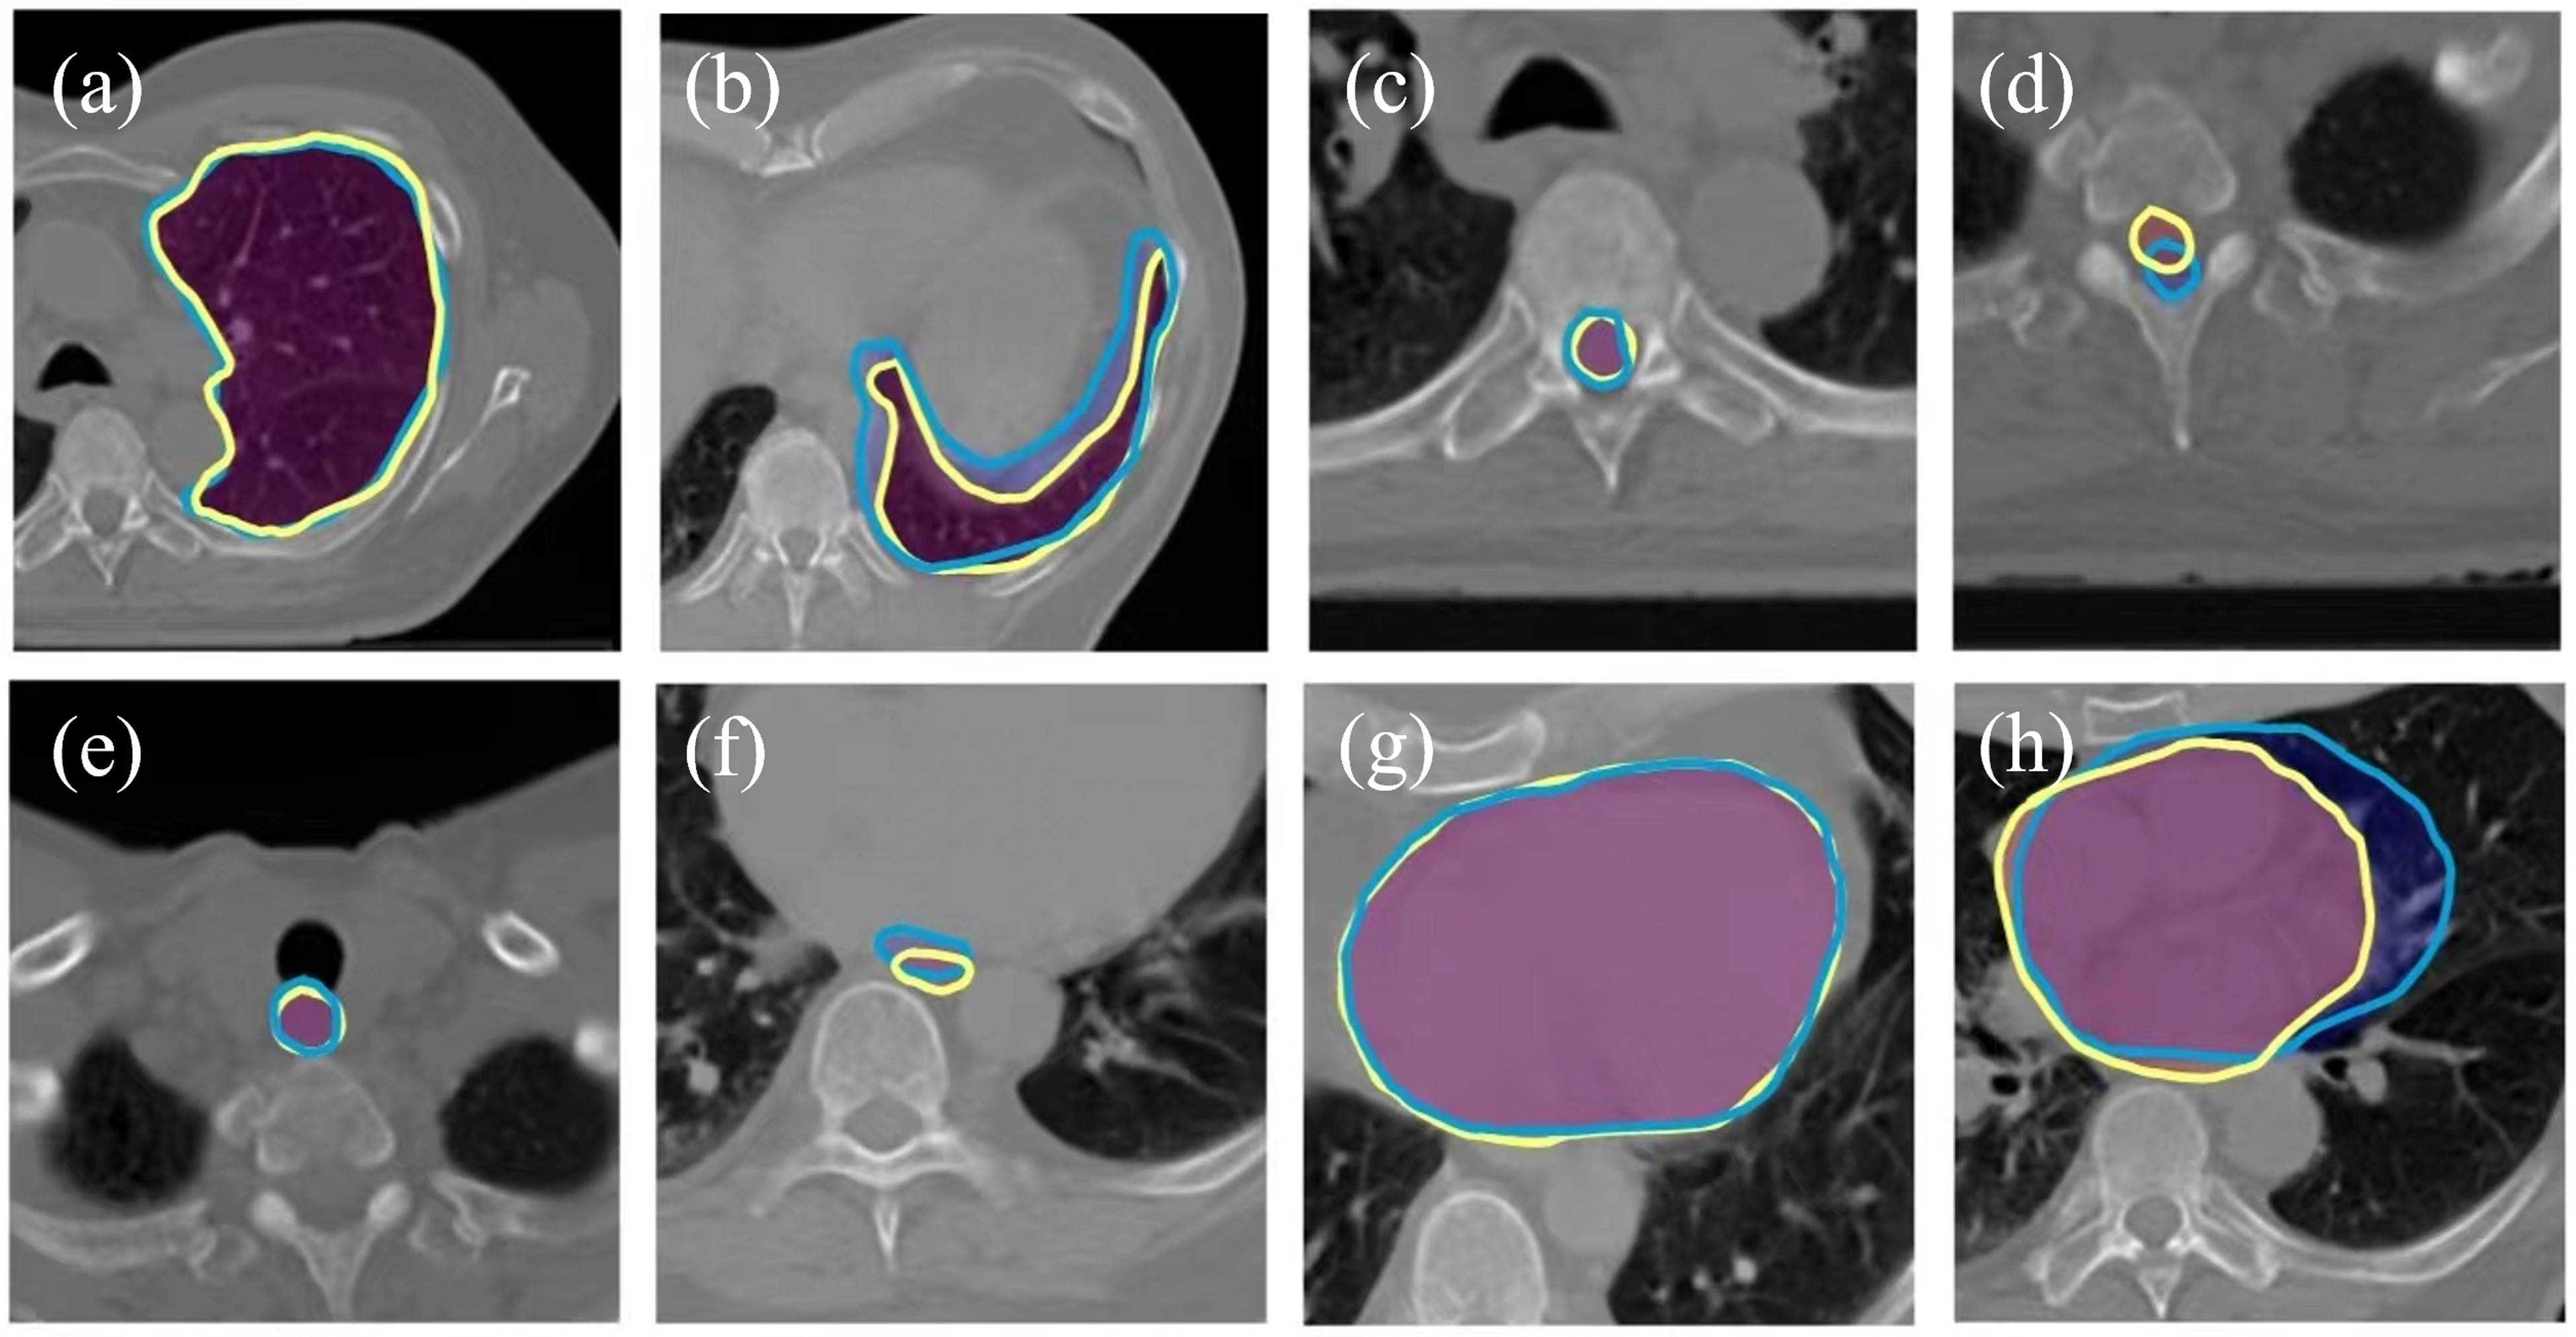
The representative contours created by expert clinicians and deep learning techniques. (a) high quality contour of left lung; (b) low quality contour of left lung; (c) high quality contour of spinal cord; (d) low quality contour of spinal cord; (e) high quality contour of esophagus; (f) low quality contour of esophagus; (g) high quality contour of heart; (h) low quality contour of heart. The yellow lines were contours generated by expert clinicians. The blue lines were contours created by deep learning techniques.
Data Preprocessing
To accommodate the variability in CT scan formats from different sources, we performed normalization by converting each scan into uint8 format, where pixel values ranged from 0 to 255. This normalization not only standardized the pixel value range, but also resulted in reduced training time and GPU memory usage. Subsequently, we converted both the manual and automatically generated contour into binary masks. By identifying non-zero pixels in the binary mask, we extracted corresponding regions of interest from the CT scans, which served as training images. To meet the input requirements of the ResNet-152 network,
36
we resized the images to dimensions of 224
Feature Extraction
In this study, we employed a region-based approach akin to an ”attention mechanism” by isolating regions of interest (ROIs) corresponding to OAR delineations from the CT images. Instead of using the entire CT image as input, which could introduce irrelevant information and reduce model efficiency, we extracted cropped regions centered around each OAR contour. This strategy ensures that the model focuses exclusively on anatomical structures critical for quality assessment, effectively filtering out unrelated background features. The ROIs were derived from binary masks of OAR delineations and resized to 224
One-class Support Vector Machine
Due to the potential presence of various error types within the automatically generated contours and the predominant inclusion of high-quality contours in the training data, a binary classifier could encounter challenges associated with an imbalanced dataset. One-class classification algorithms, referred to as outlier or anomaly detection, are designed to identify instances that differ significantly from the majority class.
28
Its primary objective is to determine whether a given instance belongs to the target class or not, without explicit knowledge or training examples from other classes. In this study, one-class support vector machine (OC-SVM)
28
was used. The advantage of OC-SVM is its capacity to detect diverse types of errors, even those that were not encountered during the training process. Furthermore, OC-SVM exhibits superior error detection capabilities compared to a binary classifier. The objective of the OC-SVM is to find a maximum margin hyperplane in feature space. It solves the following function:

where
Evaluation

where TP is the number of the samples with low-quality contour that are accurately identified by the model, FN represents the number of samples with high-quality contour that are inaccurately predicted, TN is the number of samples with high-quality contour that are correctly detected, and FP is the number of samples with contour errors that are incorrectly identified.
F-score measures the accuracy of a prediction model on a dataset. It is the harmonic mean of the precision and recall:


To expand the sample size and thoroughly evaluate the performance of OC-SVM, we additionally generated various types of errors derived from the automatically generated contours. The errors encompassed translation and resizing. To simulate a translation error, we started by randomly selecting a direction and subsequently applied a displacement to the contour using the direction and a designated distance. To create an enlargement error, a dilation kernel with a disk of radius 2 was employed to progressively enlarge the contour until low quality was achieved. The reduction error was generated using an erosion kernel, following a similar procedure as the enlargement error, but with the aim of reducing the contour size. These generated contours that did not meet the criteria (equation 5 to 7) mentioned above were labeled as low-quality as shown in Figure 3. For each high-quality contour, three distinct types of low-quality contours were systematically generated through perturbations, including translation, enlargement, and shrinkage.Given that there are 2,634 high-quality contours, this process resulted in a total of 7,902 low-quality contours. Regarding the inclusion of generated erroneous contours, we confirm that these were not used during the training phase. Instead, these artificially generated errors were exclusively utilized during the testing phase to evaluate the model’s ability to generalize and detect low-quality contours. This approach was adopted to ensure that the model was trained solely on high-quality data while reserving the generated errors for rigorous performance assessment. Since the generated dataset consists exclusively of negative samples, we are unable to calculate performance metrics such as BA, F-score, sensitivity, specificity, and AUC. These metrics require the presence of both positive and negative samples to provide the model evaluation. Therefore, we utilized accuracy as the sole metric for evaluating this dataset.

The contours with generated errors. (a) The automatically generated contour of the esophagus was labeled as high-quality, (b) the esophagus contour with translation error, (c) the esophagus contour with an enlargement error. (d) the esophagus contour with a shrinkage error. The ground truth is represented by a blue line, while the generated contours are indicated by a red line.
Detection Limit
To explore the detection limit of the quality assurance model, we conducted a series of repeated experiments to determine the magnitude of translational errors at which the identification accuracy drops below 90%. In this experiment, we randomly perturbed the OAR contour by a given distance in a random direction, considering the perturbed contours as instances of low-quality contours. Subsequently, we evaluated the performance of the proposed model and binary classifer on this set. We iteratively increased the specified distance until the accuracy dropped below 90%, which we identified as the detection limit.
To highlight the advantages of a one-class classifier in identifying unknown errors, we integrated the traditional ResNet method 30 with an OAR mask. In our experiment, an NVIDIA GeForce RTX 3080 was used in the proposed quality assurance model (Figure 1). Due to the limitation of our GPU memory, the batch size was set to 32. We used the Adam optimizer in the training of ResNet-152. The total epochs were set to 50. The training process took about 3 hours. Testing involved identifying 2000 contours within 5 minutes. On average, the prediction of the quality assurance model for the contour on a single slice took 150 ms.
Results
In our dataset, a total of 7,902 low-quality contours were identified. The proportion of low-quality contours across different organs ranged from 12% to 16%, reflecting variability in contour quality among anatomical structures. Specifically, the proportions were as follows: 13.59% for esophagus, 12.14% for the heart, 15.84% for the left lung, 16.01% for the right lung, and 14.45% for the spinal cord. These proportions highlight the variability in contour quality across different anatomical structures.
Comparison of Binary Classifier and the Proposed Model
We evaluated the performance of binary classifier 30 and our proposed quality assurance model on the test dataset. In the study by Chen et al., 30 they also utilized a similar ResNet-101 model for feature extraction. However, the difference lies in the improvements made in this paper, such as the incorporation of a mask and the use of a single classifier. As shown in Table 1, the proposed model exhibited higher balanced accuracy compared to the ResNet-101 model (Esophagus: 0.96 vs. 0.92; heart: 0.98 vs. 0.95; left lung: 0.99 vs. 0.98; right lung: 0.99 vs. 0.98; spinal cord: 0.96 vs. 0.91). The F-scores of the proposed model outperformed those of the ResNet-101 model (Esophagus: 0.97 vs. 0.93; heart: 0.98 vs. 0.96; left lung: 0.98 vs. 0.91; right lung: 0.98 vs. 0.92; spinal cord: 0.96 vs. 0.92). The sensitivity of the proposed model was superior to that of the ResNet-101 model (Esophagus: 0.96 vs. 0.93; heart: 0.97 vs. 0.96; left lung: 0.98 vs. 0.96; right lung: 0.98 vs. 0.97; spinal cord: 0.94 vs. 0.93). The specificity of the proposed model surpassed that of the ResNet-101 model (Esophagus: 0.98 vs. 0.91; heart: 1.00 vs. 0.94; left lung: 1.00 vs. 1.00; right lung: 1.00 vs. 1.00; spinal cord: 0.98 vs. 0.89). The AUC of the proposed model exceeded that of the ResNet-101 model (Esophagus: 0.96 vs. 0.95; heart: 0.97 vs. 0.95; left lung: 0.97 vs. 0.93; right lung: 0.97 vs. 0.94; spinal cord: 0.95 vs. 0.91). The ROC curve of our model and binary classifier is shown in Figure 4. The proposed model was able to achieve higher detection accuracy compared with ResNet-101 model. As shown in Figure 5, we showed some errors detected by our method and missed by the traditional binary classifier.
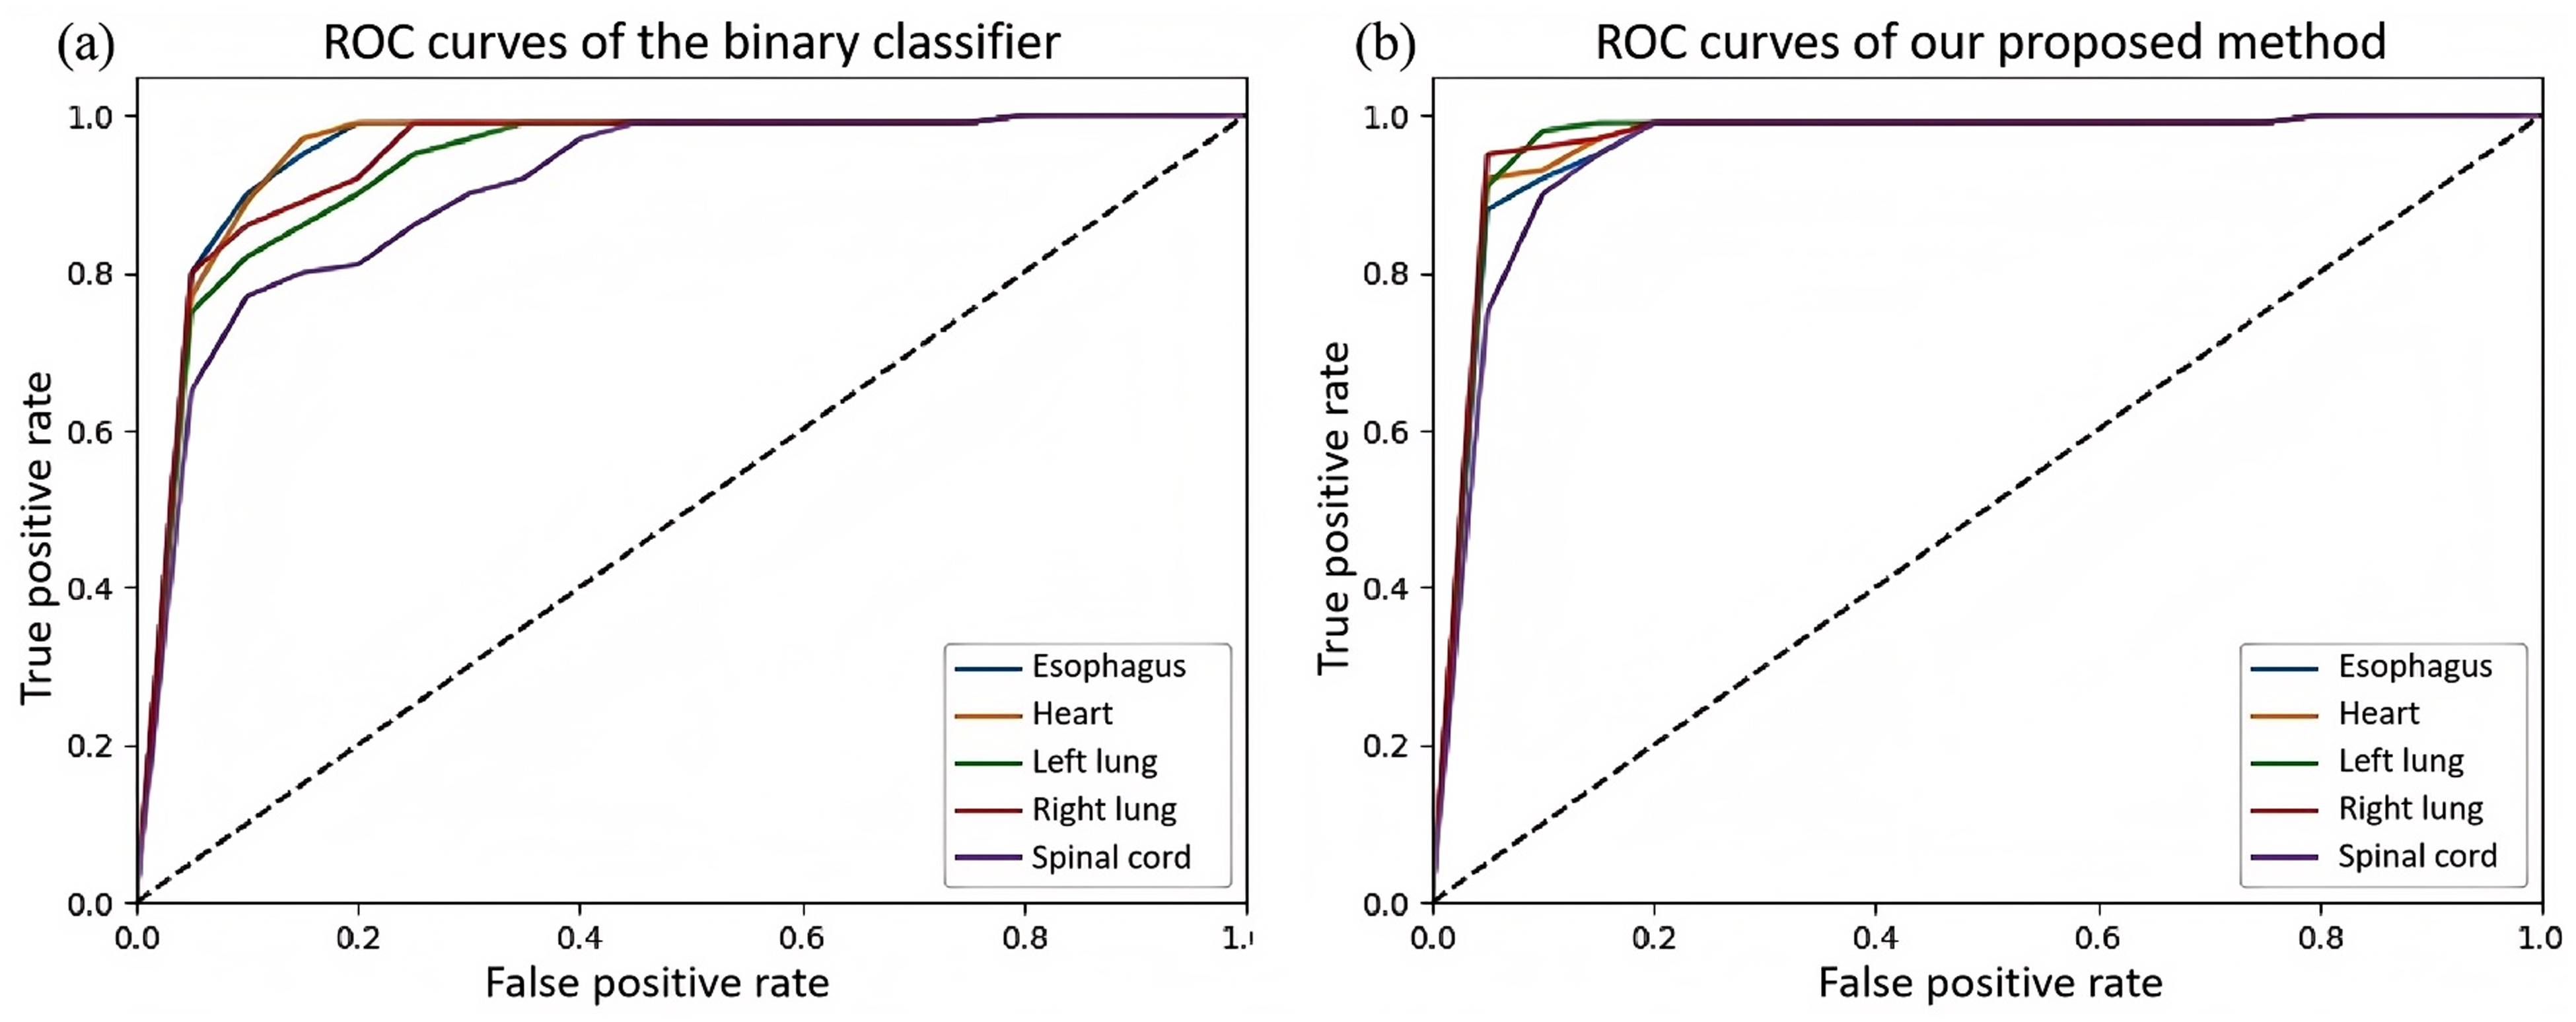
The comparison of ROC curves between (a) binary classifier and (b) our proposed method.

The comparison of the errors detected by our method and binary classifier. The contour errors in (a) and (c) were detected by both binary classifier and the proposed method. The contour errors in (b) and (d) were only detected only by the proposed method. The red line was gold standard. The blue line indicated the contour generated by deep learning technique.
The comparison of binary classifier and the proposed model on the test dataset.

Performance of the Proposed Method on Generated Dataset
The balanced accuracy of the prediction on different generated errors was shown in Table 2. The proposed method achieved a higher balanced accuracy in identifying reduction errors compared to the ResNet-101 method (Esophagus: 0.82 vs 0.46; heart: 0.83 vs 0.67; left lung: 0.85 vs 0.66; right lung: 0.85 vs 0.66; spinal cord: 0.81 vs 0.44). In terms of identifying enlargement errors, the proposed method demonstrated a superior balanced accuracy in comparison to the ResNet-101 method (Esophagus: 0.88 vs 0.50; heart: 0.86 vs 0.69; left lung: 0.88 vs 0.70; right lung: 0.88 vs 0.70; spinal cord: 0.83 vs 0.49). The balanced accuracy of the proposed method in identifying translation errors surpassed that of the ResNet-101 method (Esophagus: 0.88 vs 0.51; heart: 0.89 vs 0.70; left lung: 0.89 vs 0.70; right lung: 0.89 vs 0.70; spinal cord: 0.87 vs 0.49). As shown in Figure 6, the generated errors were detected by our method and missed by the traditional binary classifier (Figures 6c and 6d).
Detection Limit
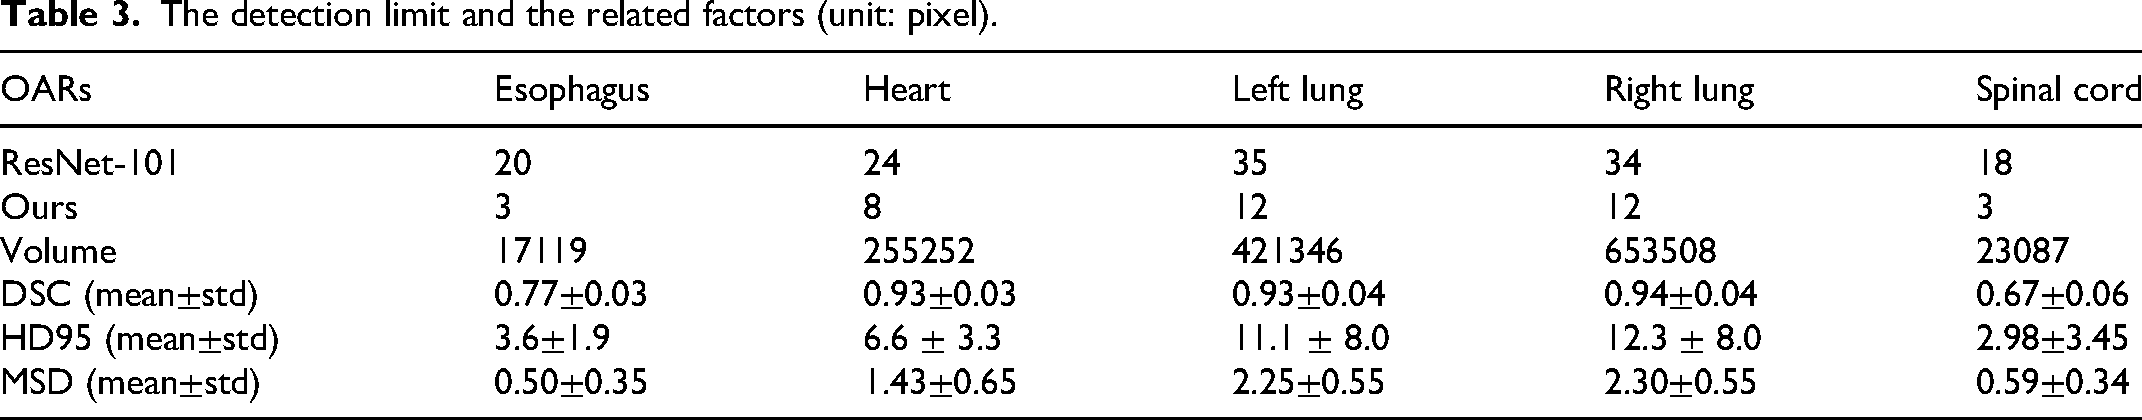
The detection limits of the proposed method and ResNet-101 on the generated dataset were shown in Table 3. The proposed method achieved higher detection limits than the ResNet-101 method (Esophagus: 3 vs 20; heart: 8 vs 24; left lung: 12 vs 35; right lung: 12 vs 34; spinal cord: 3 vs 18 (unit: pixel)). To explore the factors associated with the detection limits, we computed the volume of each OAR (Table 3) and determined the Pearson correlation coefficient (r
Discussion
In this study, we developed an automatic QA model to detect various types of errors in the contours of OARs. This model is particularly beneficial for automatic contouring methods and less experienced physicians in standard delineation. To enable the model to recognize different types of errors, we proposed a one-class classifier for anomalous OAR detection. To enhance the recognition capabilities of the model, we proposed a novel method of training with cropped regions of interest. We evaluated the method using different metrics. The results demonstrated the strong performance and compatibility of the proposed method in recognizing various types of errors. Specifically, we confirmed the following findings: The proposed one-class classifier performed well in identifying various errors in OAR delineations, exhibiting strong generalizability. The addition of an attention mechanism effectively improved the recognition of erroneous samples by efficiently filtering out irrelevant information in the images. We introduced a method to dynamically assess the quality of a segmentation from multiple perspectives, accommodating the characteristics of various OARs. The method has low hardware requirements and runs quickly, making it easy to deploy on various computers.

The comparison of the generated errors detected by our method and binary classifier. The contour errors in (a) and (b) were detected by both binary classifier and the proposed method. The contour errors in (c) and (d) were only detected only by the proposed method. The blue line was gold standard. The red line indicated the contour with generated errors.
The comparison of the balanced accuracy of prediction performance on generated datasets.

The detection limit and the related factors (unit: pixel).
Prior research in contour error detection predominantly utilized binary classification approaches.30,37 While established methods like logistic regression, random forest, Naïve Bayes, and support vector machines have demonstrated value as benchmarking tools in medical imaging analysis, their effectiveness diminishes significantly when confronted with class imbalance - a prevalent issue in clinical datasets. This limitation becomes particularly critical in radiotherapy quality assurance, where rare but clinically significant contour errors might be missed due to model bias toward majority classes.24,25,30 Our innovative application of one-class support vector machines (OC-SVM) circumvents this limitation by focusing exclusively on learning the pattern of high-quality contours, eliminating the need for extensive error samples during training while maintaining robust detection capabilities. This paradigm shift enables superior generalization to diverse error types compared to conventional binary approaches, as demonstrated in 2. The one-class framework proves particularly effective for this application because it: (1) Naturally accommodates dataset imbalance through its single-class optimization objective, (2) Enhances detection of novel error patterns through density estimation in the feature space, (3) Maintains high sensitivity without requiring explicit error examples during model training. These advantages align with recent advancements in anomaly detection for medical image analysis, while specifically addressing the unique challenges of OAR contour quality assurance in radiotherapy planning.
The scarcity of error samples has hindered the performance of previous methods. However, even a simple approach of generating error samples, such as the method proposed in this paper, and training a binary classifier can significantly enhance performance. In Henderson’s study, 22 a CNN and a graph neural network (GNN) were combined to leverage the segmentation’s appearance and shape, which automatically identified errors in 3D OAR segmentations in CT scans. To create the training and test dataset, they perturbed each ground-truth segmentation of the parotid gland by 100 times. 22 The implementation of their method in three dimensions required 3D kernels of convolution, which might lead to high computation demands for the process. To mitigate the issue of imbalanced training samples, a weighted cross-entropy loss function or cross-validation method can also be used in model training.
To validate the performance of our model in clinical scenarios, we sought to obtain results that would effectively demonstrate its capabilities. The generation of low-quality contours using random translation and resizing techniques is a strategic approach to evaluate the robustness of our models, particularly when there are limited examples of low-quality contours from automatic segmentation algorithms. This method increased dataset variability, allowing the model to identify a broader range of contour errors that may occur in clinical practice. Our model performance was assessed on both actual and synthetic datasets to confirm the effectiveness in identifying low-quality. In addition, we investigated the model’s detection limit. Our analysis 3 revealed a consistent phenomenon: the volume, DSC, HD95, and MSD of OARs exhibited a proportional relationship with their respective detection limits. This observation suggests that smaller OARs with lower baseline DSC values (e.g., esophagus, spinal cord) require more sensitive error detection thresholds, confirming that auto-delineators are indeed more prone to failures for these structures. In the future, it may be necessary to establish uniform low-quality standards for different OARs. 30 However, given that automatic delineation algorithms may exhibit varying accuracy in delineating different low-quality OARs, this approach could potentially misclassify the delineation of certain organs as low quality. To address this challenge, our future work would involve considering clinical treatment requirements and establishing organ-specific criteria for poor-quality delineation.
Numerous previous studies24,25,30,38 have demonstrated the successful application of these quality control methods to various disease sites. However, it is important to note that retraining the model may be necessary for each specific organ at risk (OAR). Additionally, challenges may arise due to unclear boundaries between certain organs and surrounding soft tissues, potentially leading to delineation errors. To address this issue, the optimization of window width and window level of the CT images may be required. Hang et al. proposed a method that utilized rigid registration to align the delineations of computed tomography (CT) images with those of magnetic resonance imaging (MRI) images. 17 Various neural networks were employed to delineate MRI images. The results demonstrated the effectiveness of their method, supporting the compatibility of deep learning-based approaches across different modalities of images. Based on these findings, we could infer that the proposed model has the potential to be extended to other modalities of medical images, such as MRI, PET-CT, and so on.
This study has several limitations. Firstly, the employment of the memory-intensive ResNet-152 network may present challenges in deployment on low-performance computers with limited GPU memory. Secondly, the dataset utilized exhibits a degree of homogeneity, which may introduce biases when the apporach is applied to datasets from different healthcare institutions. This is particularly relevant as segmentation preferences can vary significantly among physicians. To address this limitation, we plan to conduct external validation using additional datasets sourced from independent institutions in future work. Lastly, the dynamic range of computed tomography (CT) images is a critical factor influencing model performance. In this study, CT images were normalized to 8 bits, while clinical CT images are typically 16 bits, which may result in the loss of some image information.
Future research directions include the development of lighter networks, such as MobileNet, to achieve similar performance while enhancing the method’s versatility and applicability on devices with limited computational resources. We also plan to develop new network architectures specifically tailored to the characteristics of medical images. To improve the generalizability and accuracy of the model, we encourage more medical institutions to share their datasets. This will facilitate the development of more robust and reliable models. Furthermore, we envision the integration of validated large-scale models into our research, leveraging their robust compatibility and potential for recognizing various types of errors. Additionally, we aim to contribute to the establishment of industry-wide standards for deploying this research in the cloud. This will simplify the adoption and utilization of the method by healthcare institutions, potentially benefiting a larger patient population. With access to larger and higher-quality datasets, we will be able to develop increasingly accurate and effective models.
Conclusions
In this study, we present a novel quality assurance (QA) model for organ-at-risk (OAR) delineation in radiotherapy. This model incorporates two key innovations: a one-class classifier and an attention mechanism. These advancements enhance the model’s generalization capabilities and accuracy in detecting various types of delineation errors. The model’s ability to detect a wide range of errors makes it a valuable tool for ensuring the quality and consistency of OAR delineations. Furthermore, the model’s rapid execution speed significantly reduces the time and effort required for physicians to perform QA tasks, thereby streamlining the radiotherapy planning process.
Footnotes
Funding
The author(s) disclosed receipt of the following financial support for the research, authorship, and/or publication of this article: This work was supported in part by National Natural Science Foundation of China (No. 12005301), Guangdong Basic and Applied Basic Research Foundation (No.2022A1515012456), Natural Science Foundation of Shenzhen City (No: JCYJ20230807150502006), National Cancer Center/National Clinical Research Center for Cancer/Cancer Hospital & Shenzhen Hospital, Chinese Academy of Medical Sciences and Peking Union Medical College, Shenzhen (No. E010124002, E010321015, E010322028), Shenzhen High-level Hospital Construction Fund, Shenzhen Key Medical Discipline Construction Fund (No. SZXK013), Sanming Project of Medicine in Shenzhen (No. SZSM201612063), Shenzhen High-level Hospital Construction Fund.
Declaration of Conflicting Interests
The author(s) declared no potential conflicts of interest with respect to the research, authorship, and/or publication of this article.