
Abstract
Introduction
Generally, surface tissue is not only a dose-limiting anatomical structure at risk, but also a part of targeted regions in some scenarios during photon or electron radiation therapy. 1 Many factors, such as beam type and energy, 2 surface dose output factor (OF), 3 surface dose profile, 4 incident angle, 5 internal heterogeneities, 6 and patient body movement, may affect surface dose by decreasing the accuracy of surface dosimetry. The latter can lead to overdose or insufficient dose in the surface tissue region. Among these factors, quality assurance (QA) of the surface dose OF and profile is a difficult issue due to the build-up region in clinical radiotherapy. Several conventional detectors and dosimeters have been used to measure the surface dose OF and profile, such as ionization chambers, 7 TLDs, 8 MOSFETs, 9 and Gafchromic film.10,11 However, these detectors and dosimeters implicate clinical intervention by placing detectors or dosimeters on the patient surface for in-vivo dosimetry or on the phantom surface for QA of the linear accelerator (linac), 12 which would affect the surface dose distribution and result in inaccurate dose estimation. Moreover, the responses of the ionization chamber, TLDs and MOSFETs are influenced by the density effect, volume-averaging effect 13 and density-dependent disturbance of radiation fields, 14 which would decrease the measurement accuracy. Moreover, film has a nonlinear response to dose and is relatively insensitive to low dose exposures (eg, 20 cGy). 15 With advances in radiation therapy techniques, surface dosimetry has gained growing attention. Accordingly, OF and profile measurement for surface dose has become a clinical issue that needs further study.
When a charged particle moves in a dielectric medium with a velocity larger than the phase velocity of visible light in such a medium, Cherenkov emission occurs and produces Cherenkov photons with a typical continuous spectrum proportional to the inverse wavelength squared. 16 Cherenkov photons can be absorbed and scattered considerably in the medium. Ultimately, minimal Cherenkov photons are capable of leaving the surface of the medium. Due to the weak intensity of Cherenkov emission, its detection requires an imaging system with high sensitivity in a light-tight environment, such as a charge-coupled device (CCD) coupled with a focusing optics lens. Cherenkov imaging (CI) is an optical imaging modality characterizing the light signals produced by the charged particles with sufficient energy interacting with the dielectric medium.17–20 CI has been shown to be a feasible method for the measurement of dose distribution in the surface region during irradiation.21–23 However, there are some unsolved issues for surface dose measurement using CI. First, previous studies mainly discussed the influence of limited field sizes on Cherenkov light intensity 24 without quantitatively analyzing the surface dose OF using CI. Second, previous works have evaluated the surface dose profile with Monte Carlo simulation12,25 without quantitatively measuring the surface dose profile using CI. Third, the surface dose OF and profile have only been reported with regular field sizes without considering the influence of small field sizes on the results using CI. Finally, previous works did not consider the effect of flattening filter free beams and regular wedge photon fields on the accuracy of the surface dose OF and profile using CI. Therefore, the application of CI in surface dose measurements still needs further study during radiation therapy. In this work, the surface dose OF and profile are measured and analyzed quantitatively by CI during solid water phantom irradiation. Our aim is to examine the feasibility of measuring the surface dose OF and profile quantitatively in regular and small radiation therapy fields using CI.
Methods
Radiation Delivery
To explore the feasibility of measuring the surface dose OF and profile using CI, a medical linac (Elekta VersaHD, Stockholm, Sweden) was employed to deliver photon or electron fields, and a CCD (DMK 23U274) system was employed to detect Cherenkov light signals during the solid water phantom irradiation. Linac calibration was performed before radiation delivery. During Linac calibration, 1 monitor unit (MU) corresponded to 1 cGy in the water phantom at the reference depth of maximum dose on the central axis under the conditions of source to surface distance (100 cm) and reference field size (10 × 10 cm2) for all photon and electron energies. During radiation delivery, radiation fields included regular open photon fields (ROPFs) with sizes of 5 × 5, 7 × 7, 10 × 10, 15 × 15, 20 × 20, 30 × 30, and 40 × 40 cm2, regular wedge photon fields (RWPFs) with sizes of 5 × 5, 10 × 10, 15 × 15, 20 × 20, and 40 × 30 cm2, regular electron fields (REFs) with cone sizes of 6 × 6, 10 × 10, 14 × 14, and 20 × 20 cm2, and small photon fields (SPFs) with sizes of 1 × 1, 2 × 2, 3 × 3 and 4 × 4 cm2. In this study, the photon beams consisted of two filter modes including flattening filter (FF) and flattening filter free (FFF). The FF photon beams included 6 MV and 10 MV beams with maximum dose rate of 600 MU/min. FFF photon beams included 6FFF and 10FFF beams with high dose rate. The maximum dose rates of 6FFF and 10FFF photon beams were 1200 MU/min and 2400 MU/min, respectively. The electron energies included 4 MeV, 6 MeV, 8 MeV, 10 MeV, 12 MeV and 15 MeV with dose rate of 600 MU/min.
The Experiments for Surface OF and Profile Measurement
The experiments included the four following parts. Table 1 shows parameters of the experimental setup. The source to surface distance (SSD) was set to 110.5 cm only in REFs to allow an unobstructed view of the surface by the camera (Fig. 1 [e]). 24

The experimental setup for measuring the surface dose output factor and profile on a solid water phantom. Part 1: Cherenkov imaging in photon (a) and electron (e) fields. Part 2: Film measurement in photon (b) and electron (f) fields. Part 3: Ionization chamber measurement in photon (c) and electron (g) fields. Part 4: Treatment planning system calculation in photon (d) and electron (h) fields.
Parameters of the experimental setup.
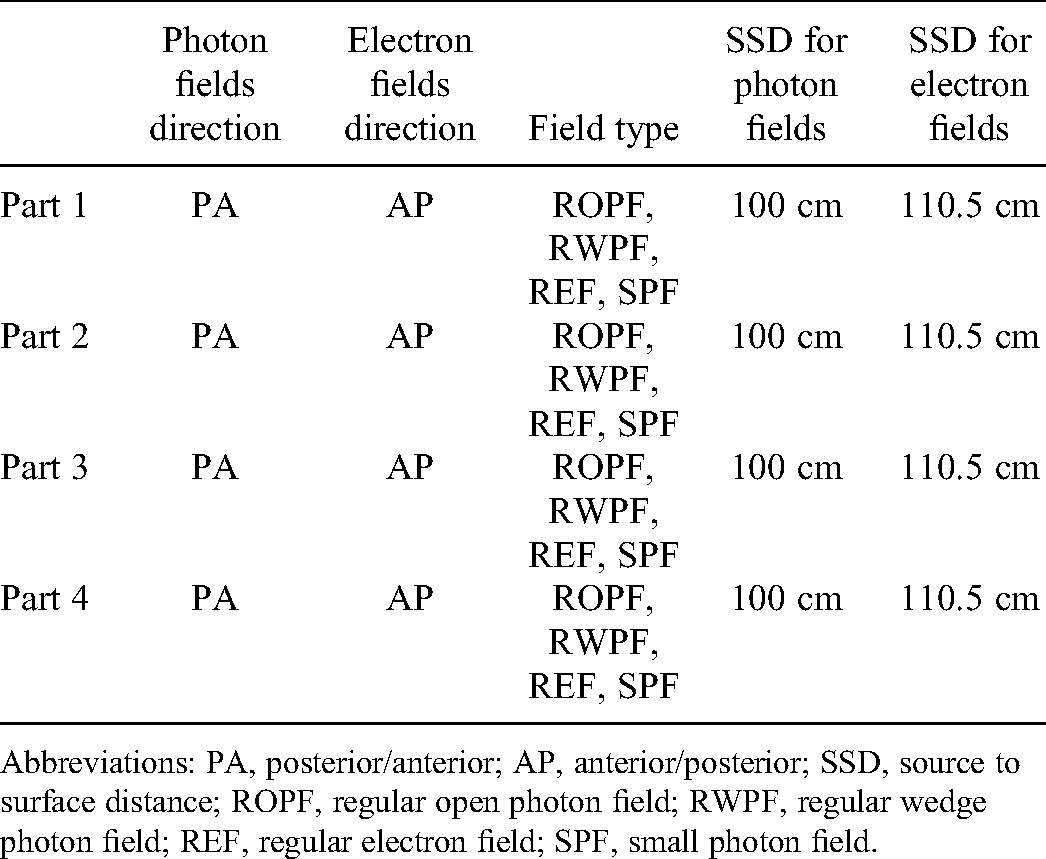
Abbreviations: PA, posterior/anterior; AP, anterior/posterior; SSD, source to surface distance; ROPF, regular open photon field; RWPF, regular wedge photon field; REF, regular electron field; SPF, small photon field.
Part 1: Cherenkov imaging for surface dose OF and profile. According to a published paper, Cherenkov light intensity had a larger value on the exit plane compared than that on entrance plane in photon fields. 12 Moreover, Cherenkov emission photons could not be detected using the CCD system on the entrance plane in this study, which was mainly due to weak Cherenkov light intensity on the entrance plane in photon fields. Therefore, photon fields were performed in the posterior/anterior (PA) direction [Fig. 1 (a)]. As shown in Fig. 1 (a, e), the solid water phantom of 300 × 300 × 20 mm was irradiated by photon or electron fields. The CCD system was employed to detect Cherenkov light signals on the phantom surface during irradiation. The camera was equipped with a high aperture lens and fixed focal length. The camera was fixed by a tripod. The anterior surface of the lens was 117 cm away from the isocenter of the linac with a downward facing angle of approximately 55° relative to an incident field. To avoid interference from background light in the CI measurement, all background light sources were blocked in the treatment room. 26 The background light sources included the fluorescent lamps, the safety lights, the air conditioning indicator lights, the display lamps, the detection plate lamps, and the hand-controlled box lamps of treatment bed. 23 During Cherenkov imaging acquisition, minimum frame rate 5 f/s and the highest gain of 36 db were adopted to acquire Cherenkov images. The acquisition time was adjusted flexibly to achieve an optimal resolution in the Cherenkov images. Finally, the acquisition time was set as 1 s, 1.2 s, 1.5 s and 1 s in ROPFs, RWPFs, REFs and SPFs, respectively.
Part 2: Film measurement for surface dose OF and profile. As shown in Fig. 1 (b, f). EBT3 films (Gafchromic, Bridgewater, NJ, USA) were placed on the anterior surface of the solid water phantom to measure the surface dose OF and profile in photon or electron fields. The film was irradiated with 400 MU in each field to obtain a high contrast in the film images. Measurements were repeated three times and the average value was used to calculate the surface dose OF and profile. Then, a Vidar scanner (Dosimetry PRO advantage red) was employed to scan the film with a resolution of 142 dpi and color depth of 8 bits at 36 h after exposure.
Part 3: Ionization chamber measurement for surface dose OF. As shown in Fig. 1 (c, g), an ionization chamber was placed on the anterior surface of the solid water phantom to measure the surface dose OF. To minimize the influence of the volume averaging effect of the ionization chamber, a 0.01 cm3 chamber (CC01, IBA Dosimetry, Schwarzenbruck, Germany) with a radius of 1.0 mm was selected to measure the surface dose OF in photon or electron fields. The output reproducibility and linearity of the ionization chamber (CC01) with respect to dose was less than 0.5%. The ionization chamber was irradiated with 200 MU in each field. Measurements were repeated three times and the average value was used to calculate the surface dose OF.
Part 4: Treatment planning system (TPS) calculation for surface dose OF. To simulate the radiation conditions of Part 1, a solid water phantom of 300 × 300 × 20 mm was scanned on a 16-slice CT scanner (Big bore, Philips Medical Systems, Cleveland, OH). The images were reconstructed with a thickness of 1 mm and then transmitted to Monaco V5.1 TPS (Elekta, Stockholm, Sweden). During planning, irradiation fields were divided into photon fields [Fig. 1 (d)] and electron fields [Fig. 1 (h)]. According to reports from the International Commission on Radiological Protection 27 and the International Commission on Radiation Units and Measurements, 28 the recommended depth for the practical dose assessments was 0.07 mm. That depth was very difficult to calculate using commercial TPSs. 29 According to a published paper, 29 we chose to define the surface dose as the mean dose in the region of the surface volume (2 mm thickness) in the TPS calculation process. The dose calculation grid was set to 1 mm. The OF calculation region included a central region with 5 × 5 × 2 mm3 in size in the anterior phantom surface. After radiation fields were completely designed, the surface dose was calculated with the Monte Carlo algorithm in ROPFs, REFs, SPFs and CC algorithm in RWPFs. 30
Surface Dose OF, Profile, Width and Penumbra Analysis
All Cherenkov images and film images were evaluated using MATLAB software (R2015b). To eliminate the impact of the residual background light in the CI measurement, a Cherenkov background image was obtained with radiation off and subtracted from the measured Cherenkov images. A film background image was obtained with a scanned film of no irradiation and subtracted from the measured film images. To eliminate the sparkle noisy signals from high-energy photons hitting the CCD directly, each Cherenkov image was obtained by a median filter over the average of three images from repetitive measurements and then smoothed by median filtering with a kernel size of 10 pixels × 10 pixels. 31 To establish the relationship between Cherenkov image pixels and size, a piece of standard coordinate paper was placed on the surface as a reference marker, as shown in Fig. 2 (a, b, c). This verified that the pixel-to-millimeter conversion factor was 32 pixels/10 mm along the central X axis and 18 pixels/10 mm along the central Y axis in Cherenkov images. Standard coordinate paper was removed during irradiation. In film images, the pixel-to-millimeter conversion factor was 56 pixels/10 mm along the X axis and 55 pixels/10 mm along the Y axis.
Phantom surface photographs with standard coordinate paper and corresponding Cherenkov images for a regular open photon field [(a) and (d)], a regular wedge photon field [(b) and (e)] and a regular electron field [(c) and (f)]. (The red quadrangle represents the 10 × 10 cm2 area in the phantom photographs or Cherenkov images).
OF is usually defined as a ratio between the dose on the central axis of a given field and the dose on the same axis of the reference field at the same depth of the phantom. In a given field, the dose on the surface central point of the phantom can be calculated by multiplying the corresponding surface dose OF by the dose on the same point in the reference field.3,32 In this study, an open field with size of 10 × 10 cm2, a wedge field with size of 10 × 10 cm2 and an electron field with size of 10 × 10 cm2 were selected as reference fields for OF measurement in OPFs (including ROPFs and SPFs), RWPFs and REFs, respectively. The OF calculation region of surface dose was defined as a central square subregion of 5 × 5mm2 in area in Cherenkov or film images. The surface dose was determined by averaging the intensity or grayscale values of the OF calculated region in Cherenkov or film images for each field. For ionization chamber measurement or TPS calculation, the surface dose was determined by measured or calculated values, respectively, for each field. For a given field, the surface dose OF was calculated by normalizing the corresponding surface dose value to the value at the reference field. The surface dose OF measured by CI was compared with that determined by film measurement, ionization chamber measurement and TPS calculation.
The profile is usually defined as the ratio between the doses on the off-axis points and that on the central axis point at the same depth of the phantom. In a given field, the dose on any surface off-axis point of the phantom can be calculated by multiplying the corresponding surface profile value by the dose on the surface central point of the phantom.33,34 Due to perspective distortion, square shape phantom looked like ladder-shaped in Cherenkov images. To minimize the impact of perspective distortion in Cherenkov images, the sampling profile regions were defined as rectangles with a short width of 1 cm. Accordingly, for Cherenkov images in ROPFs, REFs and SPFs, surface dose profile determined by CI was defined as the mean intensity profile along X direction in a chosen rectangle region of 30 cm × 1 cm (X × Y) in area, as shown in the solid red rectangle regions in Fig. 4 (6MV 5 × 5), Fig. 5 (6MV W5 × 5), Fig. 7 (6MV 1 × 1), respectively. For Cherenkov images in RWPFs, the surface dose profile determined by CI was defined as the mean intensity profile along the Y direction in a chosen rectangular region of 1 cm × 30 cm (X × Y) in area, as shown in the solid red rectangular regions in Fig. 6 (4 MeV 6 × 6). Moreover, for the chosen regions, affine transformation was implemented based on chosen points on the image to correct the perspective distortion. 24 Due to the limited film size dimension, maximum field sizes for film measurement were 15 × 15 cm2 for photon fields and 10 × 10 cm2 for electron fields. For film images in ROPFs, REFs and SPFs, surface dose profile determined by CI was defined as the mean grayscale profile along the X direction in a chosen central rectangle region of 20 cm × 1 cm (X × Y) in area. For film images in RWPFs, the surface dose profile determined by CI was defined as the mean grayscale profile along the Y direction in a chosen central rectangle region of 1 cm × 20 cm (X × Y) in area. For a given field, surface dose profile values were normalized to the maximum value. Accordingly, the surface dose profile measured by CI was compared with that determined by film measurement, as shown in Fig. 3 (b).

The profile curves and the profile comparison. (a) Profile curve illustrating the definition of field size, field penumbra and flat region, (b) Profile comparison between Cherenkov imaging and film measurement.

Cherenkov images in regular open photon fields with the sizes of 5 × 5, 7 × 7, 10 × 10, 15 × 15, 20 × 20, 30 × 30, and 40 × 40 cm2 (The red quadrangle represents a 30 × 1 cm2 area in Cherenkov images).

Cherenkov images in regular wedge photon fields with the sizes of 5 × 5, 10 × 10, 15 × 15, 20 × 20, and 40 × 30 cm2 (The red quadrangle represents a 1 × 30 cm2 area in Cherenkov images).

Cherenkov images in regular electron fields with the cone sizes of 6 × 6, 10 × 10, 14 × 14, and 20 × 20 cm2 (The red quadrangle represents a 30 × 1 cm2 area in Cherenkov images).
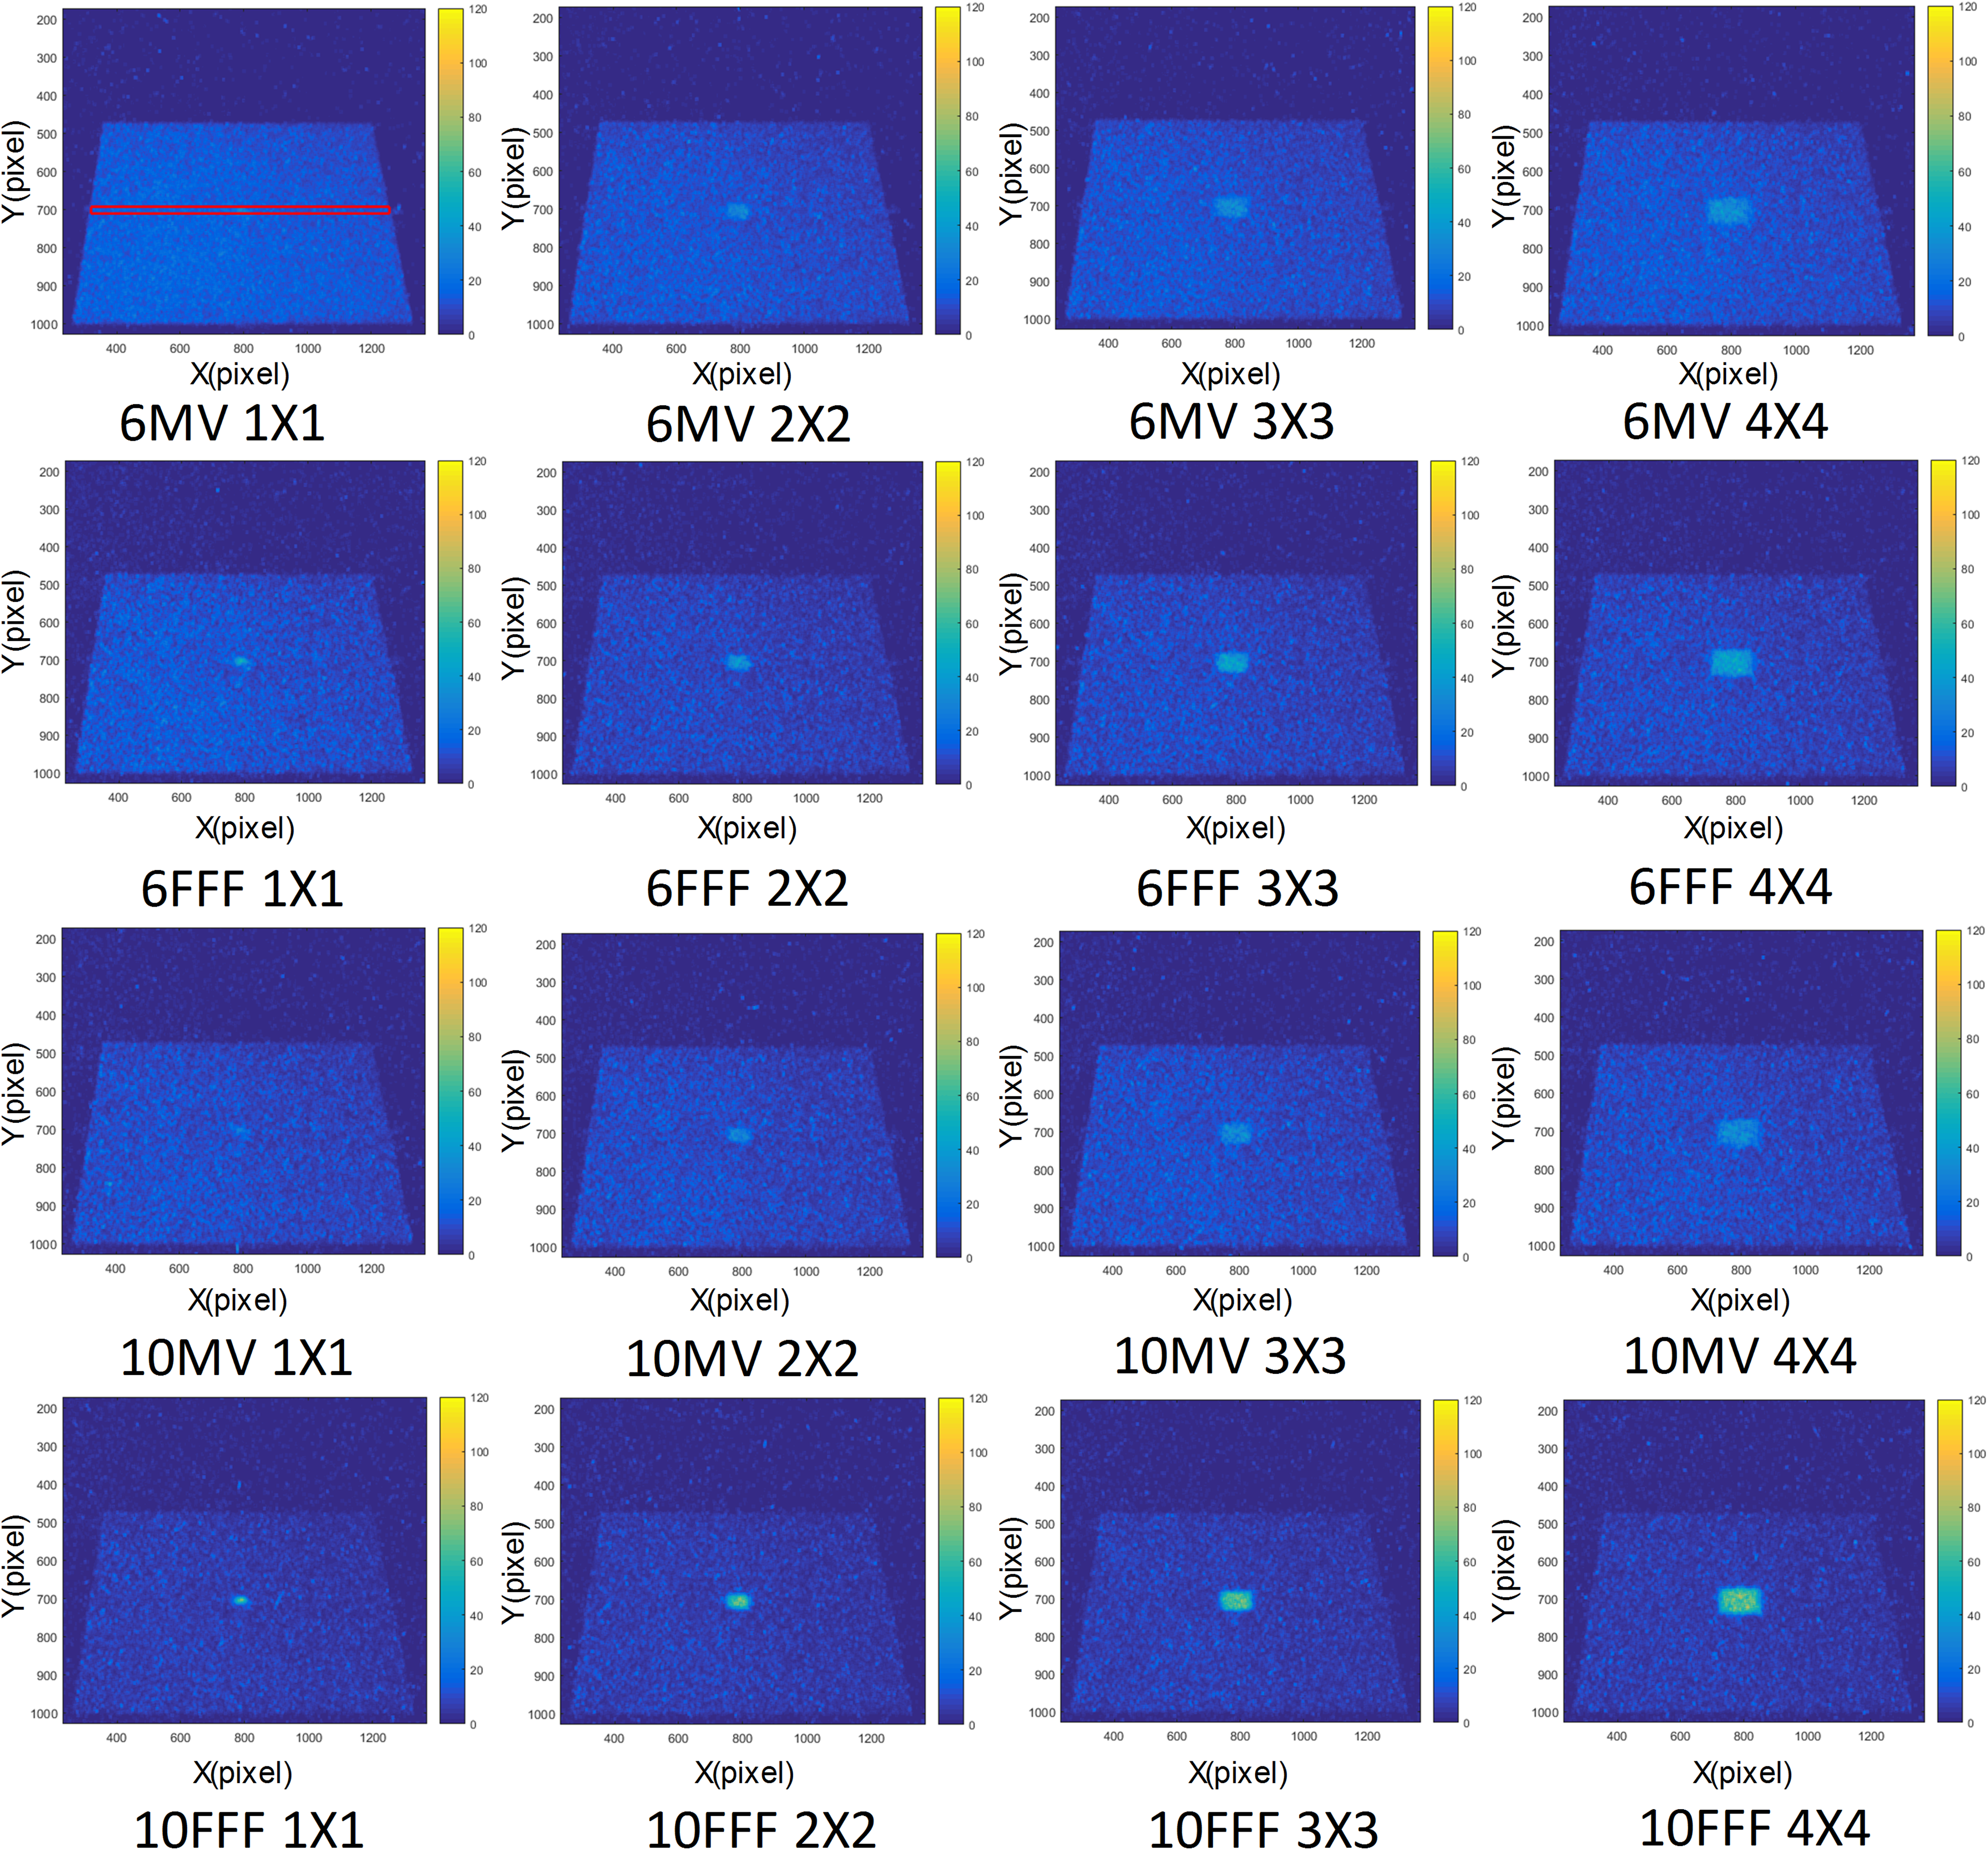
Cherenkov images in small photon fields with sizes of 1 × 1, 2 × 2, 3 × 3, and 4 × 4 cm2 (The red quadrangle represents a 30 × 1 cm2 area in Cherenkov images).
The field width and field penumbra width are defined from the profile curve, as shown in Fig. 3 (a). Field width is the distance between the ascending 50% dose point and descending 50% dose point in the profile curve. The field penumbra is the distance between the 80% dose point and 20% dose points in the profile curve, as proposed by M. Petasecca et al. 35 Flat region is bounded by 80% of the field width. Accordingly, field width and penumbra measured by CI were compared with those determined by film measurement.
Results
Cherenkov Images on Solid Water Phantom
Figures 4–7 show Cherenkov images in ROPFs, RWPFs, REFs and SPFs.
Surface Dose OF in ROPFs, RWPFs and REFs
Figures 8 and 9 and Table 2 show surface dose OF values and the discrepancy between surface dose OF measured by CI and that determined by film measurement, ionization chamber measurement and TPS calculation in ROPFs, RWPFs and REFs. The discrepancy between surface dose OF measured by CI and that determined by other methods is less than 5% in ROPFs with size smaller than 10 × 10 cm2 and less than 6% in REFs with size smaller than 10 × 10 cm2.

Surface dose OF with CI, film, ion chamber measurement and the calculation of the treatment planning system in regular open photon fields [(a), (b), (c) and (d)], regular wedge photon fields [(e), (f), (g) and (h)] and regular electron fields [(i), (j), (k) and (l)].

The discrepancy between surface dose OF measured by CI and that determined by film measurement, ion chamber measurement and TPS calculation in regular open photon fields [(a) CI versus film; (b) CI versus Chamber; (c) CI versus TPS], regular wedge photon fields [(d) CI versus film; (e) CI versus chamber; (f) CI versus TPS] and regular electron fields [(g) CI versus film; (h) CI versus chamber; (i) CI versus TPS].
Summary of the discrepancy between surface dose OF measured by CI and that determined by film measurement, chamber measurement and TPS calculation.

Abbreviations: ROPFs, regular open photon fields; RWPFs, regular wedge photon fields; REFs, regular electron fields; SPFs, small photon fields.
Surface Dose Profile in ROPFs, RWPFs and REFs
Figure 10 shows the comparison between the surface dose profile measured by CI and that determined by film measurement in ROPFs, RWPFs and REFs. In ROPFs and RWPFs, the discrepancy between the surface dose profile measured by CI and that determined by film measurement is less than 3% and 10% in the flat and penumbra regions, respectively. In REFs, the discrepancy between the surface dose profile measured by CI and that determined by film measurement is less than 4% and 10% in the flat and penumbra regions, respectively.

Surface dose profile comparison between Cherenkov imaging and film measurement in the regular open photon fields, the regular wedge photon fields and the regular electron fields. (Film measurement results in solid black line, the results measured by Cherenkov imaging in dotted red line, field boundary in solid blue line, half value in solid pink line).
Surface Dose OF and Profile in SPFs
Figure 11 and Table 2 show surface dose OF values and the discrepancy between surface dose OF measured by CI and that determined by other methods in SPFs. Figure 12 shows the discrepancy between surface dose profile measured by CI and that determined by film measurement in SPFs. In small FF photon fields except for 1 × 1 cm2 field, the discrepancy between the surface dose OF measured by CI and that determined by film measurement, ionization chamber measurement and TPS calculation is less than 3%, 5%, and 8%, respectively. The surface dose OF discrepancy value is larger than the TRS 483 recommendation (1%-2%). 36 The discrepancy between the surface dose profile measured by CI and that determined by film measurement is less than 3% and 10% in the flat and penumbra regions, respectively.

The surface dose OF values and the discrepancy between surface dose OF measured by Cherenkov imaging and that determined by other methods in SPFs [(e) CI versus film; (f) CI versus chamber; (g) CI versus TPS].

The discrepancy between the surface dose profile measured by Cherenkov imaging and that determined by film measurement in SPFs. (Profile measured by film measurement in solid black line, profile measured by Cherenkov imaging in dotted red line, profile discrepancy in dotted green line, field boundary in solid blue line, half value in solid pink line).
Field Width and Penumbra Value in ROPFs, RWPFs, REFs and SPFs
Figure 13 and Table 3 show the comparison between field width or field penumbra measured by CI and that determined by film measurement. The discrepancy between the field width measured by CI and that determined by other methods is equal to or less than 2 mm in regular open FF photon fields, SPFs, and REFs with cone size of 10 × 10 cm2, as shown in Fig. 13. The field width discrepancy is within the tolerance (2 mm) of linac QA.

The comparison between field width or field penumbra measured by CI and that determined by film measurement in regular photon fields [(a) and (d)], regular electron fields [(b) and (e)] and small photon fields [(c) and (f)]. (L represents the left field penumbra, R represents the right field penumbra).
Summary of the discrepancy between field width or field penumbra measured by CI and that determined by film measurement.

Abbreviations: ROPFs, regular open photon field; RWPFs, regular wedge photon field, REFs, regular electron field; SPFs, small photon field.
Discussion
Unlike conventional assessment methods for surface dose OF and profile, such as film measurement, ionization chamber measurement, TLDs measurement, MOSFETs measurement and TPS calculation, the assessment of surface dose OF and profile with CI does not require anything to be put on the phantom or on the patient surface during radiation therapy. Moreover, conventional detectors or dosimeters measurement require longer offline processing procedures.37,38 So they are time-consuming. The significant value of CI is the high spatial resolution with a submillimeter that most conventional detectors and dosimeters do not have. While film has similar spatial resolution, it does not have the rapid and repeated measurement ability that Cherenkov imaging has. The aim of this study is to examine the feasibility of measuring the surface dose OF and profile in regular and small radiation therapy fields using CI.
In this study, there are three main factors affecting Cherenkov light intensity in Cherenkov images. First, field size affects Cherenkov light intensity. Cherenkov light intensity increases with increasing field size in all regular and small radiation therapy fields. This is consistent with the results from previous papers.12,24,39 Second, electron scattering affects the clarity of the Cherenkov intensity boundary. The Cherenkov intensity boundary in REFs is fuzzier than that in ROPFs, RWPFs and SPFs. This could be due to electron scattering from electron fields, which makes the Cherenkov intensity boundary fussy in the REFs. Finally, FFF beams affect Cherenkov light intensity. The Cherenkov light intensity for FFF beams of a given energy is always larger than that for corresponding (same energy) FF beams. This could be attributed to the high dose rate of FFF beams, which deposits greater surface doses and excites greater Cherenkov photons, resulting in larger Cherenkov light intensity for FFF beams. This is consistent with the study by Casar B et al. 40 Moreover, compared with Cherenkov light intensity in regular open FF photon fields, higher Cherenkov light intensity appears in the middle region of the Cherenkov image in regular open FFF photon fields, which is similar to the dose distribution measured with the ionization chamber in water (Fig. 14).

The comparison between the axial dose profiles of 6 FFF and 10 FFF and the axial dose profiles of 6 MV and 10 MV in a water tank at different depths.
The first major focus of this work is to quantitatively measure the surface dose OF in regular and small radiation therapy fields using CI. There are three main factors affecting the discrepancy between the surface dose OF measured by CI and that determined by other methods. First, field size affects the discrepancy of surface dose OF. The surface dose OF increased with increasing field size in regular and small radiation therapy fields. This is consistent with the results from a previous paper.41,42 Moreover, in ROPFs with sizes larger than 10 × 10 cm2 and REFs with sizes larger than 10 × 10 cm2, the discrepancy increases clearly with increasing field size. This is mainly attributed to Cherenkov light scattering that resulted in a larger discrepancy with increasing field size, especially for fields with sizes larger than 10 × 10 cm2. However, this does not happen in RWPFs and REFs. This may be attributed to the weaker Cherenkov light intensity in RWPFs and REFs, which makes the discrepancy variance tread unclear. Second, field type affects the discrepancy of surface dose OF. RWPFs exhibits minimum surface dose OF discrepancy. This may be attributed to the lower surface dose that results in weaker Cherenkov light intensity and ultimately decreased surface dose discrepancy in RWPFs. Finally, OF- determined methods affect the surface dose OF discrepancy. In ROPFs, REFs and SPFs, the discrepancy between the surface dose OF measured by CI and that determined by film measurement is minimal, which is attributed to the superior spatial resolution for both CI and film dosimetry. Moreover, the discrepancy between the surface dose OF measured by CI and that determined by film measurement is maximum in ROPFs, REFs and SPFs. There are three reasons for maximum discrepancy. The first reason is due to the Monte Carlo algorithm, which compromises the accuracy for the calculation speed43,44 and may decrease the calculated accuracy of the surface dose. The second reason is due to voxelized phantom that do not render the surface outline well and may influence the calculation accuracy of the surface dose. The third reason may be due to the difference between definition of surface region in the TPS calculation and those in other methods, which may influence the calculated accuracy of the surface dose in the TPS calculation.
The second major focus of this work is to quantitatively measure the surface dose profile using CI. The field type affects the discrepancy between the surface dose profile measured by CI and that determined by film measurement. In ROPFs, RWPFs, and SPFs except for 1 × 1 cm2 field, the surface dose profile discrepancy is less than 3% and 10% in the flat and penumbra regions, respectively. The discrepancy of the surface dose profile is in compliance with the recommendation by IAEA TRS 430 reports. 45 In REFs, the surface dose profile discrepancy is less than 4% and 10% in the flat and penumbra regions respectively, which is consistent with the study by zhang et al. 24 In an SPF of 1 × 1 cm2, the surface dose profile discrepancy is less than 5% and 20% in the flat and penumbra regions, which suggests that the surface dose profile of 1 × 1 cm2 field still needs to be determined individually for different beam energy, different field size and different beam filtration (FF or FFF). The results show that CI has potential for measuring flatness and symmetry at the flat profile region in ROPFs, RWPFs, and SPFs except for 1 × 1 cm2 field.
In addition, the important advantage of CI is to quantitatively measure the field width in radiation therapy fields. Field size and field type affect the discrepancy between field width measured by CI and that determined by film measurement. The mean field width discrepancy in REFs with cone size of 6 × 6 cm2 is larger than that in REFs with cone size of 10 × 10 cm2. This may be due to the fuzzier Cherenkov intensity boundary in REFs with smaller cone size, which results in larger results in REFs with cone size of 6 × 6 cm2. RWPF has bigger field width discrepancy than ROPF. This may be the results of the steep dose gradient in the field boundary region in the RWPFs, which results in the larger field width discrepancies in the RWPFs. In regular open FF photon fields, SPFs, and REFs with cone size of 10 × 10 cm2, field width discrepancy is within the tolerance recommend by the guidelines of linac QA, 46 which is consistence with study by Miao et al. 21 It means that Cherenkov imaging can be used to accurately measure field width in regular open FF photon fields, SPFs, and REFs with cone size of 10 × 10 cm2.
Another important advantage of CI is to quantitatively measure the field penumbra in radiation therapy fields. There are three main factors affecting the discrepancy between the field penumbra measured by CI and that determined by film measurement. First, the measured methods affects the field penumbra discrepancy. The field penumbra discrepancy has a positive value in all fields. This means that the surface dose profile measured by CI has a larger field penumbra value than that determined by film measurement, which is mainly due to the fuzzy Cherenkov intensity boundary that results in a larger field penumbra measured by CI. Second, beam energy affects the field penumbra discrepancy. The size range of the field penumbra discrepancy decreases with increasing beam energy in all fields. This may be attributed to the clearer Cherenkov intensity boundary in higher energy fields, which reduces the field penumbra discrepancy. Finally, field type affects the field penumbra discrepancy. SPFs exhibit a minimum field penumbra discrepancy compared with other fields. However, the penumbra discrepancy percentage is maximum, which is due to fewer field penumbra values in SPFs. For example, the maximum penumbra discrepancy value and penumbra discrepancy percentage are 2.7 mm and 39.1%, respectively, at the right penumbra with 6 FFF and a 1 × 1 cm2 field, which is similar to the study by Azzi et al. 47
In this study, Cherenkov imaging provides a valid way to remotely confirm the surface dose OF, surface dose profile, field width and field penumbra. The major benefit of this approach is that testing can be done completely under software control with a fixed installation of the camera, which potentially simplifies conventional QA procedures and improves the efficiency of clinical work. However, in this study, the research of this approach has some limitations, such as the evaluation of only simple fields and the irradiation of only uniform plane phantom. Future work will be required to evaluate small fields and small MUs generated by intensity-modulated radiotherapy (IMRT) or volumetric-modulated arc therapy (VMAT), and the irradiation of cylindrical or anthropomorphic phantom with various gantry angles and irregular surfaces. Moreover, the definition of surface dose differs depending on the measurement devices, such as CCD, CMOS, ICCD and EM-ICCD. Future work will also be required for comparison of surface doses measured by different measurement devices for Cherenkov imaging.
Conclusion
Cherenkov imaging was adopted to measure the surface dose OF and profile in regular and small radiation therapy fields in this study. This capability is evaluated by comparing the surface dose OF and profile measured by CI and that determined by film measurement, ionization chamber measurement and TPS calculation. We conclude that Cherenkov imaging can be used to quantitatively measure the surface dose OF and profile on a solid water phantom. Moreover, the discrepancy between the surface dose profile measured by CI and that measured by other methods is in compliance with the recommendation by IAEA TRS 430 reports in ROPFs, RWPFs, and SPFs except for 1 × 1 cm2 field. The field type affects the surface dose profile discrepancy. The discrepancy between field width measured by CI and that measured by film measurement is within the tolerance recommend by the guidelines of linac QA in regular open FF photon fields, SPFs, and REFs with cone size of 10 × 10 cm2 in area. 46 The field size and field type affect the field width discrepancy. Therefore, it is feasible to use CI to measure the surface dose profile and field width in regular open FF photon fields and SPFs except for 1 × 1 cm2 field.
Footnotes
Abbreviations
Acknowledgments
All authors helped to collect and analyze data. Their support and helps should be appreciated.
Declaration of Conflicting Interests
The authors have no relevant conflicts of interest to disclose.
Funding
This work was supported by the National Natural Science Foundation of China (61975232, 61775234, and 11604377), Qingdao National Laboratory for Marine Science and Technology of China (QNLM2016ORP0111), the Major International (Regional) Joint Research Project of National Natural Science Foundation of China (42020104008), the Key Program of National Natural Science Foundation of China (41530422), National High Technology Research and Development Program of China (863 Program) (2012AA121101).
Ethics Statement
All analyses were not reporting animal and human studies, thus no ethical approval is required.