
Abstract
Keywords
Introduction
Modern radiotherapy (RT) delivery methods enable radiation doses that are conformal to tumor target volumes while reducing the damage to normal tissue. Precise dose distribution relies on accurate segmentation of the target and organs-at-risk (OARs) to improve local tumor control and normal tissue protection. Therefore, tumor targeting and OARs segmentation is a key step in RT treatment planning. However, most contours are performed manually by oncologists in medical images slice-by-slice, which is not only subjective but also time-consuming.1–4 To avoid these problems, deep learning methods have been incorporated into RT clinical practice5–15 by some researchers, as the method can save time and reduce delineation deviations between different oncologists. With the development of deep learning methods, different convolutional neural network (CNN) models such as U-Net, 16 V-Net, 17 and nnU-Net 18 have been proposed and used in clinical medicine, and accurate and automatic segmentation of OARs and tumor targets have become possible. Even when using the most precise model, some delineation problems may occur because of the considerable variability in clinical medical images. Thus, manual inspection by the physician is still needed; this human intervention is time-consuming as unpredictable errors need to be modified layer by layer.
Traditionally, evaluating the segmentation quality involves comparing the predicted contours with the ground-truth contours (manually generated by an experienced physicist and independently verified by a radiation oncologist).19,20 However, it might be impossible to use the traditional measure to assess automatic segmentation quality if some contours lack the ground-truth contours. Therefore, a new method to evaluate segmentation quality without requiring ground-truth contours is crucial for clinical practice.21–23 Altman MB et al 24 developed an automated system that used historical data (the “knowledge base”) for contour quality assurance (QA). Chen HC et al 25 utilized a general strategy that used supervised geometric attribute distribution models to automate contouring error detection. Men K et al 26 used deep active learning to automatically assess OARs contours. Claessens et al 27 proposed a knowledge-hybrid quality control system that combines the advantages of different strategies. Hung C et al 28 proposed an independent secondary segmentation model that was integrated into the main automatic segmentation method, then an machine learning (ML) classification model was used to predict the quality of the main methods based on comparative metrics. These methods have limitations. For example, metrics are not always dependable indicators for QA, or a ground-truth for evaluation may be needed. However, in real clinical practice no ground-truth is available. For a more review about QA of DL segmentations, we refer readers to references.19,20
In this study, a fully automatic QA method based on image texture 29 and ML is proposed. This QA method adopted an integrated ML model for quality prediction and used an anisotropic method for further analysis. The aims of this study were to (1) investigate the accuracy of different ML models to predict different head-and-neck (H&N) OARs; (2) evaluate the specificity and sensitivity of ML to select the best model for specific organs; (3) show that the location information of delineations does not meet clinical criteria based on the anisotropic method. This is the first attempt to merge isotropic, anisotropic, and ML methods in the field of RT for the QA of automatic segmentation. This method can quantitatively provide segmentation quality and qualitatively analyze segmentation results. Combining our method with automatic segmentation software will help achieve full artificial intelligence without manual intervention.
Methods
Overview
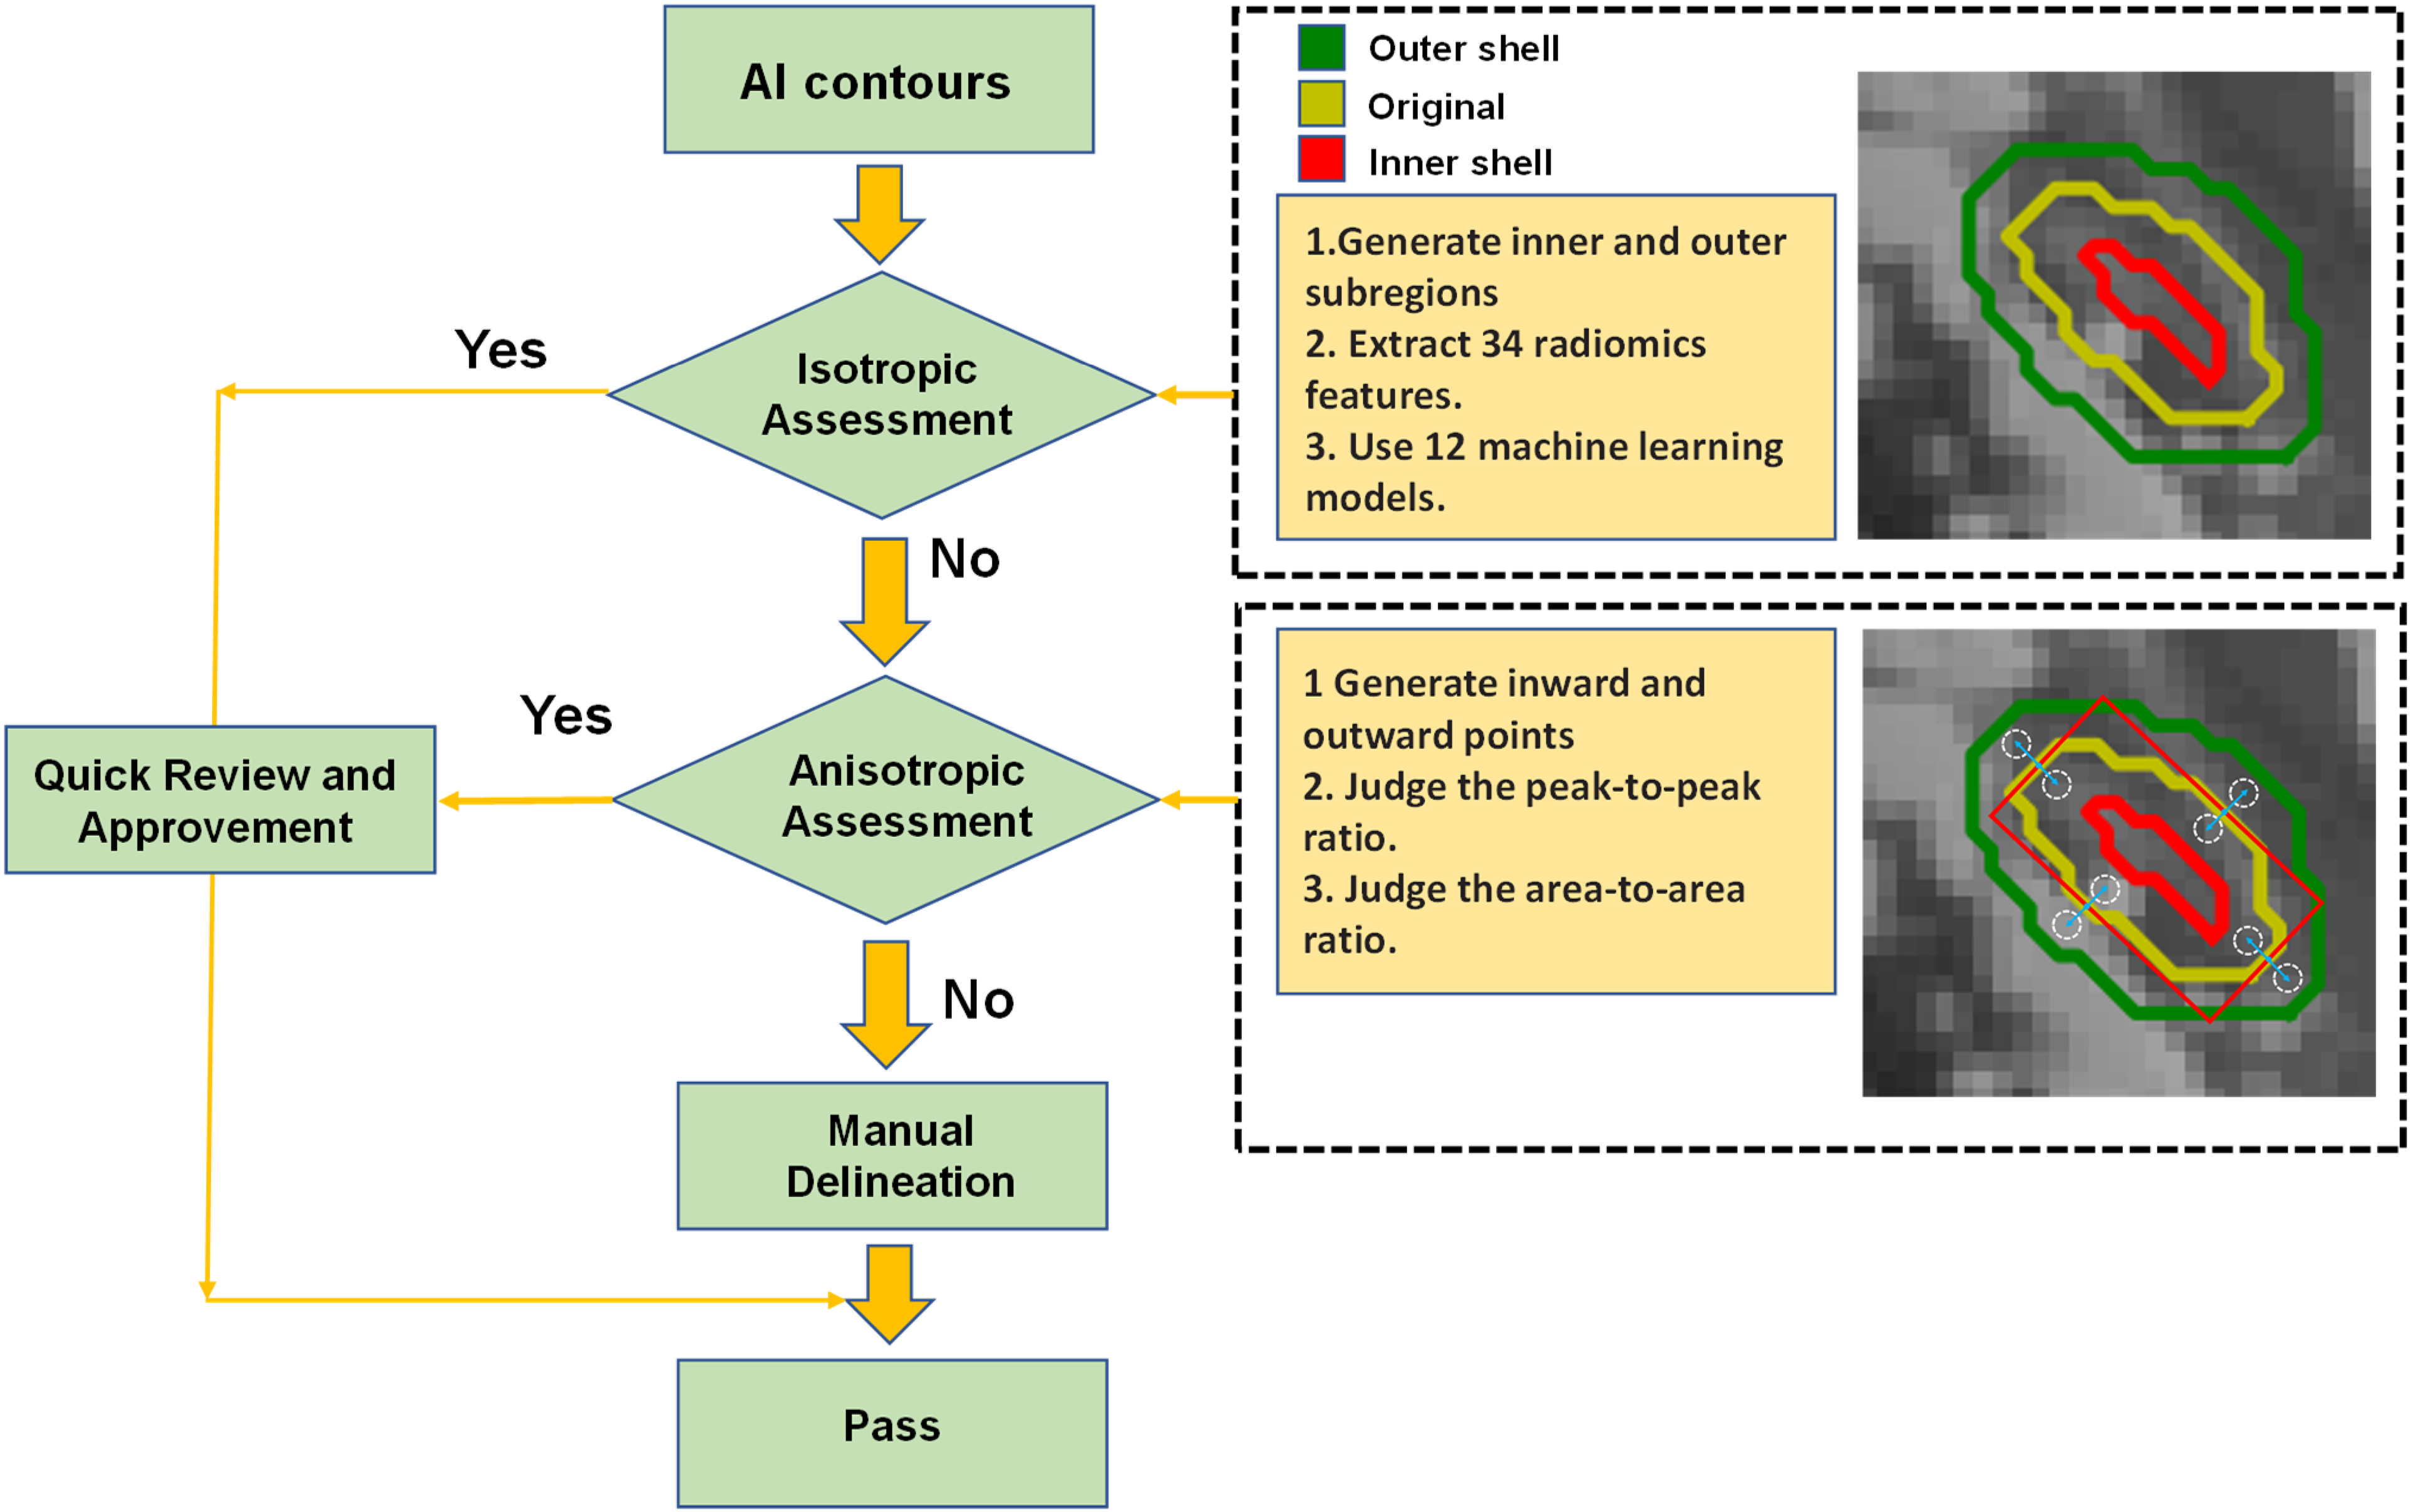
Figure 1 shows the flowchart of the automatic QA tool. This QA tool evaluates the Artificial Intelligence (AI) contours by isotropic method and anisotropic method. Each 2D contour was divided into inner and outer subregions based on the original contour position. The isotropic method assumed that the ratio of geometric and texture features of the 2 subregions for each organ was constant. If the isotropic assessment failed, the anisotropic method would generate inward and outward points in specific directions to get the gray histogram threshold values. The peak-to-peak ratio and area-to-area ratio analysis were performed to display the anisotropic results. When the contours meet the threshold values of isotropic methods or anisotropic methods, the QA results will be sent to doctors for a quick review and approvement. For contours that have not passed the isotropic and anisotropic threshold, these contours need to be carefully reviewed and manually modified.
The overall auto-segmentation QA process.
The overall process has the following 4 steps. Steps 1-3 are isotropic methods, and step 4 is the anisotropic method.
We pre-trained U-Net using 177 sample computed tomography (CT) images from Québec Public Dataset, and extracted 10 patient data from our local datasets to fine tuning the weights of U-Net model. Then use 196 samples to generate a series of automatically segmented contours, which were compared with the gold standard contours and generated Dice Similarity Coefficient (DSC) values as labels. In this way, data diversity and generalization can be greatly improved. We used the auto-segmentation contours as organ masks to generate inner and outer shells and then extracted quantitative geometric and multi-scale texture features from the inner/outer shells. The inner and outer shells were generated by eroding and dilating the organ mask by 1 to 4 mm on each 2D slice. These features were used to predict DSC values. Based on the prediction accuracy, we selected the best performance of the corresponding ML model for each OAR to obtain the DSC values. Then, we ranked the features’ importance and deleted some unimportant features to maximize the model's prediction efficiency. We set a threshold to automatically evaluate segmentation results (“good” or “bad”) without manual inspection in layers. The pixel values of inward and outward points in specific directions were obtained. Then we used threshold analysis (peak-to-peak ratio and area-to-area ratio) to assess the location information for un-passing segmentation contours and displaying error reports. The peak-to-peak ratio and area-to-area ratio referred to the ratio of pixels with the highest frequency and the area under the curve of the grayscale histogram between the 2 points, respectively.
Patient Data
We use 177 samples from Québec Public Dataset and 10 datasets from Hubei Cancer Hospital to pre-trained U-Net model. The test dataset contains Hubei Cancer Hospital dataset (50 patient samples), Anhui Provincial Hospital dataset (100 samples), and the Head-Neck Cetuximab collection (46 samples). Each sample contained 18 cases of H&N OARs, which are parotid left, parotid right, mandible, eye left, eye right, inner ear left, inner ear right, larynx, len left, len right, optical nerves, optical chiasm, oral cavity, esophagus, pharyngeal, brain stem, spinal cord, and temporal lobe. The gold-standard contours were manually delineated by the oncologists in the Hubei Cancer Hospital. The CT scan from the Hubei Cancer Hospital had a reconstruction matrix of 512 × 512, in which the pix space was 0.5 to 1.0 mm and slice thickness was 3 mm.
Pre-Processing
Random scaling (from 0.5 to 1.5), random cropping, and random rotation (−5° to 5°) were applied to avoid overfitting. We used bilinear interpolation to adjust each slices’ pixel spacing to 1 mm and then used the zero-padding method to fill all slices’ pixel sizes to 512 × 512 uniformly. This was because some slices’ sizes were less than 512 × 512 pixels after using bilinear interpolation. Next, we used different window widths and levels to process different regions of interest areas to eliminate interference and enhance the interest region. In addition, the pixel values are normalized between 0 and 1. Considering that the QA algorithm relies on relatively uniform intensities, however, the existence of noise can significantly affect this hypothesis. As a result, we manually add noise to the images in the preprocessing stage to improve the system robustness.
Segmentation Model
There are many different deep learning networks available for segmentation. We selected U-Net as the segmentation model because it has demonstrated outstanding performance in the medical image segmentation field. 16 It uses contracting path architecture to capture context and symmetric expanding path for precise localization. Since the segmentation model is not the focus of this article, we only briefly introduce it.
Obtaining Features in the Isotropic Method
We use 196 samples to extract the radiomics features as inputs for the ML models and use 10-fold cross-validation to train ML models. Figure 2 shows the overall process. The yellow contour in Figure 2A was segmented by the U-Net network. Then, we used this contour as an organ mask to generate inner and outer shells on each 2D slice, as shown in Figure 2B. Thus, each 2D contour was divided into 2 subregions: one was the inner shell, as shown in Figure 2D(a), and the other was the outer shell, as shown in Figure 2D(b). Our research shows that different OARs have different inner/outer shells. Through multiple comparative studies, we found that the brain stem, parotid gland, and some other large organs needed wider erode/dilate 4 mm on the mask to generate wider inner/outer shells, which would improve the predictions. In contrast, other small organs such as the optical nerves needed thinner 1 mm inner/outer shells. If the shells are too thick, they will contain other organs, which will influence the results.

The overall process of the extracted radiomics features in the isotropic method.
Then, 38 radiomics features were extracted from these 2 shells using the Python 3 package. Table 1 lists all the features extracted from the 2 shells in each 2D slice, namely 5 intensity histogram-based (mean, standard deviation, range, skewness, and kurtosis), 5 gray-tone-difference matrix-based (coarseness, contrast, busyness, complexity, and strength), 4 frequency-component-based (low, horizontal high, vertical high, and diagonal high), 16 gray-level uniformity-based, 5 transform-based features, and 3 morphological features.
Radiomics Features That Were Used as Inputs for the ML Models.

We adopted 12 different ML models to predict the DSC values of 18 different OARs. Through experience, we have found that integrated algorithms such as random forest RF, AdaBoost, and Gradient Boost have superior prediction performance than other algorithms. The reason is that these algorithms can use the ensemble method to substantially enhance prediction accuracy. For example, these kinds of algorithms can easily understand every feature's contribution to the prediction result and assign a higher weight to important features.
There is a large advantage provided by integrated models such as XG-Boost because it can use built-in functions to analyze feature importance. We selected the best-performing ML model for different OARs to assess the features. The features were chosen to build the model of 18 different OARs, and we ranked the features’ importance.
To analyze the QA results qualitatively and objectively, we used the predicted mean DSC value and the standard deviation (σ) of the predicted mean DSC value (the means and standard deviations of DSC are calculated from test samples, and different OARs have different DSC passing criteria) as the metrics to describe the accuracy of the contour.
26
Passing criteria were applied to all the H&N OARs according to formula 1.
Obtaining Features in the Anisotropic Method
Through the passing criterion method, we automatically obtained a series of “correct” slices and “incorrect” slices. However, the method can only provide passing or un-passing slices qualitatively rather than figure out the disagreement location of the “incorrect” segmentation. An anisotropic method is proposed to address this challenge, as shown in Figure 3.
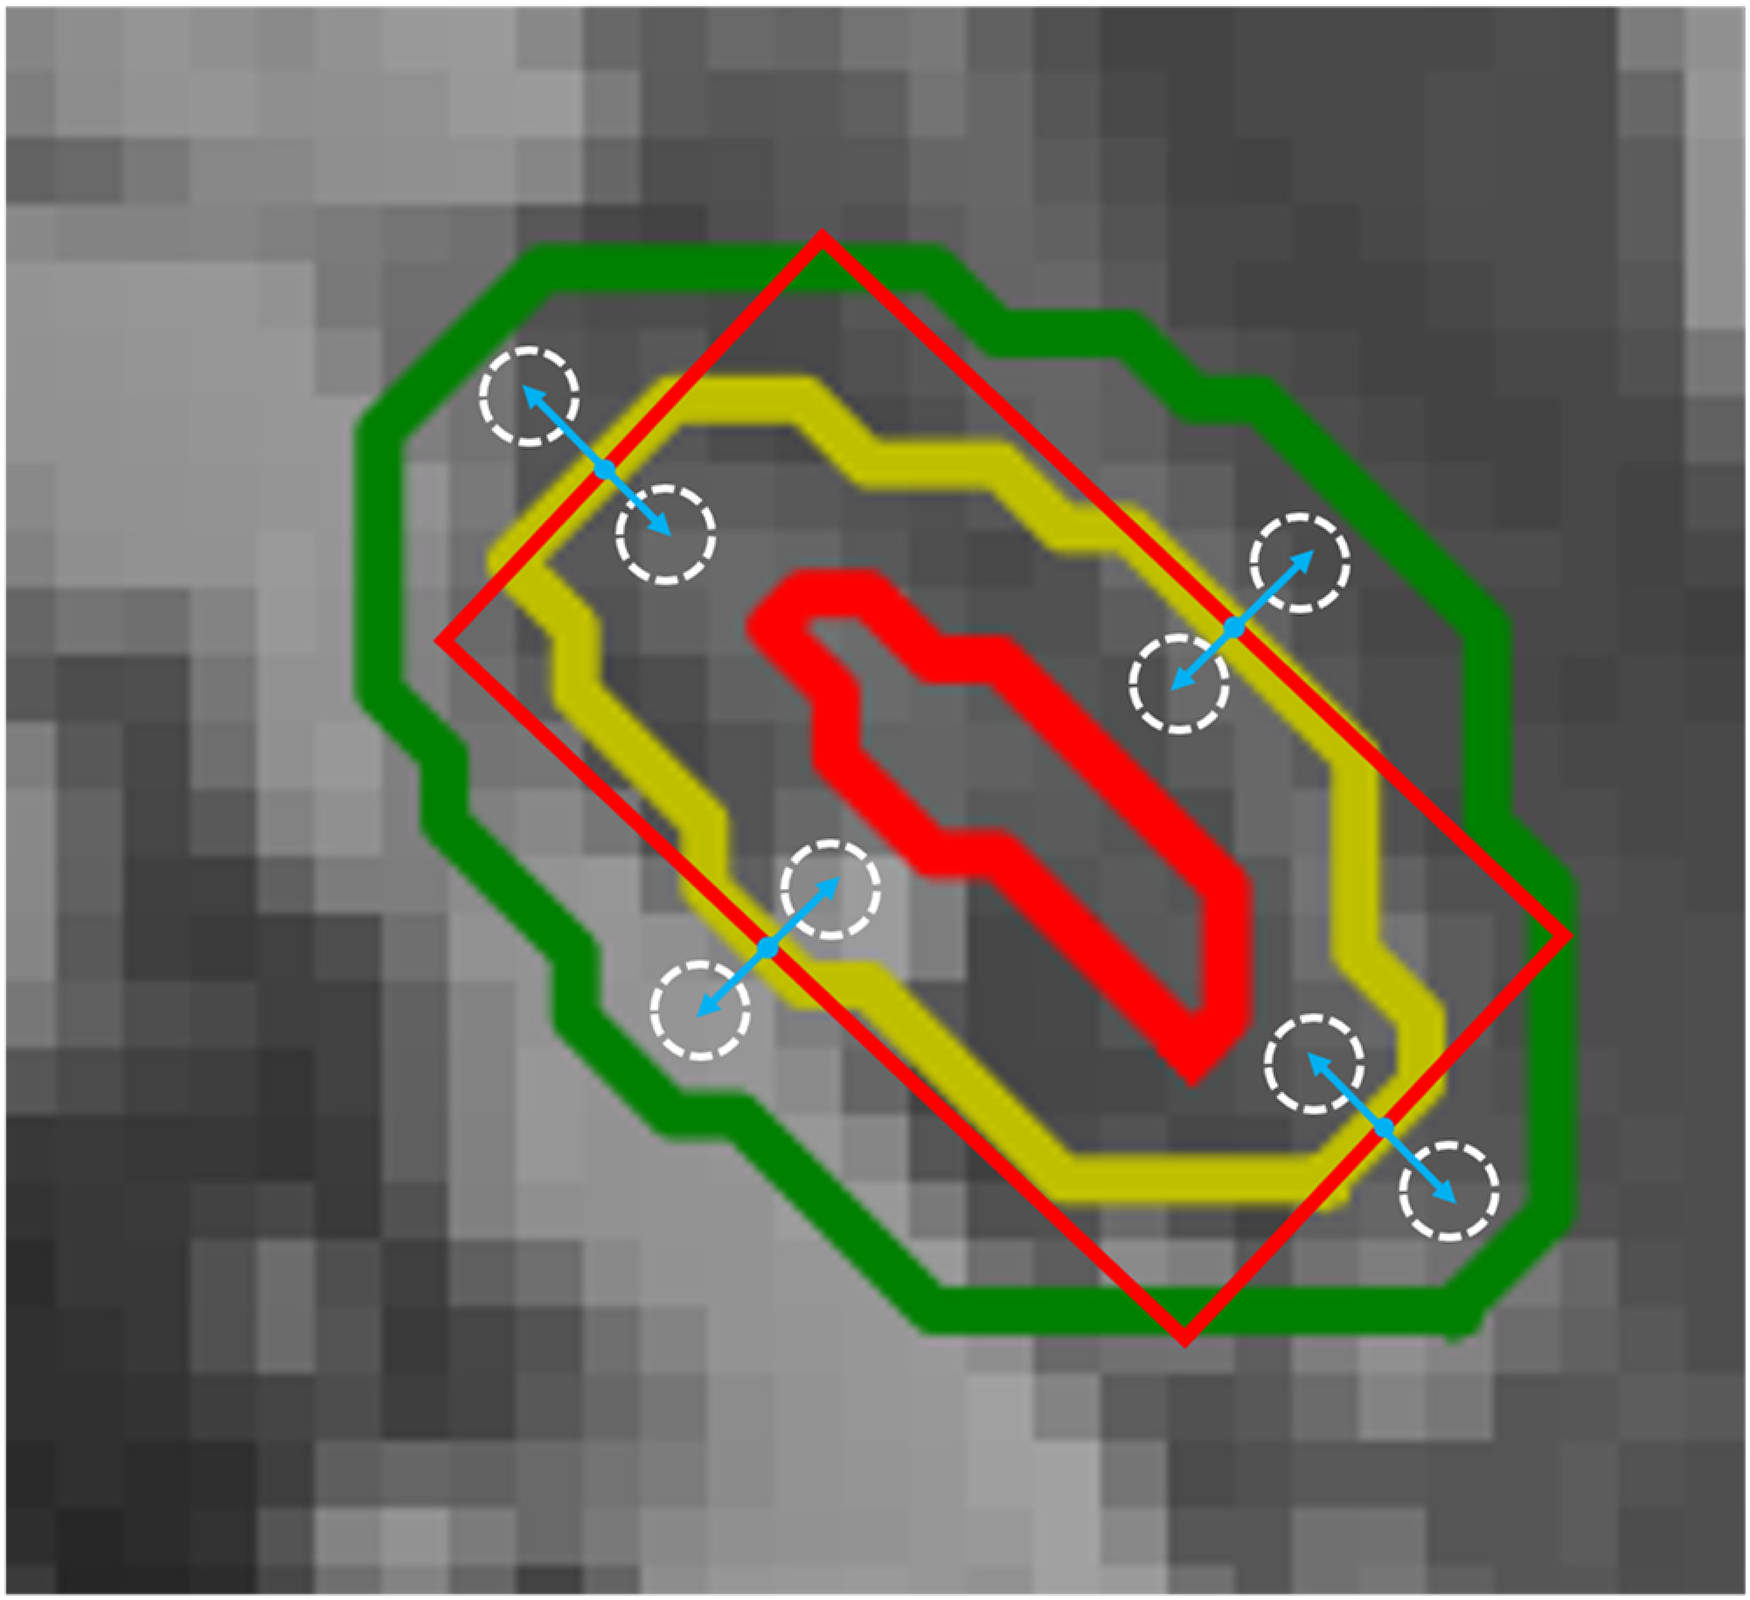
Extracted normalized grayscale features in the anisotropic method to calculate the peak-to-peak and area-to-area ratio.
First, we defined each 2D slice H&N OAR label as masks and then used the minimum external moment (MEM) method on the masks to generate 4 different points. Those points were the intersection points of the masks and MEM. Considering intersecting a curve with principal axes could produce less or multiple intersections. For multiple intersections, we use the K-Means clustering algorithm, which chooses K = 4 by prior experience, and based on the Euclidean distance update algorithm, then take 4 cluster centers as intersection points. For less intersections, the system will automatically send an error report to the doctor for subsequent manual verification. Next, we moved these intersection points inward/outward in the contour tangent direction. We have found that large organs such as the parotid gland need longer distances of inward/outward, up to 3 to 5 mm; in contrast, some small organs need a short range of inward/outward, of around 1 to 2 mm. We obtained 4 inward points and 4 outward points in different positions through this method. Third, inspired by meta-learning, which has been proven to be feasible by reflecting global information through a small amount of data, we used each inward/outward point as the center and 3 to 5 mm or 1 to 2 mm as the radius to obtain circles and extracted the normalized grayscale features from these circles to calculate the peak-to-peak (the ratio of pixels with the highest frequency) and area-to-area ratios (the area under the curve of the grayscale histogram).
To qualitative and objectively assess the reason for “incorrect” slices, we used the mean peak-to-peak (dilate/erode) ratio, mean area-to-area (dilate/erode) ratio, and the standard deviation of the mean peak-to-peak and area-to-area ratios as the metrics to calculate the OARs’ threshold (the means and standard deviations of peak-to-peak and area-to-area ratios are calculated from test samples, and different OARs have different peak and area passing criteria). The formulas are as follows:

Manual Verification
For contours that do not pass the isotropic method or the anisotropic method, the physician needs to carefully examine and manually correct these contours. For the problems that happen during the system evaluation process such as anisotropic circles beyond the organ boundaries or no intersection of the MEMs, the system will automatically send a failure report to the doctor and point out the cause of the failure. Although the system still requires manual verification by the physician, however, we were able to increase efficiency compared to the traditional method.
Results
Table 2 presents the accuracy of the automated segmentation, which was evaluated using cases in the test dataset by the isotropic method that contained 12 different ML models, 18 H&N OARs, and 38 features. All H&N OARs’ real DSC values (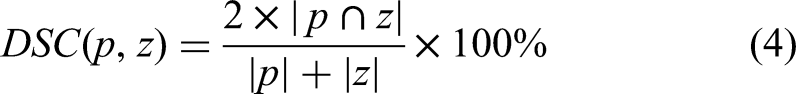
Using 12 Different Machine Learning Models to Assess the Accuracy of Different H&N OARs Predicted DSC Values.

Abbreviations: LR, linear regression; KNN, KNN regressor; DT, decision tree; ET, extra tree; XGB, XG-Boost; RF, Random Forest; AB, AdaBoost; GG, Gradient Boost.

It is obvious that random forest, gradient boost, and AdaBoost showed better prediction accuracy for most OARs. We integrate these 3 models to predict the H&N OARs DSC values and selected the optimal results in the integrated architecture. The accuracy rate of prediction results for each H&N OARs reached 90%; len left, inner ear right, and optical chiasm accuracy rates were 86.04%, 86.27%, and 89.96%, respectively. These good prediction results show that this method can efficiently predict DSC values without the ground-truth contours. The best prediction accuracy for each OAR is shown in Figure 4. The x-axis of each subplot in Figure 4 represents the DSC value obtained from the contour of the neural network prediction and the ground-truth by Equation 4, and the y-axis shows the DSC prediction by the optimal ML model. Almost all slice values are distributed near the 45° diagonal line.
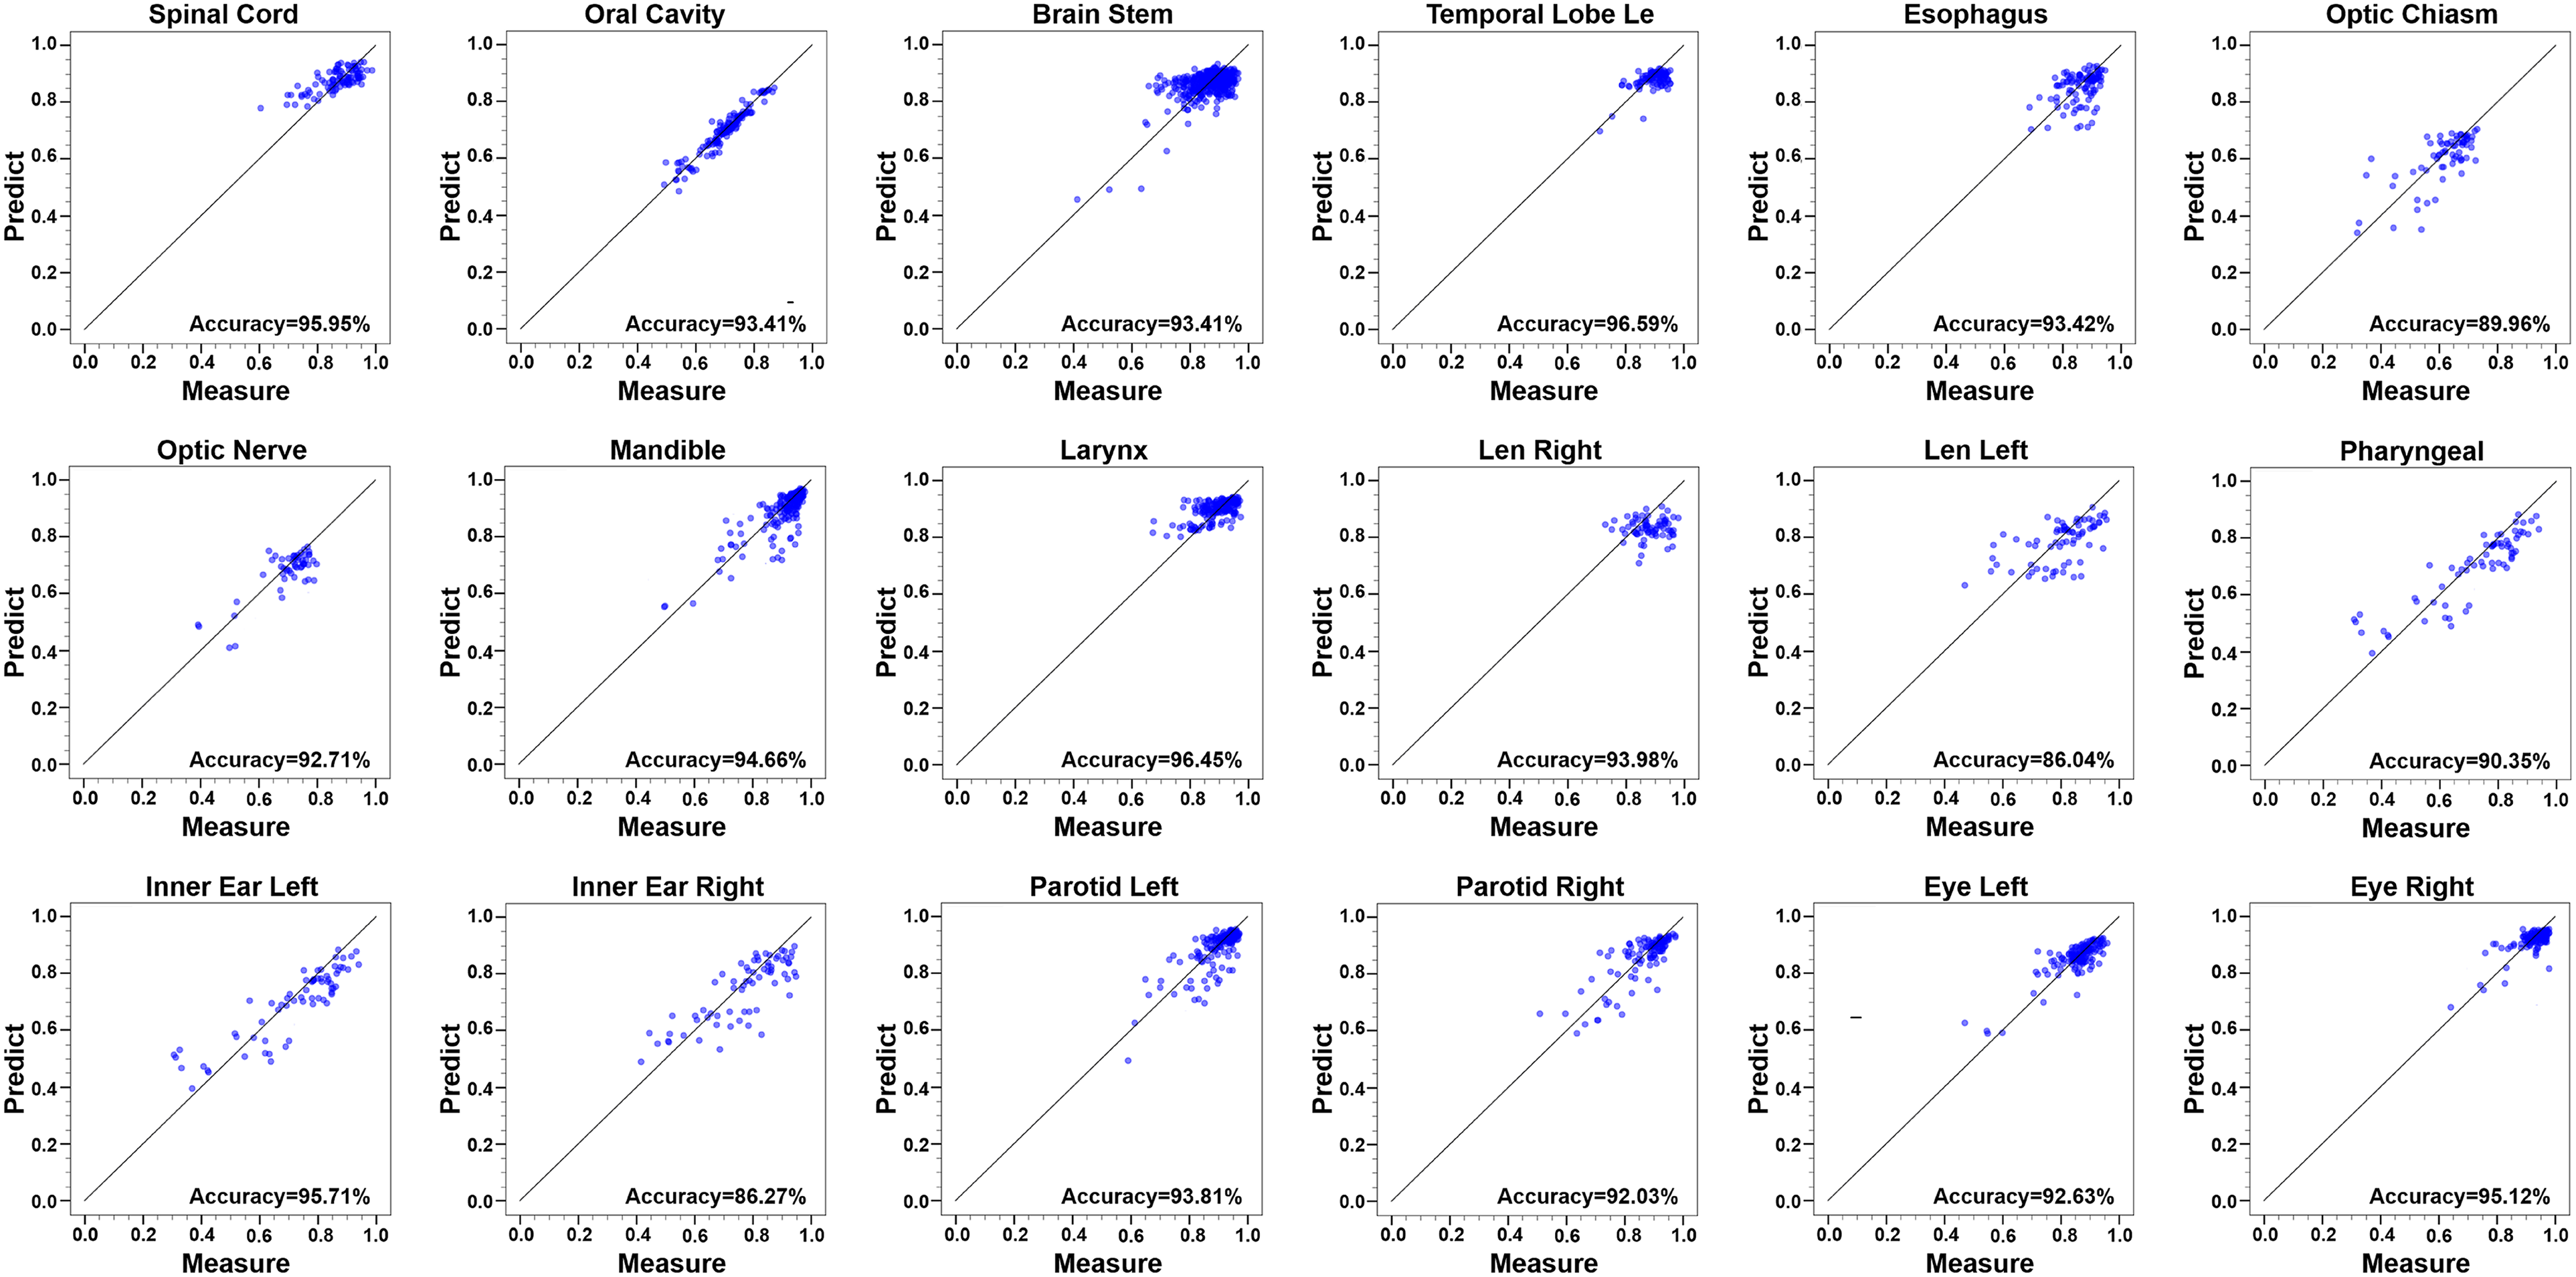
The best prediction accuracy for each H&N OAR.
As shown in Figure 5, for different OARs, the best performing ML model chose the same features as the most important features: Gray Average, Gray Variance, Gray Value Skewness, Local Binary Pattern, Gabor Filter, and Gray-Tone Difference Matrix. Most of these features are related to the predicted DSC accuracy rate. There is a strong correlation between the DSC value and inner/outer shells’ radiomics features. The figure shows that Gray Average and Gray Variance are relatively important features among the H&N OARs.
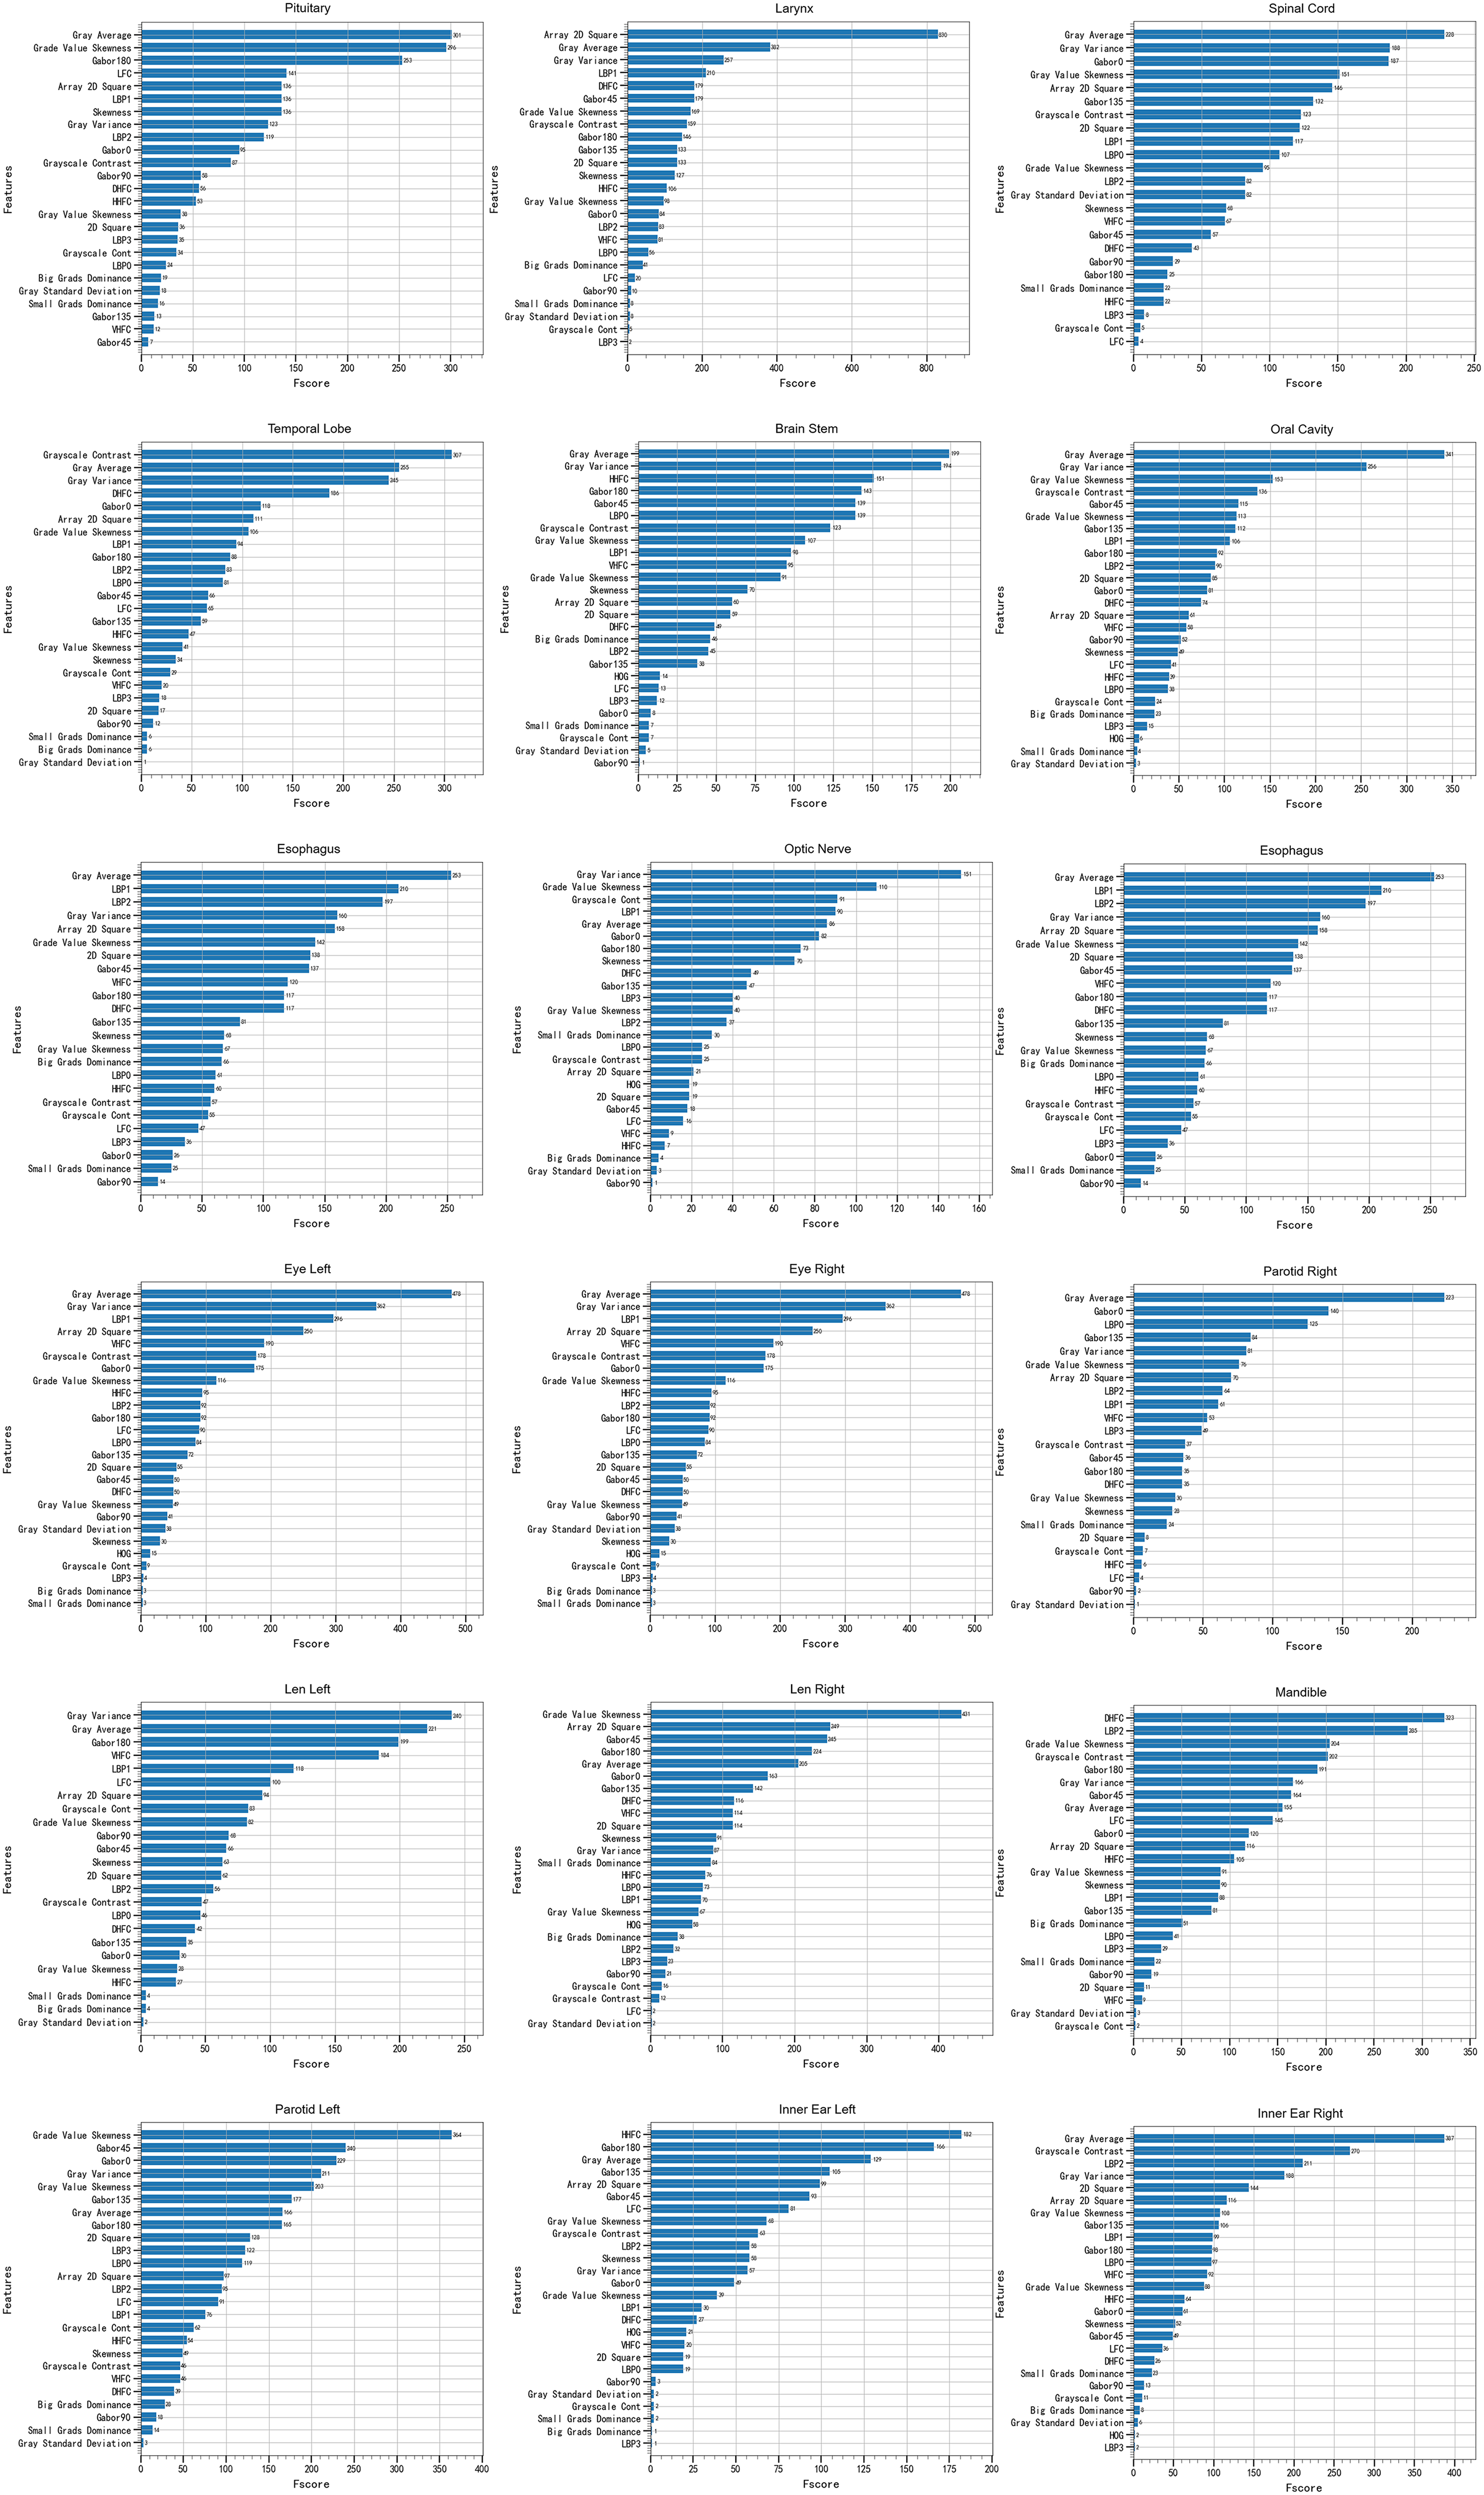
Feature importance evaluated by the best performing machine learning model for different H&N OARs.
According to formula 1, different H&N organs had different passing thresholds, as shown in Table 3. We assumed the slices were “correct” when they passed the criterion threshold. This means that the results of the AI segmentation were precise enough to use as clinical auxiliary diagnosis. Through this evaluation method, the high-quality contours can be easily selected without manual intervention.
The Passing Thresholds of DSCs for Different H&N OARs.

Some slices did not pass the criterion threshold shown in Table 3. By using the anisotropy evaluation standard, we obtained a series of thresholds for H&N OARs. The peak-to-peak ratio and area-to-area ratio calculated by formulas 2 and 3 are shown in Table 4. We often used the higher value as the denominator of the peak-to-peak and area-to-area ratios. So, the 2 ratios were always less than 1.0. In this approach, the smaller the ratio, the better was the segmentation.
The Thresholds of the Peak-to-Peak and Area-to-Area Ratios.

Taking the esophagus as an example, the red line means the grayscale inside the circle generated by the intersection points moved inward, opposite to the blue line. As we can see in Figure 6, the peak-to-peak ratio and area-to-area ratio of Figure 6b and c are relatively higher than the threshold, and Figure 6d and e demonstrates a lower ratio. This means the direction in the automatic contour (b) and (c) may have some issues, such as lack of or over contour in segmentation. In contrast, the direction of contours (d) and (e) may not have obvious problems in segmentation. Taking Figure 6a as an example, although the esophageal image of the CT slice passed the isotropic assessment and the DSC value was 0.74, it failed in the anisotropy assessment. By using the peak-to-peak ratio and the area-to-area ratio, it is easy to locate the position information of the inaccurate contours. The side contours in Figure 6a(a) and a(b) have a high degree of coincidence with the gold standard, which corresponds to Figure 6d and e. Figure 6a(c) and a(d) side contours are missing some important information, which corresponds to (b) and (e) in Figure 6.
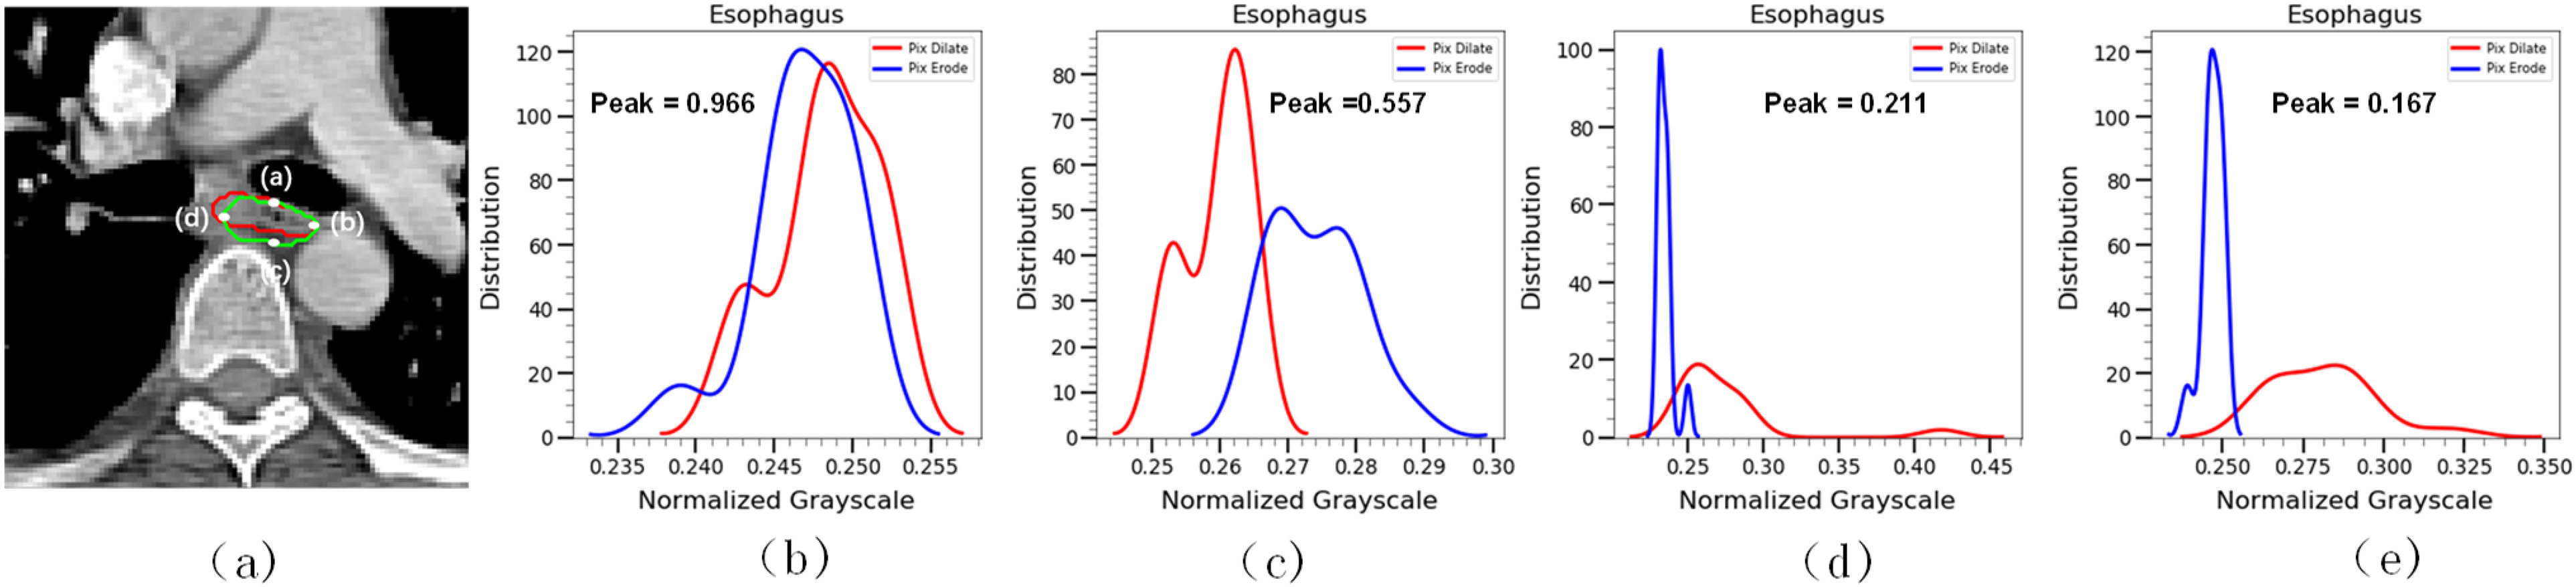
Anisotropy of the esophagus and the gray histogram of the esophagus by using the anisotropic method.
To further improve efficiency, we used the feature importance ranking method to adaptively delete some unimportant features. Many radiomics features are unimportant for QA and therefore are redundant features. To minimize this redundancy and achieve performance maximization of the QA system, we adaptively deleted 5 relatively unimportant features and used the same ML model to predict the OARs again. Figure 7a shows that the accuracy rate was basically unchanged. However, the time was greatly reduced, as shown in Figure 7b. The feature removal can save forecasting time without losing accuracy and thus improve oncologists’ efficiency.

The accuracy rate and time cost of the original model and reduced-feature model.
Discussion
It is important for clinical trials to use QA of H&N OARs contours to improve accuracy and reduce variability in dose evaluations. The current practice is not only subjective but also time-consuming because it relies on manual procedures, which depend on oncologists’ experience and knowledge. Therefore, we proposed a QA system based on ML and threshold evaluation to automatically predict segmentation quality without requiring the gold standard. Our QA method can not only distinguish high/low-quality contours but also provide location information of poor delineates. In this way, oncologists can further verify and revise these low-quality contours. The QA system can improve the automatic contouring process’ efficiency. This QA method can be applied to other OARs and tumors because of its universality.
We used U-Net, which is a well-known deep learning network, to generate a series of contours. Then, we obtained 38 features in the isotropic method and used DSC as labels to predict the DSC of new slices without the gold standard. Through experiments, we found that all DSC predict values of the H&N OARs could be used in clinical diagnosis directly because of low deviation. For some un-passed slices, an anisotropic method was proposed to assess them qualitatively. This method can be widely used in medicine.
The 3 main contributions of this study are as follows. First, our method can predict the performance of auto-segmentation quantitatively and help oncologists review and re-delineate the contours. Second, the anisotropic method as a supplement to the isotropic method can provide oncologists with a qualitative index to evaluate. Finally, the method can be easily integrated into current CNN segmentation models to help oncologists improve their efficiency.
There have been several reports about the QA of automatic delineations based on deep learning or ML methods. Men et al 26 trained a CNN model with the gold-standard atlas and then selected valuable samples from the candidate set to fine-tune the CNN model. Chen et al 25 developed a multi-task CNN model based on the ResNet-101 network, which included a segmentation task and a classification task. This method could predict the segmentation quality automatically. Zhang and co-workers 23 extracted texture features of 3 subregions (core, inner shell, and outer shell of OARs) and constructed a 3-level decision tree model based on texture constraints that were empirically determined for the 3 subregions. Huang et al 28 trained a deep CNN model with 2 large-scale datasets for segmentation quality evaluation without using the ground-truth. Robinson et al 30 proposed 2 real-time automatic quality control methods (one is training a deep network to predict DSC on a per-case basis, and the other is estimating quality obtained via a reverse testing strategy) for cardiovascular MR segmentation using deep learning, which can directly predict DSC value without the gold standard. Zhou et al 31 developed 2 convolutional neural networks (CNNs) (one aims reconstruct the original image by the provided segmentation, and the other predicts the segmentation quality by using the reconstruction difference image and the provided segmentation) to achieve segmentation quality assessment. Wang et al 32 analyze uncertainties in CNN-based 2D and 3D medical image segmentation tasks at pixel level and structure level. The authors also propose a test-time augmentation method based on arbitrary uncertainty to analyze the impact of transformed input images on segmentation results. It is hard to compare the pros and cons of algorithms because of the datasets are different. But compared to the previous results, our method can qualitatively and quantitatively assess the contour segmentation quality. We also adopted an integrated ML model to greatly improve the accuracy of prediction, and further proposed an anisotropic measure as a supplement to the isotropic method to quantitatively evaluate the segmentation position information.
There are some limitations of this study. First, although the QA model exhibited very high quality in our clinical experiments, other institutions’ datasets were not tested by our QA method. Therefore, it is not possible to assess the universality of the method. Second, the decision criteria thresholds were based on the segmentation quality of U-Net, so the passing contours may still need a physician's quick review. Third, we did not discuss the literature on predicting image segmentation uncertainty at a pixel/voxel level. The QA model's robustness and universality will be improved in future research. Before clinical implementation, we will collect other institutions’ datasets and use different deep learning networks as segmentation tools to further examine the feasibility of our results.
Conclusions
In this study, our QA model classified both accurate and inaccurate contours for H&N OARs quantitatively and qualitatively assessed inaccurate contours in different directions. The experimental results revealed that our method could accurately distinguish passing/un-passing slices and effectively improve oncologists’ quality and efficiency. This method can be feasibly integrated into a fully automatic pipeline for contour QA to provide objective evaluations and reduce subjective intervention.
Footnotes
Acknowledgments
Declaration of Conflicting Interests
The authors declared no potential conflicts of interest with respect to the research, authorship, and/or publication of this article.
Ethics Statement
This study has been approved by the Institutional Review Board (IRB) of the Hubei Cancer Hospital (approval no. LLHBCH2022YN-036). The consent of the patients has been waived by the ethics committee because this is a retrospective study.
Funding
The authors disclosed receipt of the following financial support for the research, authorship, and/or publication of this article: This study was supported by the Cancer Precision Radiotherapy Spark Program of China International Medical Foundation, grant number 2019-N-11-02, the Health Commission of Hubei Province scientific research project (No. WJ2021M192).