
Abstract
Introduction
Tumor-infiltrating lymphocytes (TILs) are key indicators of immune response and prognosis in breast cancer (BC). Accurate prediction of TIL levels is essential for guiding personalized treatment strategies. This study aimed to develop and evaluate machine learning models using ultrasound-derived radiomics and clinical features to predict TIL levels in BC.
Methods
This retrospective study included 256 BC patients between January 2019 and August 2023, who were randomly divided into training (n = 179) and test (n = 77) cohorts. Radiomics features were extracted from the intratumor and peritumor regions in ultrasound images. Feature selection was performed using the “Boruta” package in R to iteratively remove non-significant features. Extra Trees Classifier was used to construct radiomics and clinical models. A combined radiomics-clinical (R-C) model was also developed. Model performance was evaluated using the area under the receiver operating characteristic curve (AUC), accuracy, sensitivity, specificity, and decision curve analysis (DCA) to assess clinical utility. A nomogram was created based on the best-performing model.
Results
A total of 1712 radiomics features were extracted from the intratumor and peritumor regions. The Boruta method selected five key features (four from the peritumor and one from the intratumor) for model construction. Clinical features, including immunohistochemistry, tumor size, shape, and echo characteristics, showed significant differences between high (≥10%) and low (<10%) TIL groups. Both the R-C and radiomics models outperformed the clinical model in the test cohort (area under the curve values of 0.869/0.838 vs 0.627, P < .05). Calibration curves and Brier scores demonstrated superior accuracy and calibration for the R-C and radiomics models. DCA revealed the highest net benefit of the R-C model at intermediate threshold probabilities.
Conclusion
Ultrasound-derived radiomics effectively predicts TIL levels in BC, providing valuable insights for personalized treatment and surveillance strategies.
Introduction
Tumor-infiltrating lymphocytes (TILs) are biomarkers of lymphocyte-mediated immunity in all breast cancer (BC) immunotypes. 1 A higher proportion of TILs is linked to less aggressive tumors and a better prognosis. 2 TILs are an independent prognostic indicator in patients with BC, helping to understand the immune status of the tumor microenvironment, guide personalized immunotherapy and neoadjuvant chemotherapy (NAC), and monitor the treatment response.3–5 A multicenter study found that the proportion of TILs correlated with the response to NAC in all BC subtypes and was associated with longer survival in human epidermal growth factor receptor 2 (HER2)-positive and triple-negative breast cancer (TNBC). 2 A higher proportion of TILs is also linked to higher pathological complete response rates.3,5 The synergy between TILs, NAC, and immunotherapy highlights the importance of evaluating the proportion of TILs for personalized treatment.6–8 Currently, the main method used to assess TILs is puncture biopsy. 9 However, this method can lead to sampling bias and misdiagnosis. In addition, the TILs status may change with treatment progression. 10 Monitoring changes in TILs requires repeated biopsy, which can cause patient discomfort and hinder clinical application. Therefore, a non-invasive approach to evaluating TILs is necessary to alleviate patients’ suffering and to assess their condition more intuitively.
Mammography, Magnetic Resonance Imaging (MRI), and ultrasound each have unique advantages in BC evaluation. Mammography is mainly used to detect structural changes and microcalcifications. 11 However, it is limited in assessing the tumor microenvironment and immune-related biomarkers like TILs. MRI is more sensitive and detailed in evaluating the tumor microenvironment, including TILs. 12 However, it is costly and time-consuming. Ultrasound is widely used as the first-line imaging modality for BC due to its convenience and reproducibility. 13 While ultrasound is practical for routine clinical applications, its potential in evaluating TILs remains underexplored. Ultrasound features are primarily assessed through visual evaluation, which may introduce subjective variability. Previous studies suggest ultrasound features, such as micro-lobulated margins or posterior echo enhancement, may correlate with TIL levels,14,15 However, the results are inconsistent, likely due to differences in study methods and image interpretation. To address these issues, machine learning can thoroughly analyze various medical imaging modalities, such as MRI16,17 and mammography,18,19 and identify image features that are invisible to the naked eye. 20 Most studies have focused on using MRI combined with machine learning to predict the proportion of TILs. Moreover, research has demonstrated that MRI-based radiomics outperforms conventional MRI imaging in TIL evaluation.16,17 However, ultrasound-based radiomics has been less explored due to technical challenges and a lack of standardization. Expanding research in this area could bridge the gap between feasibility and precision. It could also highlight ultrasound's unique potential as a scalable tool for prognostic prediction in BC.
The purpose of this study was to develop an ultrasound-based machine learning model to non-invasively assess the proportion of TILs in patients with BC. We hypothesized that differences in the proportion of TILs in patients with BC would be associated with different ultrasound features and may be predicted by machine learning models.
Materials and Methods
Patients Characteristics
This single-center study was approved by our institution's Ethics Committee of Daping Hospital. The requirement for written informed consent was waived due to the retrospective nature of the study. This study was conducted in accordance with relevant Equator guidelines. 21 Between January 2019 and August 2023, patients with pathologically confirmed BC were enrolled. The inclusion criteria were (1) female patients; (2) a biopsy or BC specimen available TIL measurements; (3) ultrasound examination of the breasts before treatment; (4) presence of a visible mass on ultrasound images; and (5) available demographic and clinical data. The exclusion criteria were (1) low-quality ultrasound images; (2) presence of other malignancies, serious infections, blood diseases, and/or autoimmune diseases; (3) patients with incomplete clinical data; and (4) a biopsy or BC specimen was not available. Patients’ demographic and clinical characteristics were collected from the electronic medical record system of the hospital. The patient screening process and study framework are presented in Figure 1. All patient details were de-identified to ensure confidentiality.

The Workflow of this Study. A Study Flowchart. B Radiomics Workflow.
Ultrasound Procedure and Analysis
The ultrasound examinations were performed using Mindray DC-8 (Mindray, Shenzhen, Guangdong, China), GE S8 (GE Ultrasound Korea, Ltd, Gyeonggi-do, Korea), MyLab Twice (ESAOTE S.p.A., Genova, Italy), S60 Pro (SonoScape, Guangdong, China), or HI VISION Preirus (Hitachi, Tokyo, Japan) with linear probes. Detailed information on the ultrasound equipment is shown in Table S1. The image displaying the largest longitudinal diameter of the lesion was used for further analysis.
The ultrasound images were reviewed and analyzed by two radiologists, each with over five years of experience in BC diagnosis and who had undergone multiple standardized training sessions to ensure consistency. In patients with multiple breast masses on the same breast, the mass confirmed as malignant by pathology and clearly identifiable on ultrasound imaging was chosen as the target lesion for analysis. The target lesion was measured at its maximum diameter to determine its size. According to the ACR BI-RADS Atlas 5th 22 edition ultrasound lexicon, the ultrasound characteristics included location (outer/inner upper quadrant, outer/inner lower quadrant), size (long, wide), shape (regular, irregular), margin (well-defined, ill-defined, spiculated/angulated), internal echo (extremely low, hypoechoic, isoechoic), parallel growth (yes, no), homogeneity (yes, no), calcification (present, absent), posterior echo (no change, accentuate, attenuate), blood flow (Adler grade), and lateral sound shadowing (present, absent). Disagreements between the two radiologists were resolved by a third expert with more than ten years of experience in ultrasound for BC. Illustrative images of the ultrasound features of BC are shown in Figures 2 and 3.
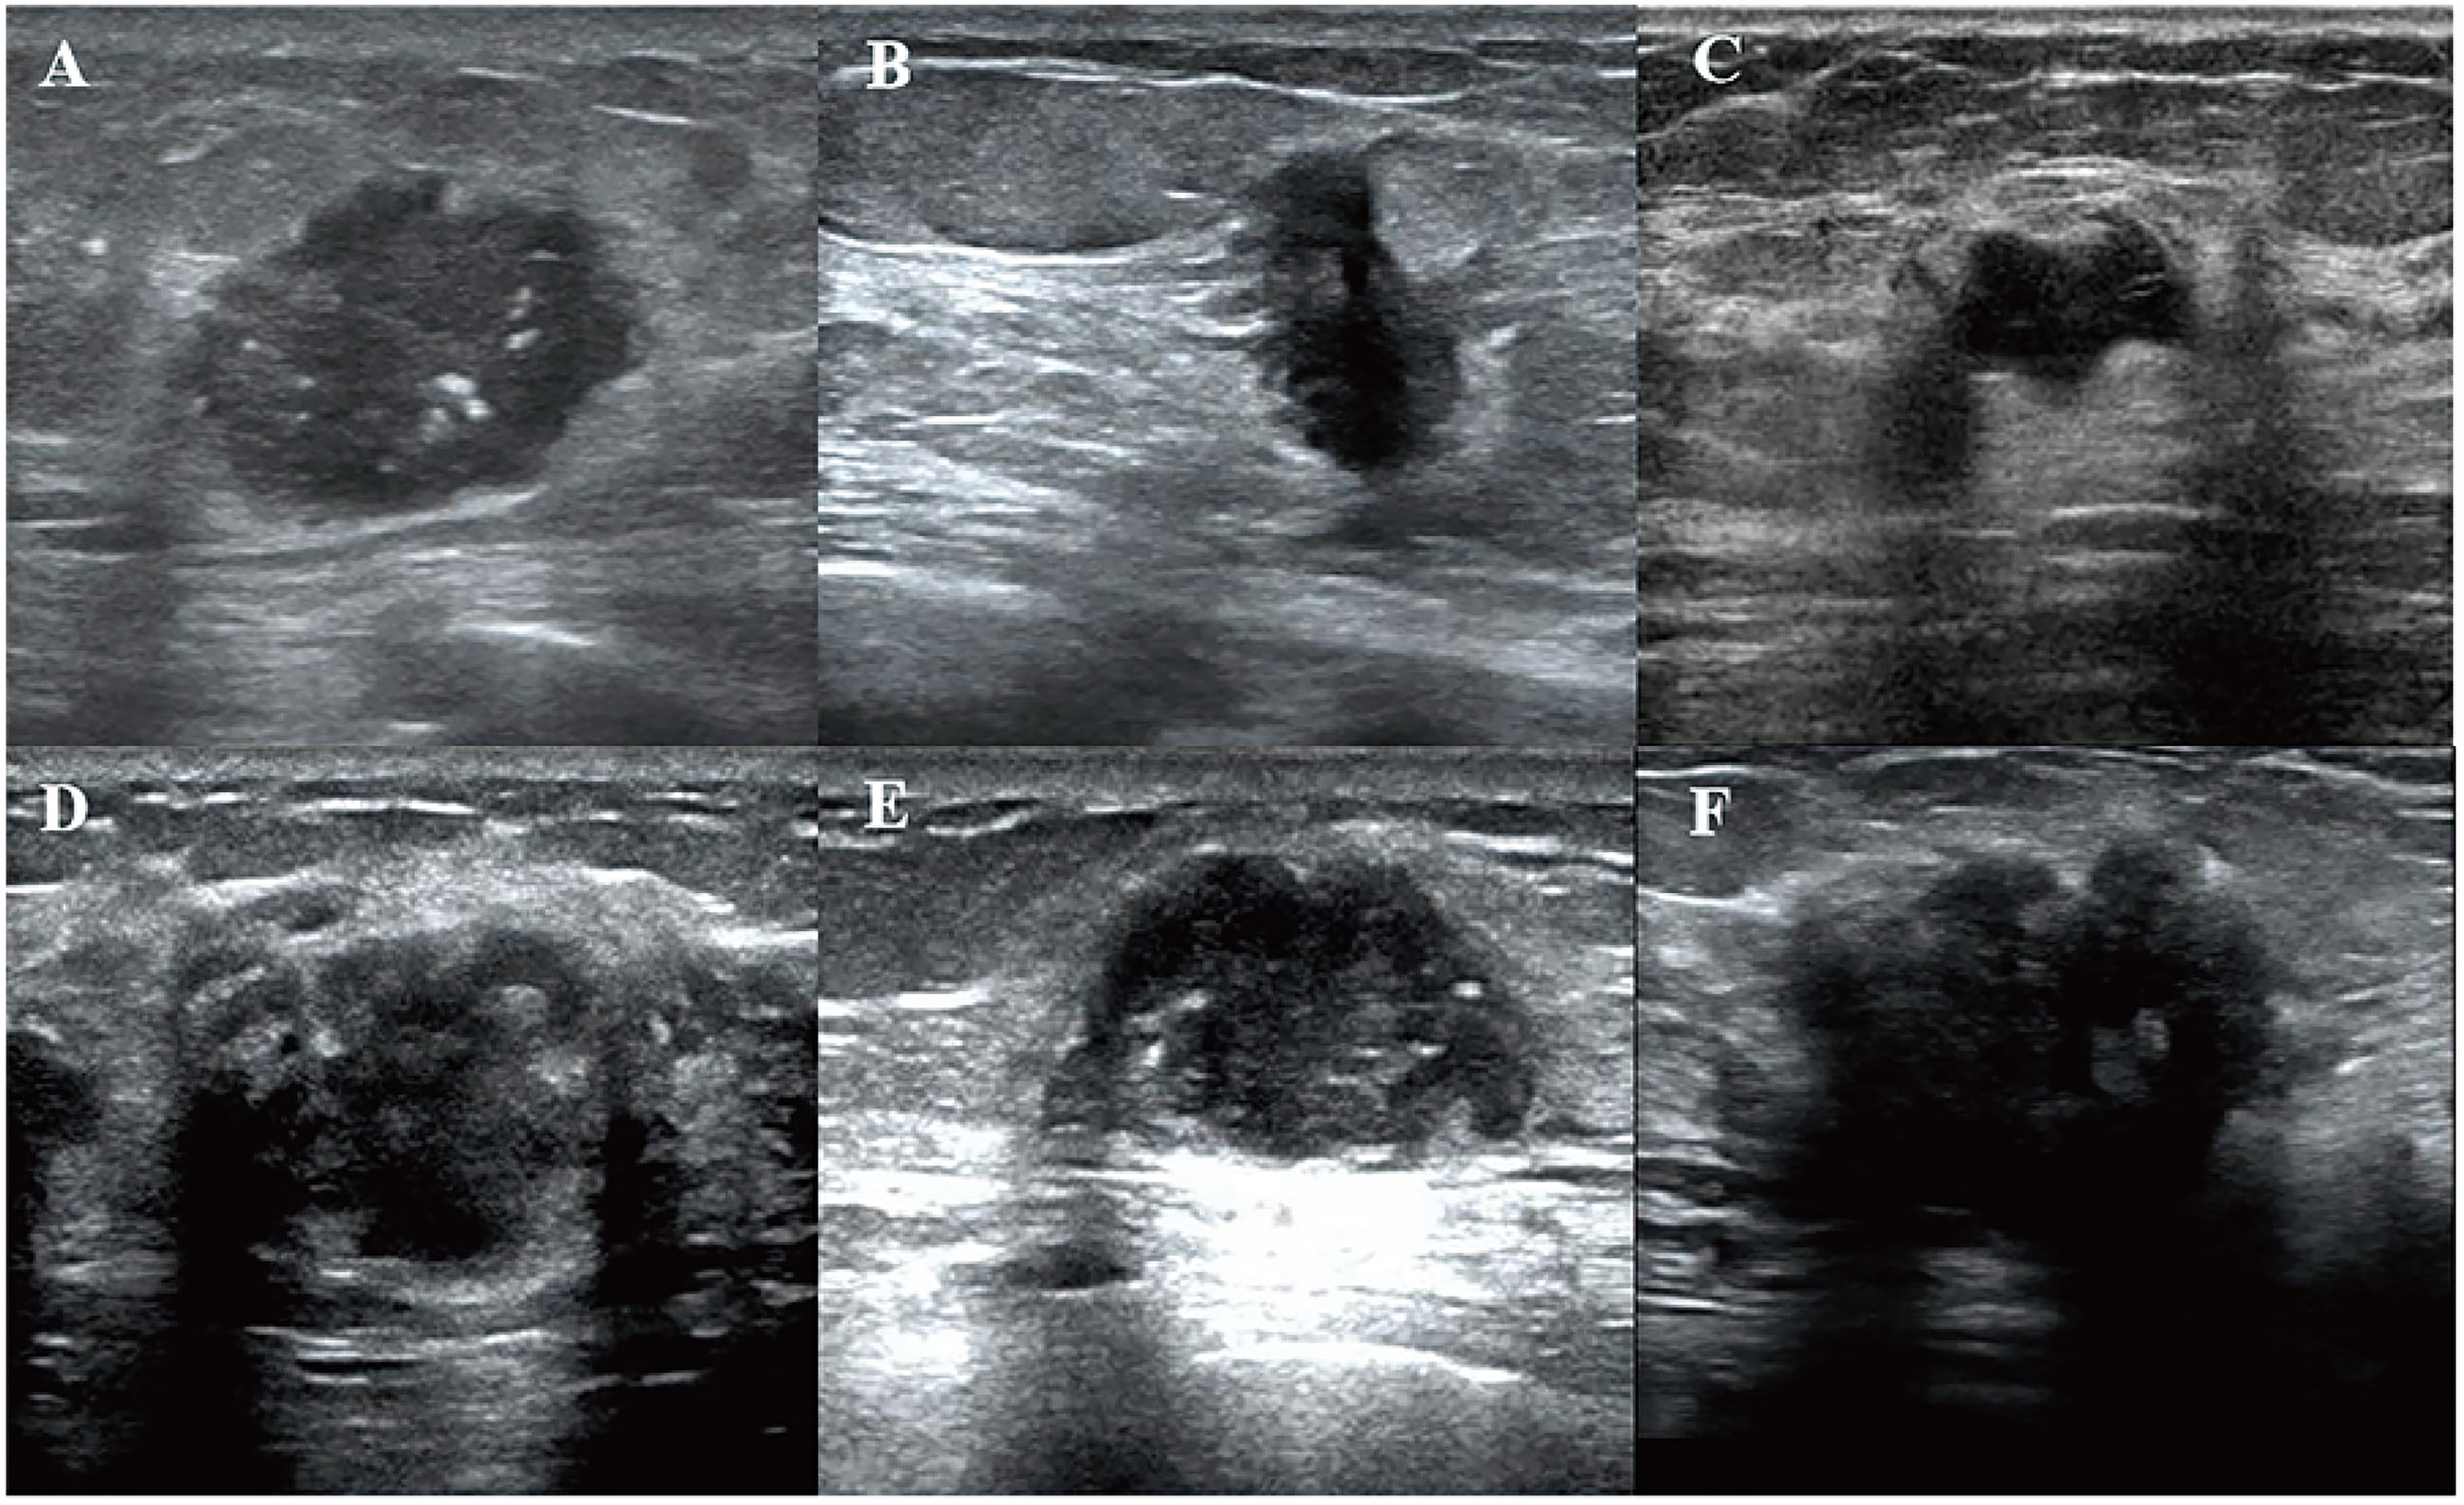
Illustrative Images of the Ultrasound Features of BC. A Depicts the Shape as Regular with Calcification. B Depicts the Margin as Ill-defined and Non-parallel Growth. C Depicts the Margin as well-defined, the Shape is Irregular, and the Internal Echo is Homogeneous. D Depicts Lateral Sound and Shadow, and the Internal Echo was Heterogeneous. E Depicts the Posterior Echo, Which was Accentuated. F Depicts the Posterior Echo as Attenuated.

Illustrative Images of the Ultrasound Features of BC. A Depicts that the Internal Echo is Extremely Low. B Depicts the Internal Echo as Hypoechoic. C Depicts the Internal Echo as Isoechoic. According to Adler's Blood Flow Grading Criteria, D Depicts the Blood Flow Signal as Level 1. E Depicts the Blood Flow Signal as Level 2. F Depicts the Blood Flow Signal as Level 3 and the no Blood Flow Signal as Level 0.
Tumor Segmentation and Radiomics Feature Extraction
For consistency, the 2D ultrasound image displaying the tumor's largest diameter in the longitudinal plane was selected. An experienced physician with over ten years of expertise in diagnostic breast ultrasound manually delineated the regions of interest (ROIs) using the open-source imaging platform ITK-SNAP (http://www.itksnap.org) to ensure accuracy. Two distinct ROIs were defined for each patient: the intratumor ROI, encompassing the entire tumor, and the peritumor ROI, covering a 5.0-mm area surrounding the tumor. The intratumor and peritumor ROIs were annotated in red and green, respectively. Rigorous image normalization and grayscale standardization procedures were applied to maintain consistency and comparability across images obtained from various ultrasound devices. 23
To evaluate inter-observer reproducibility, another radiologist repeated the segmentation process two weeks after the initial ROI segmentation. Radiomics features were obtained using the PyRadiomics package of R (version 4.4.0) and subsequently categorized into distinct classes, including (1) first-order features; (2) shape-based features; and (3) high-order features, including Gray Level Co-occurrence Matrix(GLCM), Gray Level Dependence Matrix(GLDM), Gray Level Run Length Matrix(GLRLM), Gray Level Size Zone Matrix(GLSZM), and Neighboring Gray Tone Difference Matrix(NGTDM). The inter-observer agreement of feature extraction was assessed using the intraclass correlation coefficient (ICC). Radiomics features with ICCs > 0.75 were retained. 24
Feature Selection and Machine Learning Model Development
The “Bruta” package of R software 25 was used to perform feature selection. Bruta effectively selects both linear and non-linear features. It creates duplicate, shuffled copies of all variables, runs Random Forest (RF) Classifier, and measures variable importance using the mean decrease accuracy. Variables are tagged as important or unimportant based on their Z scores compared with the maximum Z score among the shuffled attributes. This process is repeated until all variables are assigned an importance or a set limit of RF runs is reached.
Eight diverse machine learning classifiers, including Extra Trees, RF, Linear Discriminant Analysis (LDA), Naive Bayes (NB), Ridge, Gradient Boosting (GB), Quadratic Discriminant Analysis (QDA), and Light Gradient Boosting Machine (LightGBM), were used to build the predictive models. A ten-fold cross-validation approach was used to derive the final radiomics features and identify the optimal classifier. During cross-validation, the dataset was randomly divided into ten equal subsets. Each subset was used once as the validation data, while the remaining nine subsets were used as training data. This process was repeated ten times to ensure that each subset served as the validation set exactly once. The performance of each model was evaluated in each iteration, and the average performance across all ten iterations was calculated. Hyperparameter tuning was performed using GridSearchCV. The optimal hyperparameters were identified through this grid search process, and the model with the best overall performance was selected for further analysis. Based on this classifier, three distinct models were developed: a clinical model incorporating clinical characteristics and ultrasound features, a radiomics model based solely on radiomics features, and a combined radiomics-clinical (R-C) model that integrates clinical characteristics, ultrasound features, and radiomics features.
Pathological Analysis
Pathological results, including estrogen receptor (ER), HER2, progesterone receptor (PR), Ki67 expression, hormone receptor (HR) status, and the level of were obtained from the electronic pathology system of our hospital. HER2 positivity was defined as HER2 immunohistochemistry (IHC) 3+ or HER2 IHC 2+ with further confirmation of HER2 gene amplification by fluorescence in situ hybridization. 26 According to the St. Gallen International Expert Panel consensus (2011 edition), the molecular subtypes of BC were classified as luminal A type (ER-positive and PR-positive, HER2-negative, Ki67 positivity <14%), luminal B type (ER-positive, PR-negative, HER2-negative, any Ki67 positivity), HER2-positive and HR-positive (ER-positive or PR-positive and HER2-positive), HER2-positive and HR-negative (ER-negative and PR-negative and HER2-positive), or triple-negative (ER-, PR-, and HER2-negative). 26 According to the International TILs Working Group 2014 recommendations, stromal TILs were assessed based on pathological hematoxylin and eosin staining. 10 Specimens from needle biopsies or resected breast cancer samples were evaluated for TILs by estimating the percentage of the stromal area infiltrated by lymphocytes, excluding necrotic areas and non-invasive regions. Among the evaluated samples, 61.3% of TIL assessments were performed on needle biopsy specimens, while 38.7% were from resected specimens. Based on previous studies,8,10 the patients were divided into two groups: the low TIL group (proportion of TILs < 10%) and the high TIL group (proportion of TILs ≥ 10%).
Statistical Analysis
Normally and non-normally distributed continuous variables are presented as the mean ± standard deviation or median (25th percentile, 75th percentile) and were compared using the independent-samples two-sided t-test or Mann–Whitney U test, respectively. Categorical variables are presented as numbers (%) and were compared using the chi-square test. The receiver operating characteristic (ROC) curve analysis was used to evaluate the predictive ability of the models. The DeLong test was used to compare the area under curve (AUC) values of the different models. The decision curve analysis (DCA) was used to evaluate the clinical validity of the models. P < .05 was considered statistically significant. All analyses were performed using Python (version 3.11.8) and R software (version 4.4.0).
Results
Patient Characteristics
Overall, 256 female patients with BC were enrolled;113 were assigned to the high TIL group and 143 were assigned to the low TIL group. The clinical characteristics showed no significant differences between the training and test cohorts (all P > .05; Table S2).
There were no significant differences between the high TIL and low TIL groups in terms of age, height, weight, body mass index, menstruation, menarche time, last menstrual period, menstrual duration, number of miscarriages, reproductive history, family history, smoking, drinking, histology boundary, internal echo, lateral sound and shadow, calcification, and blood flow (all P > .05). In both the training and test cohorts, significant differences were observed in parallel growth and posterior echo (both P < .05). Non-parallel growth was more common in the low TIL group. Posterior echo was more likely to be accentuated in the high TIL group, whereas it remained unchanged in the low TIL group. Additionally, significant differences in immunohistochemistry (P = .016), size (longitudinal and width) (P = .017 and P = .021, respectively), and shape (P = .027) were noted between the high TIL group and the low TIL group in the training cohort. Specifically, the HER2-positive (HR-negative) and triple-negative subtypes were more prevalent in the high TIL group. Tumors with a high proportion of TILs tended to exhibit a shorter longitudinal size and a narrower width and were typically regular in shape (Table 1).
The Comparison of Ultrasound Features.

Bold type indicates P < .05, which signifies statistical significance.
Model Establishment
A total of 1712 radiomics features were extracted from the peritumor and intratumor ROIs, of which four peritumor features and one intratumor feature were retained to build the radiomics model. The feature selection process is shown in Figure 4A.

Feature Selection and Radiomic Model Establishment. Radiomics Features Were Selected by the Bruta Package. B A box Plot Illustrated the Rad-score. C, the Feature Importance Plot was Generated Using the Extra Trees Model.
Supervised learning was performed using various machine learning classifiers, including Extra Trees, RF, LDA, NB, Ridge, GB, QDA, and LightGBM. Among the eight machine learning classifiers, the Extra Trees model demonstrated the best performance for predicting the proportion of TILs in BC, with an AUC of 0.780 in the training cohort and 0.837 in the test cohort, and corresponding accuracies of 71.5% and 75.3%, respectively (Table 2). In the test cohort, the model had a recall of 0.744 and a precision of 0.800, reflecting its good overall predictive ability and relatively low false-positive rate. The F1 score of 0.771 illustrated a balanced trade-off between precision and recall. Additionally, the Kappa coefficient of 0.504 and the Matthews correlation coefficient (MCC) of 0.506 indicated that the model could effectively distinguish between the high and low TIL groups. Therefore, Extra Trees was used to construct the models. The radiomics score obtained from the Extra Trees model for each patient was referred to as the Rad-score. The boxplot illustrates the Rad-score distribution of the patients in the test cohort, indicating that the radiomics model could effectively distinguish between the high and low TIL groups. A score approaching zero was considered to correspond to a high proportion of TILs (≥10%), while a score approaching one was considered to correspond to a low proportion of TILs (<10%). Additionally, the feature importance plot was generated using the Extra Trees model (Figure 4B, C).
The Performance of Different Machine Learning Classifiers.
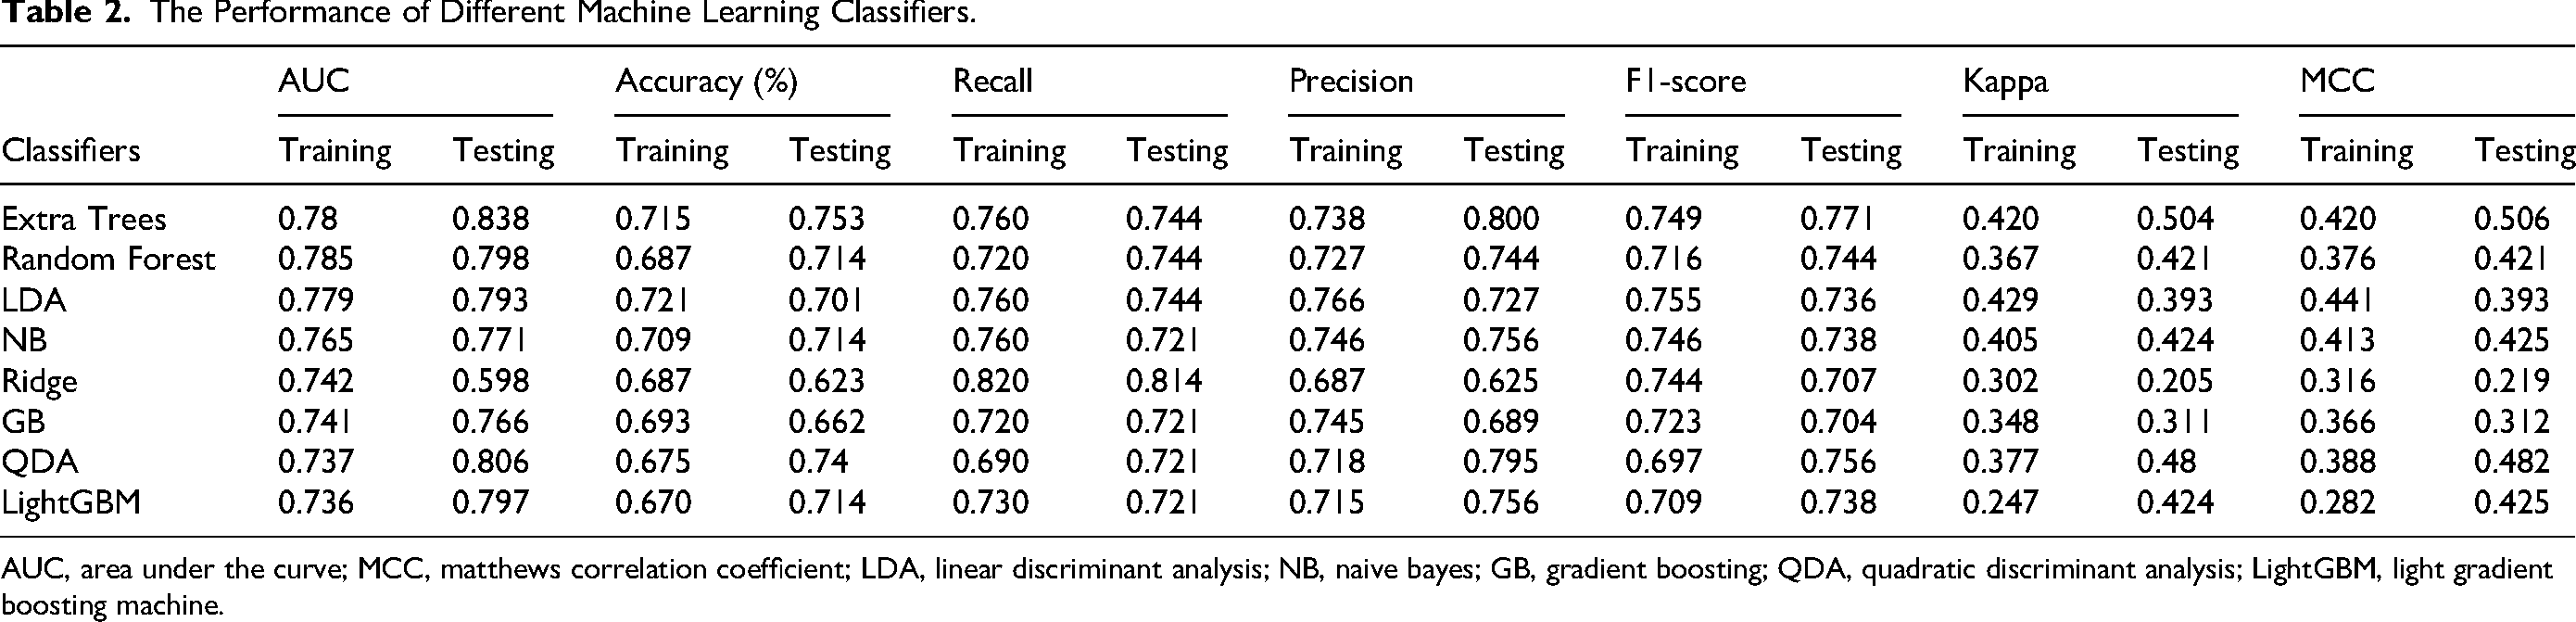
AUC, area under the curve; MCC, matthews correlation coefficient; LDA, linear discriminant analysis; NB, naive bayes; GB, gradient boosting; QDA, quadratic discriminant analysis; LightGBM, light gradient boosting machine.
The same Extra Trees algorithm was used to build the clinical model. Furthermore, an R-C model was constructed to further enhance the model's predictive performance. The top ten most important features that were used to construct the R-C model are shown in Figure 5A.

A the top ten Important Features of the R-C model. B Nomogram Based on Ultrasound Rad-score and Clinical Features. Menstrual Duration: Menarche to Menopause for Postmenopausal Women, or From Menarche to the Current age for Premenopausal Women(unit in year); Length, Width(unit in cm); Parallel Growth (0: Yes, 1: No); Posterior Echo (0: Accentuate, 1: No change, 2: Attenuate); Immunohistochemistry (0: Luminal A, 1: Luminal B, 2: HER2 positive HR+, 3: HER2 Positive HR-, 4: TNBC); Probability (High TILs Group: 0, low TILs Group: 1).
Model Performance
The performance of the three models (clinical, radiomics, and R-C model) is shown in Table 3 and Figure 6. The R-C model effectively distinguished between the high and low TIL groups, with an AUC of 0.837 in the training cohort and 0.869 in the test cohort. Additionally, this model demonstrated high sensitivity (0.884), specificity (0.765), accuracy (0.831), precision (0.826), and F1 score (0.854). The R-C model demonstrated a Kappa coefficient of 0.655 and an MCC of 0.657 (Table 3, Figure 6A). Comparatively, the radiomics model achieved a training AUC of 0.780 and a test AUC of 0.838, showing good sensitivity (0.744) and specificity (0.765). It attained an accuracy of 0.753, precision of 0.800, F1 score of 0.771, and Kappa coefficient of 0.504 (Table 3, Figure 6B). The clinical model exhibited inferior performance with a training AUC of 0.651 and a test AUC of 0.627, alongside lower specificity (0.471), accuracy of 0.623, precision of 0.640, F1 score of 0.688, Kappa coefficient of 0.220, and MCC of 0.224 in the test cohort (Table 3, Figure 6C). In the test cohort, both the R-C model and the radiomics model significantly outperformed the clinical model (AUC 0.869/0.838 vs 0.627, P = .018 and P < .001, respectively). However, there was no significant difference between the radiomics model and the R-C model (P = .456). Calibration curves and the Brier score were used to evaluate the calibration and accuracy of the three models. The Brier score measures the accuracy of probabilistic predictions, with a lower score indicating better calibration and accuracy. The Brier score of the radiomics model was 0.166, of the clinical model was 0.232, and of the R-C model was 0.165. These results suggest that both the radiomics and R-C models were better calibrated and more accurate for distinguishing between the high and low TIL groups than the clinical model (Figure 6D). The DCA showed that the R-C model had the highest net benefit at intermediate threshold probabilities, indicating better clinical decision-making utility (Figure 6E). A nomogram was developed to predict the proportion of TILs in BC by integrating the Rad-score from the Radiomics model and the top ten most important features selected from the R-C model. (Figure 5B).

Diagnostic Assessment and Test of Three Models for Distinguishing High and low TIL Levels. ROC Analysis (A, B, C), Calibration Curves (D), and Decision Curve Analysis (E) of Three Models for Identifying the TIL Level Components in Training and Test Cohorts.
The Prediction Performance of the Three Models.

R-C, radiomics-clinical; AUC, area under the curve; MCC, matthews correlation coefficient.
Discussion
TILs are an important indicator for determining the efficacy of NAC and estimating BC prognosis.27,28 Due to the dynamic changes in TILs in tumors and limitations in the current evaluation of TILs, a non-invasive technique is urgently required. Several studies have demonstrated the effectiveness of ultrasound features for predicting TILs in BC.14,15,29 However, these studies did not reach consistent conclusions. In this paper, we introduced and validated an innovative fusion model that integrates peritumor and intratumor radiomics features with clinical features to predict the proportion of TILs, distinguishing between high and low TIL groups.
The proportion of TILs differs among the different molecular subtypes of BC. A high proportion of TILs is commonly found in TNBC and HER2-positive/HR-negative subtypes, while HER2-positive/HR-positive BC has a relatively low proportion of TILs. 30 The results of the present study are consistent with the previous study, which showed that 44.3% of patients in the high TIL group had HER2-positive/HR-negative BC.
Previous research has shown that BC with a high proportion of TILs typically presents as lesions with a diameter of ≥2 cm,14,31 a regular shape,15,29 clear boundaries, 15 small lobules, 14 extremely low internal echo, 14 and significantly enhanced posterior echo.14,15,29 Our study also found that the BC tumors in the high TIL group had an average long-axis diameter of 2.3 cm. In the present study, 68.4% of the patients in the high TIL group exhibited lesions with a regular shape, which is consistent with the findings of Jia et al. 15 but different from the findings of Fukui et al 14 This discrepancy may be due to different definitions of high and low TIL proportions. In this study, we defined a low proportion of TILs as <10% and a high proportion of TILs as ≥10%, whereas Fukui et al 14 considered the low TIL threshold as being <50% and the high TIL threshold as being ≥50%. In the high TIL group, 44.3% of the lesions showed accentuated posterior echo (as opposed to attenuated posterior echo and no change). This is consistent with the findings of several other studies14,15,29 that also reported increased posterior echo enhancement in the high TIL group. According to Fukui et al, 14 an increased proportion of TILs reflects an increase in hydrophilic components and a decrease in collagen fibers in the tumor stroma, which manifest on ultrasound as extremely low internal echo and enhanced posterior echo. However, our study did not observe a statistically significant difference between internal echo and the proportion of TILs, aligning with Jia et al's 15 research. This discrepancy may be due to the fact that our study was based on all molecular subtypes of BC. Additionally, differences in ultrasound equipment, parameter adjustments, and classification thresholds could potentially have contributed to the varying results. Additionally, 96.2% of the patients in the high TIL group exhibited parallel growth, possibly because a high proportion of TILs indicates a strong host immune response, thereby limiting tumor growth and spread. Considering the overall findings, we believe that tumors with a low proportion of TILs exhibit more aggressive behavior, characterized by irregular shapes and expansive growth patterns. Additionally, there may be subtle peritumor information that is difficult to discern visually.
Our findings highlight the importance of integrating radiomics with imaging techniques to detect these subtle features. Previous research has investigated the relationship between radiomics and TILs in patients with BC using MRI or mammography imaging, consistently demonstrating superior performance compared with imaging without radiomics.16,17 In the present study, the radiomics model achieved an AUC of 0.838 in the test cohort, which is higher than that reported by Jia et al 15 (AUC 0.79) but slightly lower than that reported by Fukui et al 14 (AUC 0.88). Different methods for classifying the proportion of TILs and variations in sample size may have contributed to the discrepancies between our results and those of previous studies.16,17,32 Our model also outperformed the radiomics models of Hu et al, 33 who used Least Absolute Shrinkage and Selection Operator (LASSO) to extract 25 ultrasound features for TNBC, achieving an AUC of 0.811, and Zhang et al, 34 who used LASSO to extract two ultrasound features for all types of BC, achieving an AUC of 0.759. The superior performance of our model may be attributed to more reasonable ROI segmentation. This study is the first to separately extract peritumor and intratumor radiomics features from gray-scale ultrasound images to predict the proportion of TILs. Previous studies have indicated a strong relationship between lymphocyte density and radiological features outside of the tumor. This correlation is likely associated with tumor invasiveness, where inflammation around the tumor may lead to increased lymphocyte proliferation and vascular enrichment, which could be reflected on macroscopic imaging. 35 Therefore, peritumor features may be more indicative of histological characteristics related to lymphocyte infiltration in BC. 12 This may help to explain why, in the present study, four radiomics features derived from peritumor regions were retained for model development, while only one intratumor feature was included.
Based on these findings, we established a combined model integrating radiomics and clinical features, which achieved an AUC of 0.869. The feature importance distribution of this optimal model indicated that peritumor radiomics plays a significant role in predicting the proportion of TILs. The performance of the R-C model and radiomics model was higher than in the study by Yu et al, 19 who extracted radiomics features from mammography (AUC 0.79); slightly lower than the study by Bian et al, 16 who used MRI for feature extraction (AUC 0.88); and lower than the study by Tang et al, 17 who used a combined model based on dynamic contrast-enhanced MRI imaging features (AUC 0.95). The primary reason for these differences is likely related to the superior soft tissue resolution of MRI, whereas Mammography is constrained by overlapping imaging and reduced sensitivity to dense breast tissue, particularly in Asian women.
This study has several limitations. First, as a single-center retrospective study with a relatively small sample size, further validation in a larger, multi-center prospective cohort is needed to improve generalizability. Second, while radiomics demonstrated good predictive performance, its clinical application remains limited. Future research will focus on automating ultrasound image segmentation and analysis through a streamlined operating system, aiming to integrate machine learning-based predictions into radiologists’ workflows and enhance clinical applicability.
Conclusion
The proportion of TILs serves as a key surrogate marker for predicting BC prognosis; however, non-invasive preoperative assessment of TILs remains challenging. Radiomics allows standardized feature extraction from ultrasound images. The combined model that integrates radiomics and clinical features demonstrated good performance in predicting the proportion of TILs, which may provide valuable insights for clinicians to develop personalized treatment and surveillance strategies.
Supplemental Material
sj-docx-1-tct-10.1177_15330338251334453 - Supplemental material for An Ultrasound-based Machine Learning Model for Predicting Tumor-Infiltrating Lymphocytes in Breast Cancer
Supplemental material, sj-docx-1-tct-10.1177_15330338251334453 for An Ultrasound-based Machine Learning Model for Predicting Tumor-Infiltrating Lymphocytes in Boya Liu, MM, Xiangrong Gu, MM, Danling Xie, MM, Bing Zhao, BM, Dong Han, MD, Yuli Zhang, BM, Tao Li, PhD, and Jingqin Fang, MD, PhD in Cancer Research & Treatment
Footnotes
Acknowledgments
We would like to express our sincere gratitude to Xiaoxia,Chen for her invaluable assistance in data collection, which was essential for the completion of this study. We also thank ZiXin,Yan for her significant contributions to the writing and refinement of this manuscript. Their support greatly enhanced the quality of this work.
Ethical Considerations
The authors are accountable for all aspects of the work in ensuring that questions related to the accuracy or integrity of any part of the work are appropriately investigated and resolved. The study was conducted in accordance with the Declaration of Helsinki (as revised in 2013). The study was approved by institutional ethics committee of Daping Hospital and individual consent for this retrospective analysis was waived.
Author Contributions/CRediT
(I) Conception and design: Jingqin Fang, Boya Liu, Xiangrong Gu. (II) Administrative support: Boya Liu, Danling Xie, Bing Zhao. (III) Provision of study materials or patients: Jingqin Fang, Boya Liu, Tao Li. (IV) Collection and assembly of data: Xiangrong Gu, Danling Xie, Bing Zhao, Dong Han. (V) Data analysis and interpretation: Jingqin Fang, Boya Liu, Xiangrong Gu. (VI) Manuscript writing: All authors. (VII) Final approval of manuscript: All authors
Funding
The author(s) disclosed receipt of the following financial support for the research, authorship, and/or publication of this article: This work was supported by the Innovation Ability Enhancement Project of Daping Hospital (ZXZYTSLC07), and Natural Science Foundation of Chongqing, China (cstc2021jcyj-msxmX0230).
Conflicting Interests
The author(s) declared no potential conflicts of interest with respect to the research, authorship, and/or publication of this article.
Supplemental Material
Supplemental material for this article is available online.
References
Supplementary Material
Please find the following supplemental material available below.
For Open Access articles published under a Creative Commons License, all supplemental material carries the same license as the article it is associated with.
For non-Open Access articles published, all supplemental material carries a non-exclusive license, and permission requests for re-use of supplemental material or any part of supplemental material shall be sent directly to the copyright owner as specified in the copyright notice associated with the article.