
Abstract
The aim was to evaluate a deep learning-based auto-segmentation method for liver delineation in Y-90 selective internal radiation therapy (SIRT). A deep learning (DL)-based liver segmentation model using the U-Net3D architecture was built. Auto-segmentation of the liver was tested in CT images of SIRT patients. DL auto-segmented liver contours were evaluated against physician manually-delineated contours. Dice similarity coefficient (DSC) and mean distance to agreement (MDA) were calculated. The DL-model-generated contours were compared with the contours generated using an Atlas-based method. Ratio of volume (RV, the ratio of DL-model auto-segmented liver volume to manually-delineated liver volume), and ratio of activity (RA, the ratio of Y-90 activity calculated using a DL-model auto-segmented liver volume to Y-90 activity calculated using a manually-delineated liver volume), were assessed. Compared with the contours generated with the Atlas method, the contours generated with the DL model had better agreement with the manually-delineated contours, which had larger DSCs (average: 0.94 ± 0.01 vs 0.83 ± 0.10) and smaller MDAs (average: 1.8 ± 0.4 mm vs 7.1 ± 5.1 mm). The average RV and average RA calculated using the DL-model-generated volumes are 0.99 ± 0.03 and 1.00 ± 0.00, respectively. The DL segmentation model was able to identify and segment livers in the CT images and provide reliable results. It outperformed the Atlas method. The model can be applied for SIRT procedures.
Introduction
Radioembolization using Yttrium-90 (Y-90) microspheres, a selective internal radiation therapy (SIRT), is a promising procedure to treat non-resectable primary and metastatic liver cancers. 1 Resin-based Y-90 procedures are used to treat metastatic liver cancers. In these procedures, the body-surface-area method is commonly used as the dosimetry method for activity calculation. 2 Liver volume size and tumor volume size are needed in the activity calculation, which are obtained from contours delineated by physicians in CT or MR images. It is desired that an auto-segmentation method can be applied for liver delineation in SIRT procedures to improve the efficiency of the activity calculation process.
In recent years, auto-segmentation methods for organ delineations have been studied extensively.3–16 For liver delineation, several methods have been investigated.10–16 However, there are very few studies on liver auto-segmentation for SIRT applications, which were based on Atlas-based auto-segmentation methods.15,16 Studies on Artificial Intelligence (AI) for biomedical image segmentation have shown that AI-based segmentations are advanced auto-segmentation methods for organ delineations.17–20 The study here was aimed to build a deep learning (DL)-based auto-segmentation model and explore the feasibility of applying the model for liver delineation in resin Y-90 SIRT.
Material and Method
Deep Learning Segmentation Model and Data
Liver segmentation has evolved significantly over the years, transitioning from traditional methods such as thresholding and region growing, which relied on handcrafted rules and were challenged by variations in image contrast and anatomical structures, to more advanced machine learning and Atlas-based techniques. While these methods improved segmentation accuracy, they required extensive feature engineering and struggled with inter-patient variability. 21 The advent of deep learning revolutionized segmentation, particularly with the introduction of convolutional neural network (CNN)-based architectures. U-Net became the de facto standard due to its encoder-decoder structure and skip connections, enabling effective feature extraction across different spatial scales. Variants like V-Net extended these capabilities to 3D medical imaging, further enhancing volumetric segmentation. Recent advancements, including Attention U-Net and Residual U-Net, have incorporated attention mechanisms and residual connections to refine feature representation and improve segmentation precision. 22
We employed a Unet3D architecture 18 for liver segmentation, leveraging its encoder-decoder structure with skip connections to reserve spatial details while capturing high-level contextual information. The network consists of four down sampling and up sampling levels. Each level incorporates convolutional layers and leaky ReLU activation. The encoding path extracts rich feature representations from the input image using strided convolutions for down sampling, and the decoding path generates the segmented output using transposed convolution for up sampling. The segmentation model generates the final segmentation using a softmax activation function to allow multi-class segmentation of liver region. To mitigate overfitting, a dropout rate of 0.1 was applied to deeper layers.
Machine learning library PyTorch and DL framework MONAI were used to build the liver segmentation model. The segmentation model was trained on the Liver Tumor Segmentation (LiTS) dataset, 23 which is a large and diverse dataset of contrast-enhanced abdominal CT scans containing a variety of liver shapes and sizes. The training set of LiTS contains 131 CT scans, and the test set contains 70 CT scans. This dataset comprises 3D CT scans with corresponding ground-truth contours. Preprocessing steps include resampling images to isovoxel spacing of 1.0 × 1.0 × 1.0 mm, clipping CT intensities to the range of [–200,250] Hounsfield units (HU), and normalizing intensity values to [0,1]. In order to minimize computational overhead and focus on the liver region, bounding box cropping was applied. Data augmentations, including random flipping, random cropping, random rotations along the three base axes, and random intensity shifting, were applied. A patch-based training strategy was adopted, where 128 × 128 × 128 voxel patches were randomly extracted from the preprocessed images.
The network utilized residual units with two convolutional layers per unit to enhance feature learning. The AdamW optimizer was used with an initial learning rate of 1e-4, adjusted dynamically using a reduce-on-plateau scheduler with a decay factor of 0.5. The loss function combined Dice loss and focal loss to ensure accurate segmentation of both large and small structures. The model was trained with a batch size of 2. Training was conducted on an NVIDIA A6000 graphics processing unit (GPU) with 48GB VRAM, and early stopping was applied based on validation performance.
For inference, a sliding window approach with a patch size of 128 × 128 × 128 and 50% overlap was used to generate smooth segmentation maps for large volumetric images. Post-processing techniques, including softmax activation followed by argmax to obtain class labels and the application of morphological operations (hole filling and small object removal), were used to refine the final segmentations.
The trained segmentation model was deployed in the clinic using DICOM communication, as depicted in Figure 1. The segmentation workflow begins by exporting a CT scan in DICOM format from the clinical database. This scan is then automatically transferred to the AI segmentation pipeline, which can be hosted by the Computing Server either on-premises or in the cloud. Upon receiving the DICOM files, the automated segmentation pipeline is triggered. The pipeline coordinates a series of procedural stages. The process begins with pre-processing, where DICOM files are converted into a single 3D volume to optimize input for the subsequent AI segmentation model. The inference stage, powered by a GPU, applies the AI segmentation model to delineate the liver volume. Next, the post-processing stage transforms the results in a 3D mask volume into the DICOM RT Structure Set (DICOM-RTst) format. Upon completion, the pipeline exports the segmented results in the DICOM-RTst format to the initial DICOM storage location where the CT scans reside, or to a designated DICOM location. The automatically generated liver contours can be accessed by clinic users using any DICOM-compatible software.

Schematic diagram of deep learning-based auto segmentation implementation for clinical use.
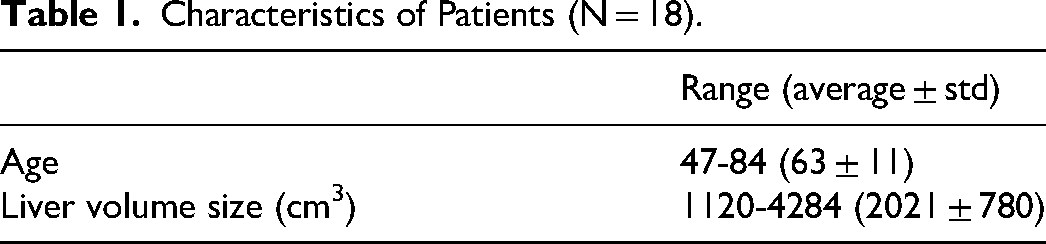
The model was tested with the CT images of 18 SIRT patients who were treated for metastatic liver adenocarcinoma at our institution in recent years. The images were contrast-enhanced diagnostic CT images. No image processing was applied. Table 1 lists the patients’ characteristics.
Characteristics of Patients (N = 18).
Evaluation Metrics
The auto-segmented liver contours were compared with the liver contours used in the SIRT procedures, which were manually delineated by radiation oncologists. The latter were taken as the ground truth. Dice similarity coefficient (DSC) and mean distance to agreement (MDA) were calculated.
The DL auto-segmentations were compared with Atlas-based auto-segmentations, which were performed with MiM Maestro (version 6.67) using a similar method as that in the literature. 15 DSC and MDA were compared.
Further, the liver volumes obtained in the DL auto-segmentations were compared to the liver volumes obtained from the manual delineations, using the ratio of volume (RV).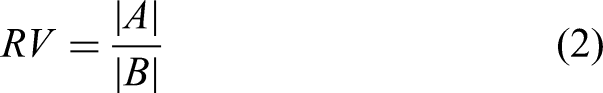
Statistical Analysis
Wilcoxon signed rank test was applied to measure the difference in DSC and MDA between DL auto-segmented contours and Atlas auto-segmented contours. A P-value less than .05 was considered statistically significant.
Results
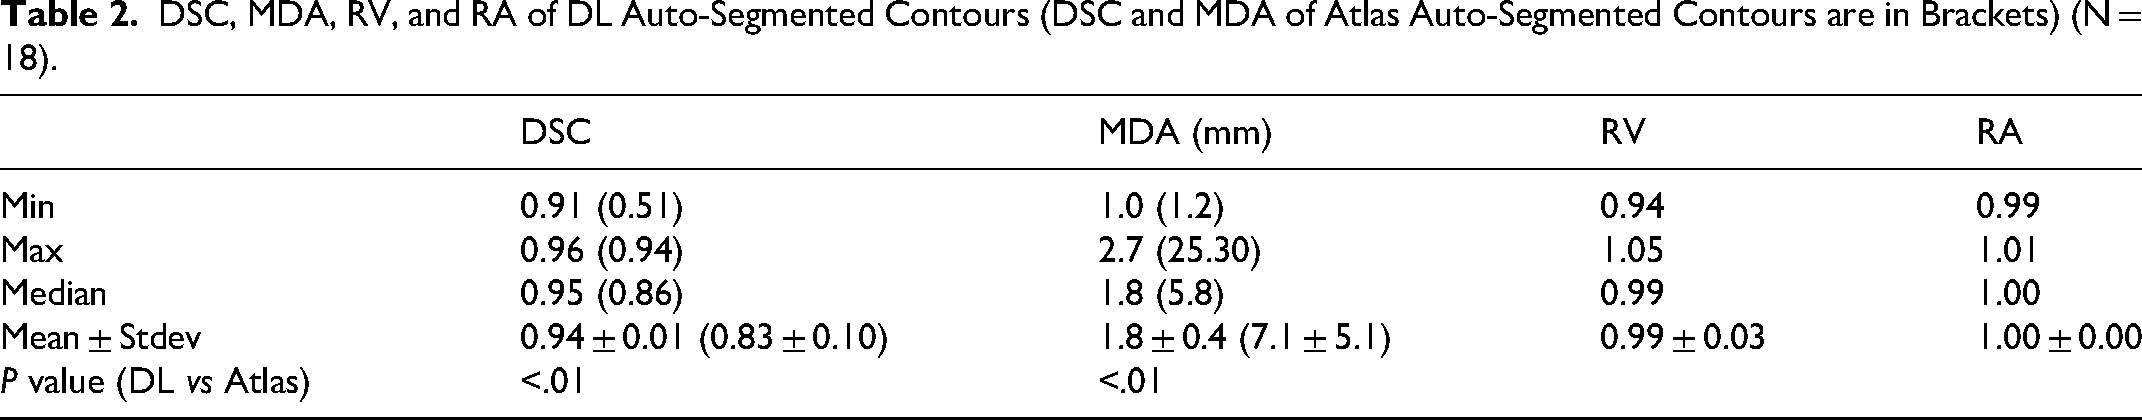
The DSC and MDA are shown in Figure 2(a) and (b), respectively. The DSC of DL auto-segmented contours ranges from 0.91 to 0.96 (average: 0.94 ± 0.01), which indicates good agreement between the DL auto-segmented contours and the manually-delineated contours. The MDA ranges from 1.0 to 2.7 mm (average: 1.8 ± 0.4 mm). The DSC of Atlas auto-segmented contours ranges from 0.51 to 0.94 (average: 0.83 ± 0.10), and the MDA ranges from 1.2 to 25.3 mm (average: 7.1 ± 5.1 mm). The DL auto-segmented contours have a larger average DSC and smaller average MDA than the Atlas auto-segmented contours.

(a) Dice similarity coefficient and (b) mean distance agreement, calculated between auto-segmented liver contours and manually-delineated liver contours. The results of Atlas-based auto-segmentations (in orange) are provided as a comparison to the results of deep learning (DL)-based auto-segmentationso (in green).
Figure 3 shows contour comparison in two cases. The DL auto-segmented contour is in green, the Atlas auto-segmented contour is in yellow, and the manually-delineated contour is in red. Figure 3(a) is the case where the Atlas auto-segmented contour has the highest DSC (0.94) among all the Atlas auto-segmented contours. The Atlas auto-segmented contour shows good agreement with the manually-delineated contour. In this case, the DL auto-segmented contour (DSC: 0.95) shows even better agreement with the manually-delineated contour. Figure 3(b) is the case where the DL auto-segmented contour has the lowest DSC (0.91) among all the DL auto-segmented contours. The DL auto-segmented contour is still better than the Atlas auto-segmented contour, which has a DSC of 0.79.
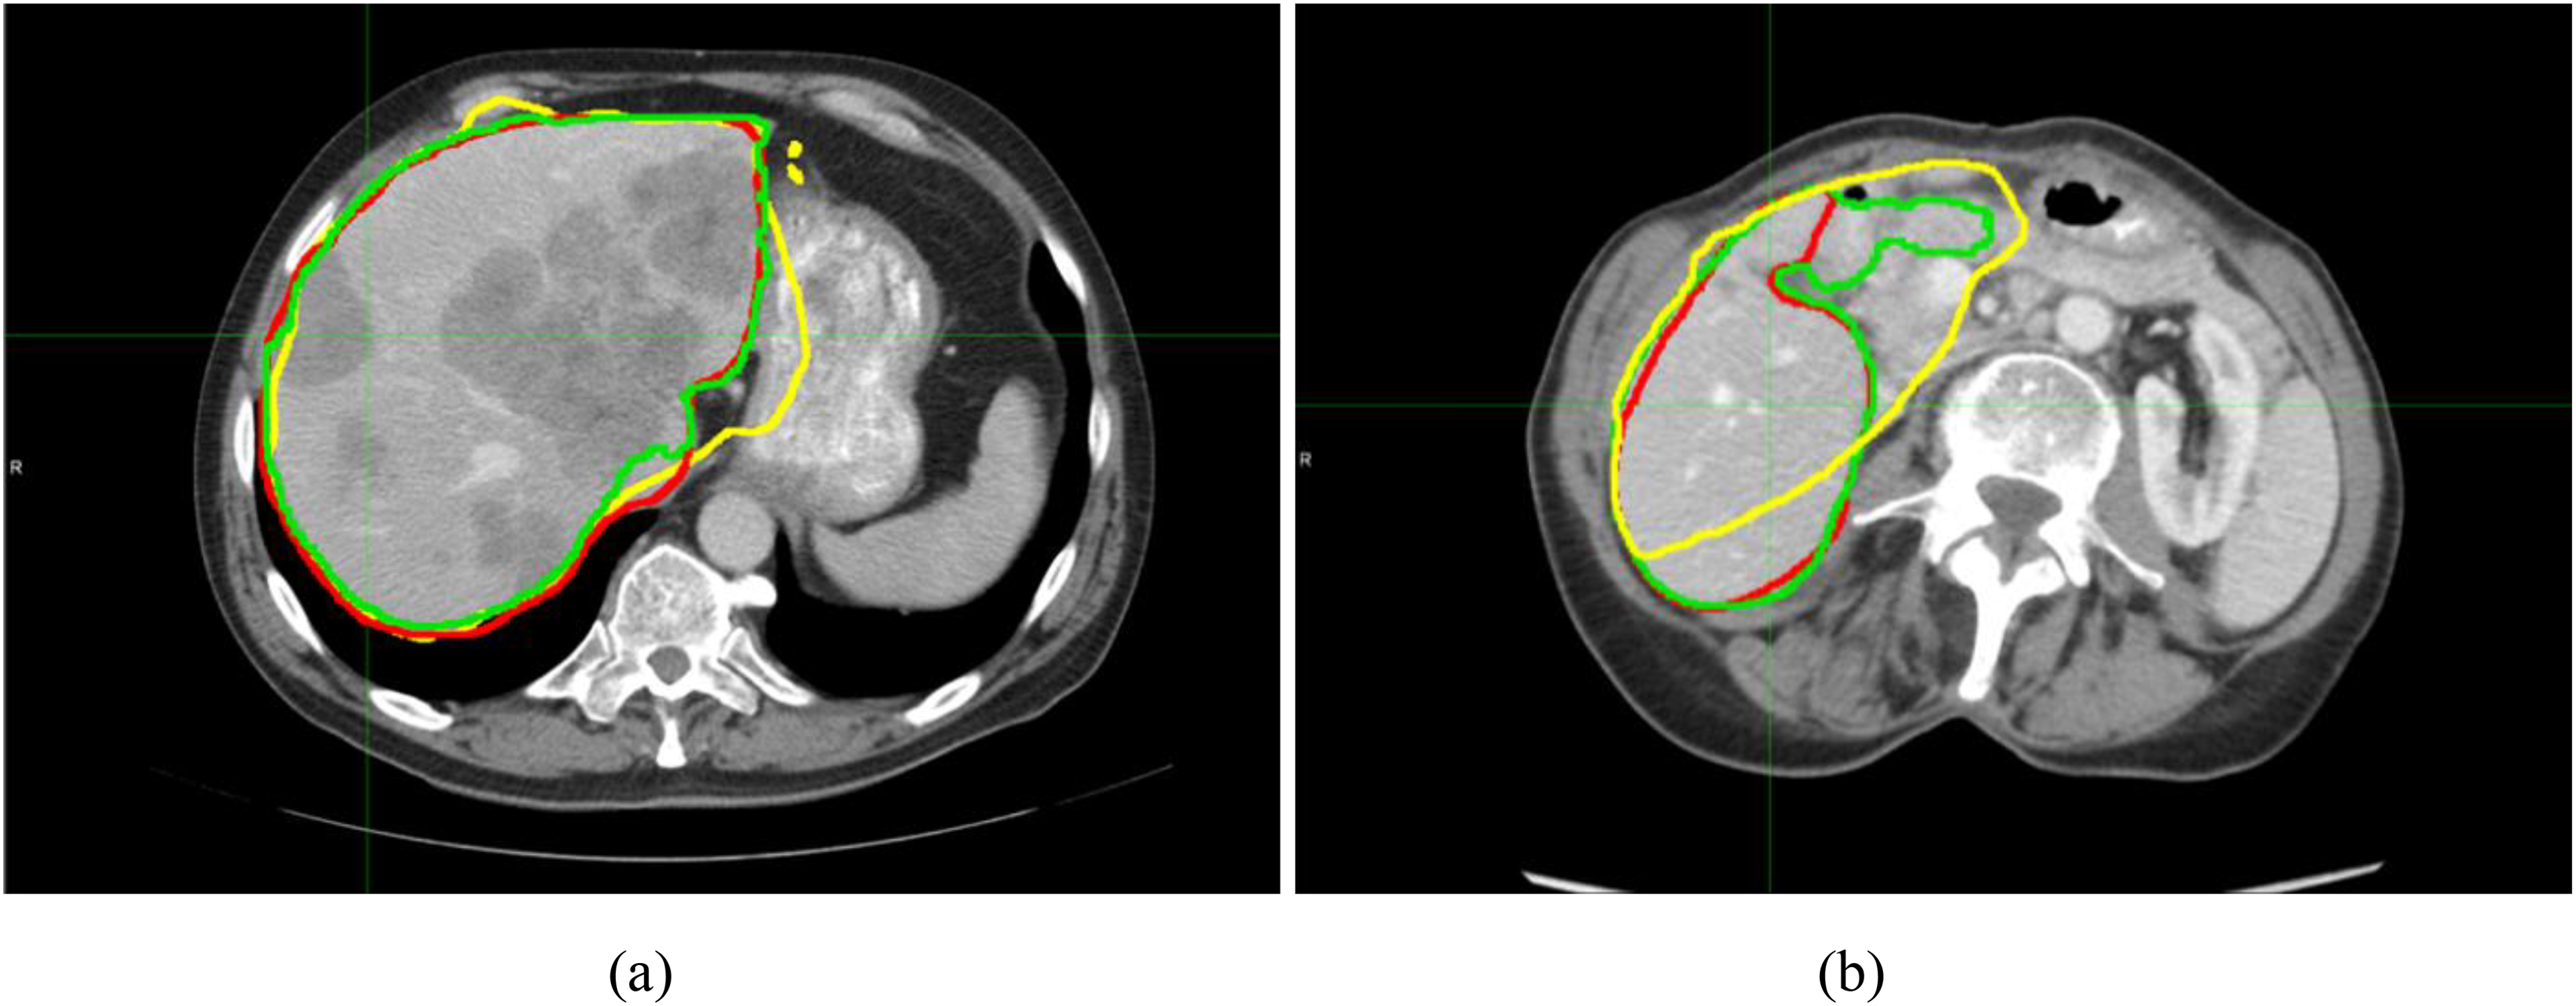
Auto-segmented liver contours generated in two cases: (a) DSCAtlas = 0.94 and DSCDL = 0.95; and (b) DSCAtlas = 0.79 and DSCDL = 0.91. The DL-based auto-segmented contour is in green, the Atlas-based auto-segmented contour is in yellow, and the manually-delineated contour (ground-truth) is in red.
Statistical analysis shows that the differences in both DSC and MDA are significant between the DL auto-segmented contours and Atlas auto-segmented contours (P < .01). The DL auto-segmented contours have better agreement with the manually-delineated contours (the ground truth) than the Atlas auto-segmented contours.
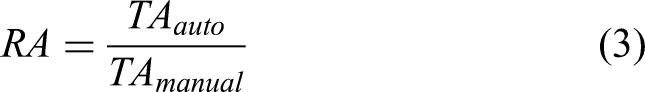
Figure 4 and Figure 5 show RV and RA, respectively, which were calculated using the DL auto-segmented liver volumes. The RV ranges from 0.94 to 1.05 (average: 0.99 ± 0.03), and RA ranges from 0.99 to 1.01 (average: 1.00 ± 0.00). Table 2 lists the result summary.

Ratio of DL auto-segmented liver volumes to manually-delineated liver volumes.

Ratio of Y-90 activities calculated using DL auto-segmented liver volumes to Y-90 activities calculated using manually-delineated liver volumes.
DSC, MDA, RV, and RA of DL Auto-Segmented Contours (DSC and MDA of Atlas Auto-Segmented Contours are in Brackets) (N = 18).
Discussion
To the best of our knowledge, published studies on auto-segmentation in SIRT were based on Atlas-based segmentation methods.15,16 There were no publications on applying DL-based auto-segmentation in SIRT. In this study, we built a DL model and explored its application to SIRT. The results show that the liver contours generated with the DL model have better agreement with the manual delineations than those generated with the Atlas-based method. The study demonstrates the application of DL based auto-segmentation in SIRT and shows that DL-based auto-segmentations are superior to Atlas-based auto-segmentations in the SIRT applications.
A recent publication that evaluated five commercial AI software for organ delineation in radiotherapy, reported DSCs ≥ 0.96 for liver delineation in breast cancer patients and lung cancer patients, 24 which are slightly higher than the DSCs (≥ 0.91) in our study. It is noted that the test data are different between that study and our study. The test data in our study were of liver cancer patients, and the images were contrast-enhanced images. The heterogeneity of the liver (due to tumors) and the fact that adjacent tissues might have similar image intensities as the liver or higher image intensities (due to contrast agent) (see Figure 3(b)), brought challenges to the auto-segmentation of the liver in our study.
The DSCs of liver contours generated with the DL model in this study have similar magnitudes to those achieved with the best segmentation algorithm in the competition studies using test data of liver cancer patients. 21 Although the test data and the segmentation models are different between our study and that study, the DSCs indicate that our DL auto-segmentation model performs well. The results also indicate that the LiTS dataset can be used as training data for DL models used in SIRT.
RA results show that Y-90 activities calculated using the DL auto-segmented liver volumes are close to the accurate activities calculated using the manually-delineated liver volumes: the differences are within 1%. The results indicate that the DL model can be applied for SIRT procedures. With physicians’ review or slight edits, the contours can be used for activity calculations.
The DL auto-segmentation approach implemented in the study can process large amounts of data efficiently. The DICOM communication makes the approach easy to deploy in a clinical environment. In the study, CT images of all 18 cases were sent to the server at the same time to generate contours. The entire process of all the cases, from sending CT images to receiving contours in the clinical database, took about 30 min. For a single case, the process takes about 1-2 min. The quick process is important for clinical applications where a large volume of CT scans can be segmented. Except for the step of selecting image data to send, other steps of the process (ie, generating contours and returning contours back to the clinical database) are fully automatic.
The number of test cases in the study was limited by the number of SIRT patients that were treated at our institution. We expect to test more cases in the future.
In the study, lower DSCs occurred in the cases where the tissues adjacent to the liver had similar image contrast as the liver or higher image contrast. The current model had difficulty in dealing with such situations. We anticipate further studies to improve the model to overcome these challenges.
Conclusions
A DL-based segmentation model was built, which was able to successfully identify and segment livers in the CT images of SIRT patients and provide reliable results. It outperformed the Atlas method. The model can be easily deployed in a clinical environment using DICOM communication, which can process large amounts of data efficiently. The application of the model will improve the efficiency of liver segmentation in SIRT clinical practice.
Footnotes
Abbreviations
Ethical Considerations
IRB office determined that the study did not require IRB approval because the retrospective study used anonymized data.
Funding
The authors disclosed receipt of the following financial support for the research, authorship, and/or publication of this article:
Conflicting Interests
The authors declared no potential conflicts of interest with respect to the research, authorship, and/or publication of this article.