
Abstract
Introduction
This study aims to evaluate auto-segmentation results using deep learning-based auto-segmentation models on different online CT imaging modalities in image-guided radiotherapy.
Methods
Phantom studies were first performed to benchmark image quality. Daily CT images for sixty patients were retrospectively retrieved from fan-beam kilovoltage CT (kVCT), kV cone-beam CT (kV-CBCT), and megavoltage CT (MVCT) scans. For each imaging modality, half of the patients received CT scans in the pelvic region, while the other half in the thoracic region. Deep learning auto-segmentation models using a convolutional neural network algorithm were used to generate organs-at-risk contours. Quantitative metrics were calculated to compare auto-segmentation results with manual contours.
Results
The auto-segmentation contours on kVCT images showed statistically significant difference in Dice similarity coefficient (DSC), Jaccard similarity coefficient, sensitivity index, inclusiveness index, and the 95th percentile Hausdorff distance, compared to those on kV-CBCT and MVCT images for most major organs. In the pelvic region, the largest difference in DSC was observed for the bowel volume with an average DSC of 0.84 ± 0.05, 0.35 ± 0.23, and 0.48 ± 0.27 for kVCT, kV-CBCT, and MVCT images, respectively (p-value < 0.05); in the thoracic region, the largest difference in DSC was found for the esophagus with an average DSC of 0.63 ± 0.16, 0.18 ± 0.13, and 0.22 ± 0.08 for kVCT, kV-CBCT, and MVCT images, respectively (p-value < 0.05).
Conclusion
Deep learning-based auto-segmentation models showed better agreement with manual contouring when using kVCT images compared to kV-CBCT or MVCT images. However, manual correction remains necessary after auto-segmentation with all imaging modalities, particularly for organs with limited contrast from surrounding tissues. These findings underscore the potential and limits in applying deep learning-based auto-segmentation models for adaptive radiotherapy.
Introduction
Radiation therapy plays an essential role in managing many cancers and other diseases. Over 50% of the patients with the most common cancer types will receive radiation therapy from, for example, linear accelerators (Linacs), as part of their cancer management. 1 With modern external-beam radiotherapy treatment planning and delivery techniques, image-guided radiotherapy (IGRT) has become routine before Intensity-modulated radiotherapy (IMRT) to position the target area more precisely and accurately. As a result, IGRT/IMRT has improved the therapeutic ratio by delivering highly conformal radiation to target volumes while sparing adjacent normal organs at risk (OARs). On the other hand, imaging from IGRT still needs to be entirely used to its potential. Despite modern immobilization and setup techniques, daily anatomical variations, such as bladder/rectum fillings and small bowel loop movement, frequently happen, leading to variations in delivered dose to target volumes and normal organs, especially in pelvic and thoracic regions where significant drifts due to the motion and changes in anatomical structures could cause suboptimal treatment. To resolve this clinical challenge, adaptive radiotherapy (ART) techniques have been proposed to adapt radiotherapy treatment to account for anatomy changes. 2 For ART, the imaging quality from IGRT needs to be further studied to see if they are suitable for ART purposes rather than just positioning purposes.
ART has the potential to reduce treatment-related organ toxicities further and to allow dose escalation to target volumes. However, as multiple adaptive treatment plans are generated during the radiotherapy course, sometimes even for each treatment fraction, there is an urgent need for efficient target and normal organ delineation and rapid plan generation to alleviate the extra time and resources required in ART workflow. One critical step for ART workflow is to generate the target and nearby OARs timely. The current workflow needs clinicians to manually contour those structures, which is time-consuming and prone to human errors. Different techniques have been proposed to efficiently generate structures in ART planning, including contour propagation through deformable image registration and auto-segmentation using artificial intelligence (AI) algorithms or atlas-based models. Those proposed methods need better image quality for the computer algorithm to generate structures more efficiently and accurately. Compared to other automated contour delineation techniques, AI auto-segmentation algorithms are independent of image registration results and could provide even higher accuracy. As a subset of AI auto-segmentation techniques, deep learning models are based on historical segmentation data and are widely used clinically for auto-segmentation. However, most deep learning auto-segmentation models are trained with high-quality CT images. In contrast, images used for ART treatment planning may be daily pre-treatment images from the treatment machine with inferior image quality compared to diagnostic or simulation CT images. The benefits of using deep learning auto-segmentation tools on daily images from treatment machines should be evaluated before ART treatment planning clinical implementation.
In 2020, a new linac model with integrated multi-modality imaging capabilities (X1, RefleXion Medical, Inc., Hayward, California) became commercially available in the US. It integrates a compact 6-MV photon beam linac with positron emission tomography (PET) and fan-beam kilovoltage CT (kVCT) imaging subsystems on the same ring gantry. The CT imaging system includes a 16-row kVCT scanner for daily pre-treatment image-guided target alignment. Research has shown that the kVCT images from the X1 machine had comparable image characteristics compared to CT simulation images and could be used for ART purposes.3,4 We hypothesized that daily kVCT images from the X1 machine were more suitable for efficient structure delineation with clinical deep learning auto-segmentation models compared to other online imaging modalities. In this study, we evaluated the performance of deep learning auto-segmentation models on kVCT images from the X1 machine and compared it to the existing online CT imaging modalities from other radiotherapy delivery systems.
Methods
Ethics Approval Statement
This research project was carried out according to our institution's guidelines and was approved in January 2023. This is an IRB-approved retrospective study, and all patient information was de-identified, so patient consent was not required. Patient data will not be shared with third parties.
Demographics
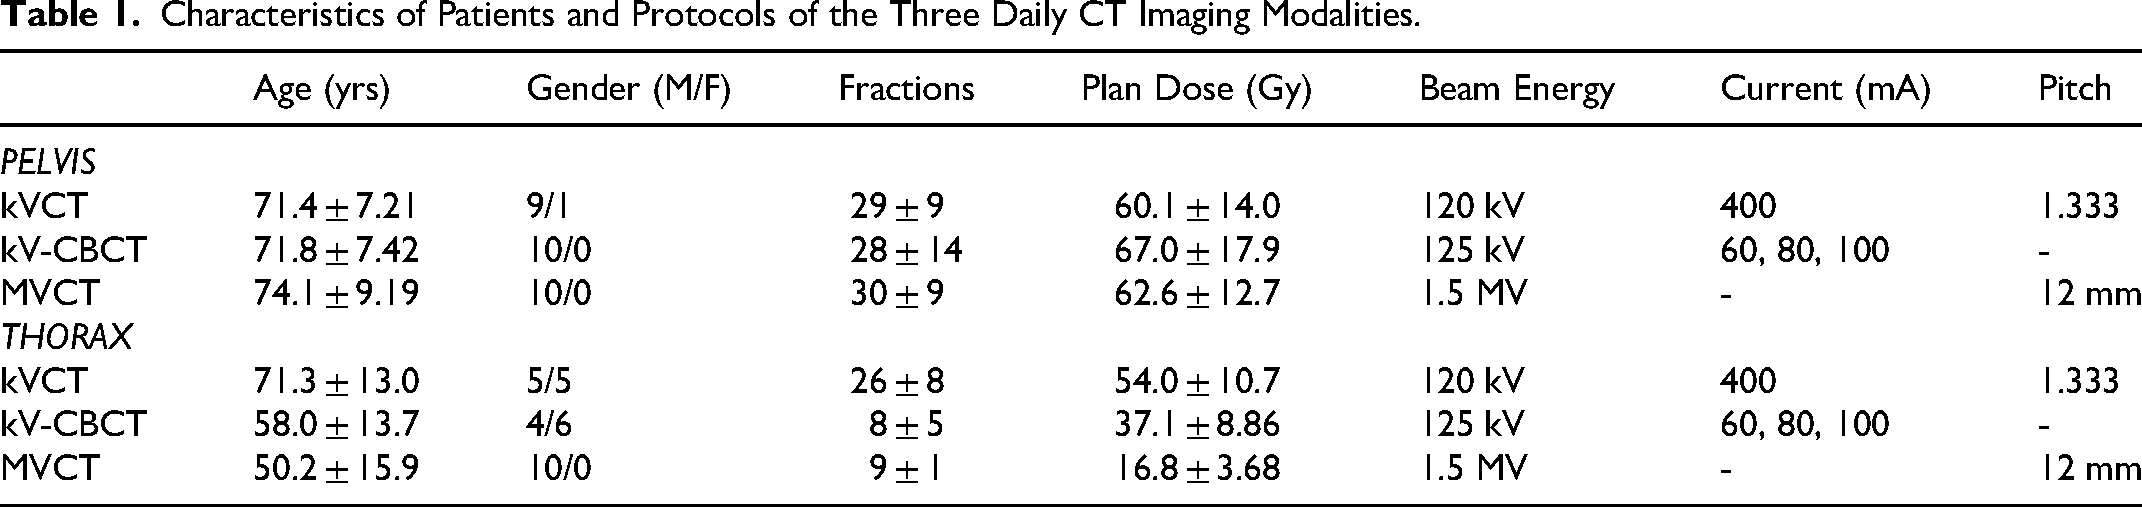
The reporting of this study conforms to STROBE guidelines. 5 We retrospectively retrieved daily IGRT images for a total of sixty patients who were previously treated at our institution. Patients were selected consecutively in a reverse chronological order starting with the most recent patients treated on the radiotherapy machines. All patients were scanned in a head-first supine position. Twenty patients were treated on helical tomotherapy (HT) (Hi-ART II, Accuray Inc., Sunnyvale, CA) with daily megavoltage CT (MVCT) scans, another twenty patients were treated on conventional C-arm linacs (TrueBeam linac, Varian Medical Systems, Inc., Palo Alto, CA) with daily kilovoltage cone-beam CT (kV-CBCT) scans, and the remaining twenty patients were treated on the X1 machine with daily fan-beam kVCT scans. For each imaging modality, ten patients had daily CT scans in the pelvic region, while the other ten had daily CT scans in the thoracic region. Details about patient demographics, dose prescription, and imaging protocols are listed in Table 1. The numbers of patients included in this study are based on the approximate numbers of patients treated on the X1 machine for each anatomical site at the time of study initiation.
Characteristics of Patients and Protocols of the Three Daily CT Imaging Modalities.
Protocols of Daily CT Imaging
The X-ray tube peak potential values were 120 kV and 125 kV in the X1 kVCT and TrueBeam kV-CBCT scans, respectively, while it was 1.5 MV in HT MVCT scans. The X-ray tube currents were 400 mA in X1 kVCT scans and 60∼100 mA in kV-CBCT scans. The pitch values were 1.333 and 12 mm per rotation in X1 kVCT and HT MVCT scans, respectively.
Image Segmentation
The convolutional neural network (CNN) based deep learning methods have been shown to provide excellent auto-segmentation results with improved accuracy compared to traditional segmentation approaches, including but not limited to head and neck (H&N) organs at risk (OARs), thoracic OARs, and pelvic OARs.6-8 In this work, an auto-segmentation software system, MedMinds AI (MedicalMind Co., Ltd, Beijing, China), 9 was deployed in our institution which was based on a CNN algorithm and trained with diagnostic and treatment planning CT images and contouring data (> 1000 training datasets) to generate auto-segmentation models for the pelvic and thoracic regions, respectively. During model training, the entire network used the Adaptive Moment Estimation optimizer with an initial learning rate of 0.0001, which decays by an exponential function with gamma = 0.9 for every epoch. 10 In pelvic cases, normal organs included the bladder, rectum, bowel, and left and right femoral head; in contrast, in thoracic cases, the left and right lung, esophagus, heart, and spinal cord were included. The U-Net was used as the basic architecture for the deep learning model, 7 which contained an encoder part and a decoder part, and both the encoder and decoder included five context aggregation blocks instead of the convolutional layers, with the feature maps in the encoder concatenated to those in the decoder. Previous results have demonstrated that this optimized U-Net algorithm outperformed the benchmark U-Net methods, providing high-quality clinically acceptable organ segmentation that can be used in radiation therapy planning.6,7 Furthermore, the trained auto-segmentation models have already incorporated data normalization and several artifact corrections (eg, gridding artifacts), as described by Liu et al.. 11 Therefore, no additional pre-processing steps were performed in this work before feeding the daily images into models. For comparison, organs were also manually delineated by an experienced planner with over ten years of structure contouring experience as the ground truth. The manual contours were then visually inspected by one of the authors to ensure clinically acceptable quality. Figure 1 shows the study workflow chart.

Workflow Chart for the Study. DSC: Dice Similarity Coefficient; JSC: Jaccard Similarity Coefficient; SI: Sensitivity Index; II: Inclusiveness Index; HD95: 95th Percentile Hausdorff Distance.
Phantom Study
The CATPHAN 504 phantom (model: CTP 504, The Phantom Laboratory, Salem, NY) was used in this work to evaluate and compare image quality among kVCT, kV-CBCT, and MVCT images using daily scanning protocols. The CTP 404 module inside the CATPHAN 504 phantom, consisting of seven cylindrical inserts with different densities, was used for CT number validation and contrast-to-noise ratio (CNR) calculation. The CTP 486 slice, which is a uniform density module, was utilized for noise and uniformity analysis. The CTP 528 slice with 1 through 21 line-pairs per centimeter (lp/cm) and the CTP 515 slice with 2 through 15 mm supra-slice and sub-slice targets were used for high- and low-contrast spatial resolution evaluation, respectively.
Image Analysis
For phantom studies, the following quantitative metrics were analyzed and compared based on methods described by Kamath et al:
12
(a) The difference in CT numbers: Seven region-of-interests (ROIs) were drawn based on the tested materials of CTP 404 images, with the corresponding nominal CT numbers (unit: HU) Air (−1000), PMP (−200), LDPE (−100), polystyrene (−35), Acrylic (120), Delrin (340), and Teflon (990). The absolute difference values were then calculated between the image from each imaging modality and the planning CT image. (b) Noise: The SD of pixel intensities over an ROI (eg, 0.5 cm diameter circle) of CTP 486 images was calculated as the image noise. (c) CNR: The polystyrene tube was used in this work for the CNR measurement based on the following equation:

For patient studies, a set of most widely used geometric metrics,
13
such as Dice similarity coefficient (DSC), Jaccard similarity coefficient (JSC), sensitivity index (SI), inclusiveness index (II), and 95th percentile Hausdorff distance (HD95), were used to evaluate the quality of the auto-segmentation results compared to manual delineations. The DSC is defined as shown in the following equation:
The JSC is defined as the size of the intersection divided by the size of the union of the sample sets, as shown below:
The sensitivity index is calculated as below: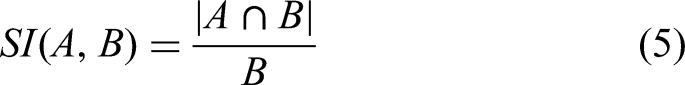

The 95th percentile Hausdorff distance is shown as the following equation:


All the above metrics were calculated with codes written in MATLAB (Mathworks, Natick, MA).
Statistical Analysis
Given the limited sample size and the use of evaluation metrics with a non-normal distribution in this study, data comparison across the three imaging modalities was conducted using the non-parametric Wilcoxon rank-sum test, where the difference was considered statistically significant if the p-value was less than 0.05.
Results
Table 2 shows quantitative image quality analysis results on phantom images from kVCT, kV-CBCT, and MVCT. Overall, the image quality, including factors such as CT number difference and image noise, was best in kVCT, intermediate in kV-CBCT, and worst in MVCT. Specifically, the CT number difference ranged from 0.5 to 21 HU in kVCT images, from −23 to 57 HU in kV-CBCT images, and from −138 to 102 HU in MVCT images. The measured image noise was 5.6, 6.3, and 23.1 HU in the kVCT, kV-CBCT, and MVCT images, respectively. The CNR was 22.1, 18.9, and 4.8 in the kVCT, kV-CBCT, and MVCT images, respectively. Measured image uniformity was −1.6, −4.8, and 21.1 HU in the kVCT, kV-CBCT, and MVCT images, respectively. In high contrast resolution tests, the highest discernable resolution was 6, 5, and 3 lp/cm with the kVCT, kV-CBCT, and MVCT images, respectively. In low contrast resolution tests, the number of discernable low-resolution circles was found to be 3, 2, and 1 in the kVCT, kV-CBCT, and MVCT images, respectively.
Quantitative Image Quality Analysis on Phantom Images from kVCT, kV-CBCT, and MVCT.
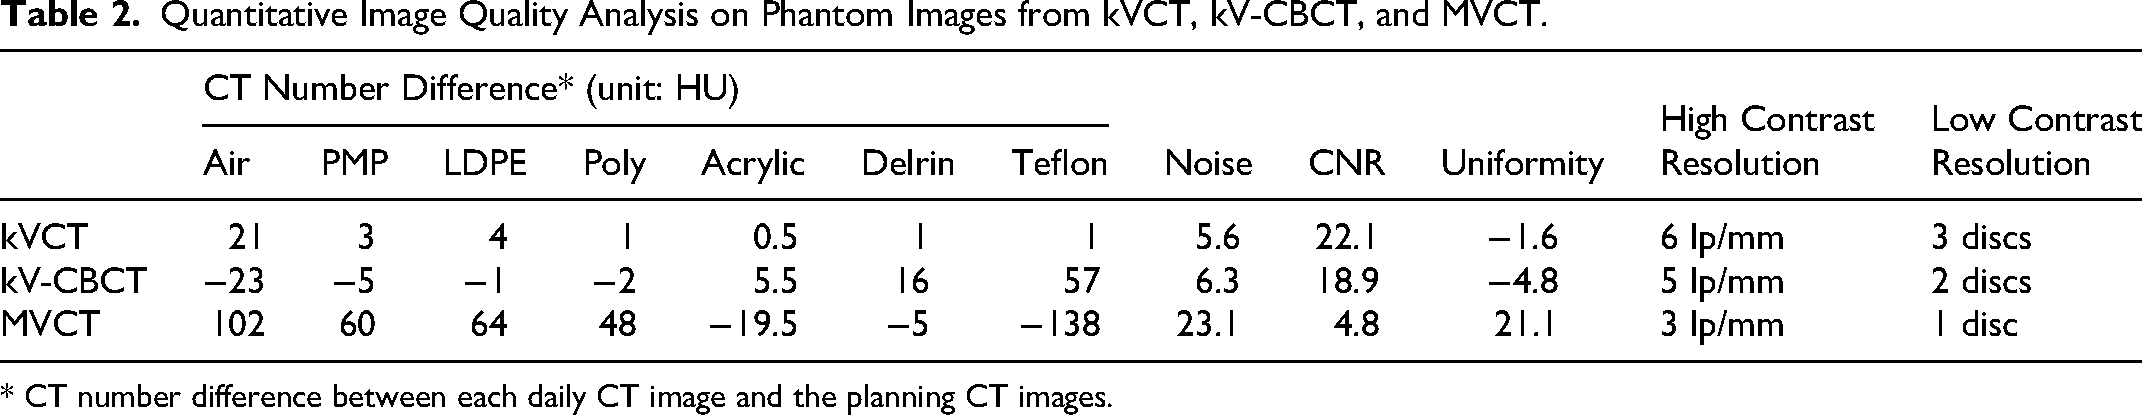
* CT number difference between each daily CT image and the planning CT images.
Figure 2 shows representative axial images with manual-segmentation and auto-segmentation results for kVCT (top), kV-CBCT (middle), and MVCT (bottom) in both the pelvic (left) and thoracic (right) regions. The window levels were adjusted as [−350, 200] and [−300, 350] for all images in the pelvis and thorax, respectively.

Representative Axial Images with Manual-Segmentation and Auto-Segmentation Results for the Three Daily CT Imaging Modalities in Both the Pelvic and Thorax Regions. Note that the Manual-Segmentation Results Were Delineated by an Experienced Planner for Each Organ and Imaging Modality, While the Auto-Segmentations Were from the Deep Learning Output.
Figures 3 and 4 show DSC, JSC, SI, II, and HD95 boxplots for the pelvis and thoracic cases, respectively. Besides, symbols “^,*,#” represent the statistically significant differences (p-value < 0.05) for each organ between kVCT and kV-CBCT, kVCT and MVCT, kV-CBCT and MVCT, respectively. The auto-segmentation contours on the kVCT images showed the highest average value of DSC, for example, compared to those on the kV-CBCT and MVCT images for all the major organs in both the pelvic and thoracic regions. With the kVCT images, the average DSC ranged from 0.58 ± 0.16 to 0.99 ± 0.01. In the pelvic region, the largest absolute difference in DSC was observed for the bowel volume with an average DSC of 0.84 ± 0.05, 0.35 ± 0.23, and 0.48 ± 0.27 for the kVCT, kV-CBCT, and MVCT images, respectively (p-value < 0.05). In the thoracic region, the largest absolute difference in DSC was observed for the esophagus, with an average DSC of 0.63 ± 0.16, 0.18 ± 0.13, and 0.22 ± 0.08 for the kVCT, kV-CBCT, and MVCT images, respectively (p-value < 0.05). Similarly, it can also be observed that the auto-segmentation contours on the kVCT images showed the highest average values of SI, II, and JSC compared to those on the kV-CBCT and MVCT images for all major organs except the rectum, where images from kV-CBCT yield the best in these metrics. The auto-segmentation contours on the kVCT images showed the lowest average values of HD95 compared to those on the kV-CBCT and MVCT images for all major organs except the rectum, where images from MVCT yield the lowest one. For the bowel, however, all the auto-segmentation results exhibited large values of HD95 compared to the manual-segmentation contours. In addition, the auto-segmentation models failed to contour certain organs (eg, rectum, heart, and esophagus) on images from kV-CBCT in some patients, where the image quality was inferior.
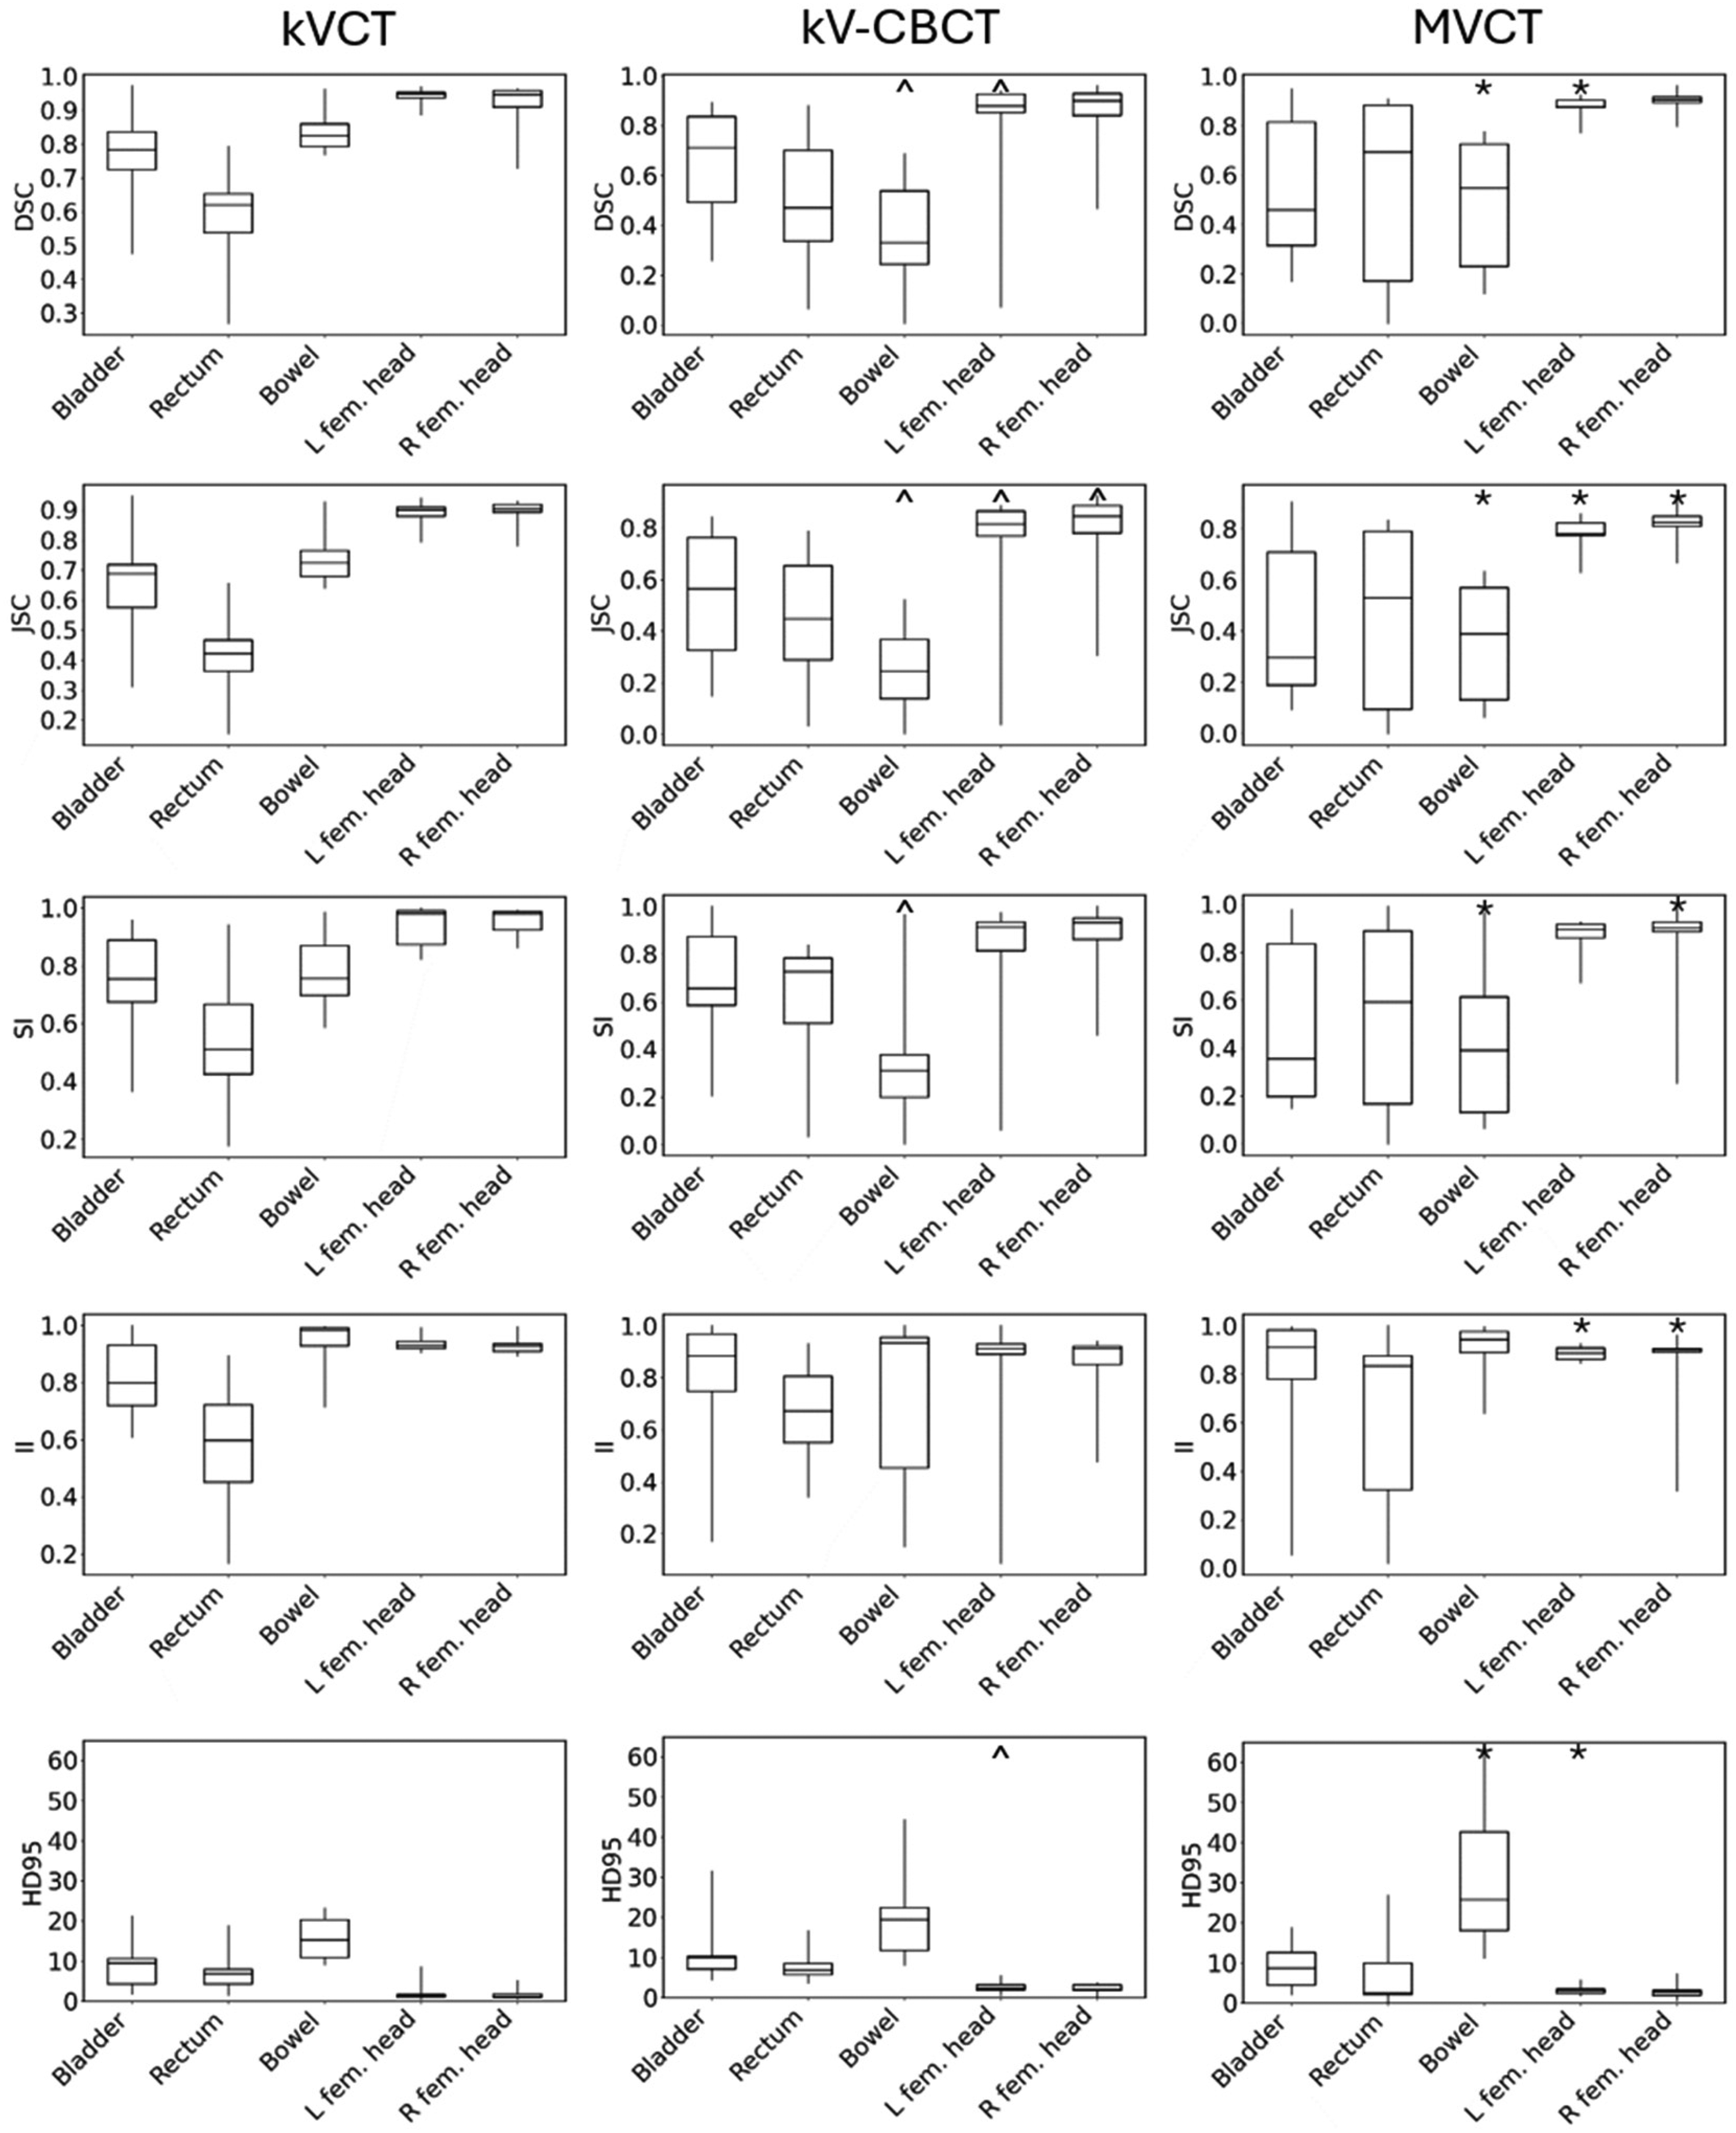
Distributions of DSC, JSC, SI, II, and HD95 for Pelvic Organs in the kVCT (Left), kV-CBCT (Middle), and MVCT (Right) Images. The First Quartile, Median, and Third Quartiles are Shown as the Upper, Middle, and Lower Bars of the Boxes. The Minimum and Maximum Values are Shown as the Extent of the Vertical Lines. the ^,*,# Represent the Statistically Significant Differences (p-Value < 0.05) Between kVCT and kV-CBCT, kVCT and MVCT, kV-CBCT and MVCT, Respectively.

Distributions of DSC, JSC, SI, II, and HD95 for Thoracic Organs in the kVCT (left), kV-CBCT (Middle), and MVCT (Right) Images. The first Quartile, Median, and third Quartiles are Shown as the Upper, Middle, and Lower Bars of the Boxes. The Minimum and Maximum Values are Shown as the Extent of the Vertical Lines. The ^,*,# Represent the Statistically Significant Differences (p-value < 0.05) Between kVCT and kV-CBCT, kVCT and MVCT, kV-CBCT and MVCT, Respectively.
Discussion
In this work, we have compared image quality among images from the RefleXion X1 (kVCT), TrueBeam (kV-CBCT), and HT (MVCT), respectively, and evaluated the performance of auto-segmentation models based on the CNN algorithm on the daily CT scanning images. Both CATPHAN and in vivo results show that images from kVCT yielded the best image quality over kV-CBCT and MVCT in terms of image contrast, artifacts, and noise, primarily because: 1) Compared to kVCT which used narrow fan-beam x-rays, kV-CBCT used broad cone-shaped beams, of which the spatial resolution, especially the through-plane resolution, was reduced. Furthermore, the scattering without the anti-scatter grid, the under-sampling especially at the periphery of the field of view, and the beam hardening effects were also increased, resulting in more streaking artifacts and reduced image contrast; 2) Compared to kVCT which used kilovolt x-rays (120 kVp in this work), MVCT used much higher energy MV photons beams which exhibited almost no photoelectric effect and significantly less beam attenuation, resulting in worse image contrast, low SNR, and image blurring. This was also demonstrated in auto-segmentation performance with kVCT showing the highest values of DSC, SI, II, JSC, and HD95 for most of the main organs in pelvic and thoracic regions among these three modalities. However, significant auto-segmentation errors occurred for organs with limited image contrast from surrounding tissues, as can be seen in Figures 2–4 when contouring the bowel, bladder, rectum, and esophagus, thus requiring manual corrections on the results of auto-segmentation. It is worth noting that although in phantom studies images from kV-CBCT did not show obvious artifacts, in patient studies, especially in thorax, the streaking artifacts significantly degraded the auto-segmentation accuracy.
Thanks to technological advancement in AI algorithms, auto-segmentation systems based on CNN models are currently widely used in clinical radiotherapy workflow. At our institution, implementation of the auto-segmentation system has led to an average reduction of 70%–80% in structure delineation time on planning CT images compared to manual contouring, as reported by the dosimetrist team. It has been used for almost all clinical radiotherapy cases and was used in delineating a comprehensive set of major organs throughout the body on planning CT images. 8 As modern radiotherapy delivery machines typically provide integrated three-dimensional (3D) imaging modalities, 3D imaging is commonly used for daily image-guided patient positioning. The availability of 3D images throughout the treatment course also allows monitoring of anatomical and physiological changes in the treatment course. Studies have evaluated the feasibility of using daily CT images as imaging biomarkers4,14 and for evaluating dosimetric variations due to anatomical and positioning changes.15,16 In addition, studies have been conducted to directly use daily 3D images for ART.17,18 For all the applications with daily CT images, efficient segmentation methods are needed so that they can be routinely used in clinical settings. This study highlights the difference in AI-generated auto-segmentation results among different online CT imaging modalities. Of note, the performance of the U-net deep learning models will be affected by the difference in image contrast, artifacts, and noise. For example, adding noise to input images can significantly lower the accuracy in object segmentation by U-Net models, and noise makes it harder for the U-Net model to accurately identify boundaries of target objects. 19 At the same time, a low CNR can significantly impact the U-Net model's ability to detect boundaries and features. 20
Note that in this work, the vendor-provided auto-segmentation model was based on diagnostic and planning kVCT images only, and we did not implement models trained specifically for kV-CBCT and MVCT images. In fact, most commercial auto-segmentation systems were trained with high-quality diagnostic CT image data, as feeding low-quality image data for model training could significantly lower the U-Net model's ability to correctly segment objects. 19 Research is ongoing to improve the performance of U-Net models in the presence of noise, which could potentially improve the performance of auto-segmentation systems on kV-CBCT and MVCT images. Some pre-processing techniques have been evaluated to denoise images before input to the U-Net model. 21 Specialized U-Net architecture has also been proposed for improved noise robustness. 22 Data augmentation has demonstrated its ability in auto-segmentation using CT images by introducing variability in the training datasets, including but not limited to improving model generalization, reducing overfitting, and enhancing robustness.23-25 Therefore, data augmentation will be a promising mean to be incorporated into modality-specific auto-contouring models. On the other hand, we also observed that although the same protocol of daily imaging was used for patients treated on a specific machine, the variation in image quality, such as image artifacts (eg, metal artifacts) and SNR, degraded the auto-segmentation accuracy, presenting challenges on the stability and reproducibility of the deep learning model.
This study has several limitations. First, we only performed one deep learning-based auto-segmentation system that was deployed in our institution; however, we recommend evaluating multiple AI algorithms26-32 to evaluate the accuracy of auto-segmentation against manual-segmentation. For example, using U-Net-generative adversarial network (U-Net-GAN) has shown improved auto-segmentation accuracy in thorax CT planning images over the conventional U-Net methods. 26 Chen et al used a transfer learning method to fine tune the neural network weights, outperforming a common population network and clinical registration-based method with higher accuracy in H&N and pelvic cancers. 32 Second, the sample size of this retrospective study is relatively small, consisting of only sixty patients. Therefore, there may be some biases in auto-segmentation results, potentially resulting in overestimated performance which cannot fully represent the total population and low sensitivity in detecting the outliers because of specific cases chosen. The need for a larger patient study to be performed in future work is urgent. Third, the lack of modality-specific models for MVCT and kV-CBCT could result in degradation in auto-segmentation performance due to the difference in image quality (eg, spatial resolution, contrast, and artifacts) between the model training datasets (the planning kVCT images) and the testing datasets (the daily patient-specific kV-CBCT or MVCT images). Fine-tuning or re-training the CNN with the data augmentation technique or on MVCT 33 and kV-CBCT 34 training images could potentially improve auto-segmentation performance; however, it is beyond the scope of this paper, and the model generation and optimization implemented by the vendor have not yet been made publicly available to users. Last, it is impractical to collect the daily CT images with all three imaging modalities for the same patient, and thus, a robust pair comparison is not possible to evaluate. CATPHAN study can be performed via all kVCT, kV-CBCT, and MVCT, yet the simple structures cannot be perfectly simulated as human organs, where any motion and CT streaking artifacts are nonnegligible.
Conclusion
Results from deep learning-based auto-segmentation models showed improved agreement with gold-standard manual contouring when kVCT images from the X1 machine were used, compared to kV-CBCT or MVCT images acquired on other radiotherapy machines. More efficient structure delineation is expected when daily kVCT images are used with clinical deep learning-based auto-segmentation models in the ART workflow. However, manual correction is necessary for auto-segmentation results from all imaging modalities, especially for organs with limited contrast from surrounding tissues, such as bowel, bladder, rectum, and esophagus.
Footnotes
Abbreviations
Author’s Note
Seyi M Oderinde, Advanced Molecular Imaging in Radiotherapy (AdMIRe) Research Laboratory, School of Health Sciences, Purdue University, West Lafayette, IN, USA and Department of Radiation Oncology, Indiana University School of Medicine, Indianapolis, IN, USA.
Author Contributions
The authors contributed to the paper as follows: study design: SO and CH; data collection: ZW, CW, and CH; data analysis: ZW, CS, and CH; manuscript preparation: ZW, CS, and CH; manuscript review: ZW, CS, CW, SO, WW, KQ, BL, TW, AL, and CH. All authors reviewed the results and approved the final version of the manuscript.
Funding
The authors disclosed receipt of the following financial support for the research, authorship, and/or publication of this article: This work is supported by RefleXion Medical, Inc., (grant number Exhibit 9).
Declaration of Conflicting Interests
The authors declared the following potential conflicts of interest with respect to the research, authorship, and/or publication of this article: CH and AL received research funding support from Reflexion Medical, Inc.
Date Availability Statement
Data in this study is stored in authors’ institutional storage space and is available upon request.