
Abstract
This study aimed to develop an automated classification framework for distinguishing between cervical cancer tumor and normal uterine tissue, leveraging CT images for radiomics feature extraction. We retrospectively analyzed CT images from 117 cervical cancer patients. To distinguish between cancerous and healthy tissue, we segmented gross tumor volume and normal uterine tissue as distinct regions of interest (ROIs) using manual segmentation techniques. Key radiomic parameters were extracted from these ROIs. To bolster model's predictive capability, the data was stratified into train data (70%) and validation data (30%). During feature selection phase, we applied Least Absolute Shrinkage and Selection Operator regression algorithm to identify most relevant features. Subsequently, we built classification models using five state-of-the-art machine learning algorithms: Support Vector Machine (SVM), Random Forest (RF), K-Nearest Neighbors (KNN), Extreme Gradient Boosting (XGBoost), and Decision Tree (DT). Ultimately, the performance of each model was evaluated. Through stringent feature selection process, we identified 18 pivotal radiomic features for classification of cervical cancer and normal uterine tissue. When applied to test data, all five models achieved excellent performance, with area under the curve (AUC) values ranging from 0.8866 to 0.9190 (SVM: 0.9144, RF: 0.9078, KNN: 0.9051, DT: 0.8866, XGBoost: 0.9190), all surpassing threshold of 0.8. In terms of test data, all five models had high sensitivity; accuracy of SVM, RF, and XGBoost models was comparable; and specificity of five models was similar. XGBoost model outperformed the others in terms of diagnostic accuracy, achieving an AUC of 0.8737 (95% CI: 0.8198-0.9277) for train data and 0.9190 (95% CI: 0.8525-0.9854) for test data. Our findings underscore the potential of CT radiomics combined with machine learning algorithms for accurately classifying cervical cancer tumors and normal uterine tissue with high recognition capabilities. This approach holds significant promise for clinical diagnostics.
Keywords
Introduction
Cervical cancer, predominantly caused by the Human Papillomavirus (HPV), poses a significant global health threat to women's health.1,2,3,4 Ranking fourth among female malignancies after breast, colorectal, and lung cancers, it is a leading cause of mortality among women. According to the 2020 global statistics, 604 000 new cases were diagnosed, resulting in 342 000 deaths. 5 In China, this trend is even more acute, with 109 000 new cases and 59 000 deaths, marking a continual escalation in both incidence and mortality rates over the past two decades. 6
Radiotherapy stands as a pivotal treatment modality for cervical cancer, and its precision plays a critical role in minimizing radiation-induced side effects and optimizing therapeutic outcomes.7,8,9 However, the complexity of cervical cancer target volumes, often encompassing critical organs, necessitates meticulous delineation of tumors and their surroundings before treatment. 10 Current methods for GTV segmentation primarily rely on the expertise and subjective judgment of radiation oncologists, which can introduce limitations on the design of the optimal radiotherapy plan for patients.11,12 Recent studies have further underscored the significance of early detection and precise diagnosis in mitigating mortality rates linked to cervical cancer.13–14
The emergence of radiomics technology offers a novel solution to this pressing challenge. 15 By meticulously extracting a comprehensive set of features from medical images, radiomics allows for the quantification of disease complexity, providing a quantitative tool for assessing tumor heterogeneity. 16 Its application has already demonstrated remarkable potential in diagnosing and predicting the prognosis of various cancers, paving the way for a new era of precision oncology. 17 Recent advancements pertaining to machine learning algorithms have further augmented the applicability of radiomics for diagnosing and predicting the prognosis of cervical cancer.18–19
Addressing the challenges inherent in cervical cancer management, this study introduces an innovative radiomics approach. By analyzing the features of cervical cancer GTV and normal uterine regions on CT images and leveraging a diverse array of machine learning algorithms, we aimed to automate the classification of cervical cancer GTV from normal tissues. This research hinged on identifying critical radiomic features that can effectively substitute for raw pixel values in CT images. By leveraging these features, we aimed to mitigate human bias inherent in manual tumor delineation. This approach has the potential to improve the precision of cervical cancer treatments, ultimately enhancing treatment efficacy and patient quality of life.
Materials and methods
Data collection
The reporting of this study conforms to TRIPOD guidelines (https://www.equator-network.org/reporting-guidelines/tripod-statement/). 20 We conducted a retrospective study, collecting clinical data and CT imaging data from 117 patients diagnosed with cervical cancer who underwent biopsy surgery between January 2016 and September 2022. To ensure the generalization ability of the model, we randomly divided the patient dataset into 70% train data and 30% test data for model development and evaluation. The inclusion criteria were strictly set, including (1) patients who underwent dual-phase enhanced CT scans before surgery; (2) no history of radiotherapy and chemotherapy; (3) histologically-confirmed malignant cervical tumors as determined by postoperative pathology, with complete clinical records; (4) age range of 18–80 years old, without contraindications for radiotherapy, and an expected survival period exceeding three months.
The exclusion criteria included: (1) CT images with severe motion artifacts or obvious noise interference; (2) maximum tumor diameter >1 cm; (3) presence of concurrent malignancies; (4) pregnant or lactating women, or individuals declined appropriate contraception.
CT Scanning parameters
This study utilized a Philips GEMINI TF 16 PET/CT system for image acquisition. Patients fasted for at least 6 h before the scan and their blood sugar levels were maintained within the physiological range (4.1-7.1 mmol/L). They then received an intravenous injection of “F-FDG” at a dosage of 0.10 to 0.15 mCi/kg. Following a 45–60-min rest period and voiding their bladders, patients underwent a PET/CT scan encompassing the region of the auditory meatus to the upper thighs. The scan employed a 3D acquisition mode with a 1.5-min interval per bed position. Low-dose CT scan parameters were set at 120 kV tube voltage, a tube current of 100mAs, and a slice thickness of 5 mm. Following the completion of the scan, the images were transferred to the radiation therapy planning system Eclipse 16.0, where they were fused with PET/MRI.
Delineation of Regions of Interest
The gross tumor volume (GTV) and the normal uterus were defined as the two regions of interest (ROIs). To facilitate image feature extraction, all images and ROIs were batch processed in DICOM format. All images were then manually segmented on the CT scans by two senior radiation therapists, each with 10 years of experience, with PET/MRI as a fusion reference. In case of disagreements, a third radiation therapist with 15 years of experience made the final decision. The primary tumor lesion GTV was delineated first on the images. Subsequently, the normal uterus tissue was derived by subtracting the GTV from the entire uterus, resulting in the final ROIs.
Image Preprocessing and Feature Extraction
The radiomics features relevant for IMRT planning were extracted from the GTV using the three-dimensional (3D) slicer platform. The PyRadiomics package, available at http://PyRadiomics.readthedocs.io/en/latest, was used to perform the feature extraction. First, all images were resampled to a uniform voxel size of 1 × 1 × 1 mm³. The image quantification method utilized a bin width of 25. Subsequently, the GTV and normal uterine tissue were taken as the regions of interest (ROI), and the open-source radiomics plugin SlicerRadiomics in 3Dslicer, combined with wavelet transform filtering technology, comprehensively extracted radiomics features from the ROI area of the CT image, including first-order statistics (firstorder), gray-level co-occurrence matrix (GLCM), gray-level dependence matrix (GLDM), gray-level run-length matrix (GLRLM), gray-level size zone matrix (GLSZM), and adjacent gray-level difference matrix (AGTDM). The algorithms used feature extraction mainly referenced the Image Biomarker Standardization Initiative. 21 This study focused on texture analysis and did not include shape features. All extracted features were normalized by Z-score to achieve intensity standardization, ensuring that features from different ROIs could be compared on the same scale.
Radiomics feature screening
Lasso regression offers several advantages for feature selection, especially in high-dimensional datasets. It combines feature selection and regularization by shrinking less important feature coefficients to zero, which helps prevent overfitting and enhances model interpretability.22–23 Lasso is particularly effective in handling multicollinearity by selecting one variable from among correlated features, making it superior to traditional methods such as Pearson correlation or t-tests. 24 Therefore, Lasso regression was used as the main method for feature dimension reduction and selection. In the R-4.3.2 software environment, Lasso regression was performed using the “glmnet” package, compressing non-important feature coefficients to zero by introducing an absolute value function as a penalty term, while minimizing the mean square error. In addition, the variance inflation factor (VIF) was calculated to evaluate the multicollinearity problem of the selected features in the multiple regression model, and features with VIF values >5 were removed to reduce the impact of multicollinearity. The specific screening process included: feature variable standardization, generating a sequence of candidate values for the regularization parameter λ, executing five-fold cross-validation to determine the optimal λ value, screening non-zero coefficients and features with VIF ≤ 5, and finally using the optimal λ value to predict the original feature matrix to determine the key radiomics features for Radscore calculation.
Radscore calculation
Radscore is a comprehensive assessment index that incorporates multiple radiomics features into a single value. This value reflects the biological characteristics, prognosis, and potential treatment response of tumors or lesions. The Radscore calculation is based on the following formula:

Model Construction and Validation
Based on the calculated Radscore values, we randomly divided the samples into 70% train data and 30% test data. Utilizing R-4.3.2 software, we built binary classification models employing five distinct machine learning techniques: Support Vector Machine (SVM), Random Forest (RF), Extreme Gradient Boosting (XGBoost), K-Nearest Neighbors (KNN), and Decision Tree (DT). The efficacy of these predictive models was meticulously assessed and juxtaposed through metrics such as the Area Under the Curve (AUC), Sensitivity, Accuracy, Specificity, F1 Score, and Matthews Correlation Coefficient (MCC).
The specific training parameters for the five machine learning models are detailed below:
The Support Vector Machine (SVM) model employed a Radial Basis Function (RBF) kernel with hyperparameter optimization through grid search and Bayesian optimization. The final parameters included a cost value of 0.0136 and an RBF sigma value of 0.0426. The dataset was divided into 70% train data and 30% test data, with stratified sampling used to maintain balanced representation. The model was validated using 5-fold cross-validation. The Random Forest model was implemented by tuning key hyperparameters, including the number of trees (ranging from 200 to 500), the number of variables sampled at each split, and the terminal node size. The final model used 200 trees and a minimum node size of 50. The dataset was split using a 70/30 train-to-test ratio, with stratified sampling employed to maintain balanced representation. The model was then validated using 5-fold cross-validation. The XGBoost model's architecture included key hyperparameters such as mtry (number of features at each split), trees (boosting rounds), min_n (minimum samples required to split), tree_depth, learn_rate, loss_reduction, and sample_size. These parameters were tuned through grid search and Latin hypercube sampling, resulting in optimal values of mtry = 3, min_n = 8, tree_depth = 2, and learn_rate = 0.00212. The data was split 70% train and 30% test data with stratified sampling, and validated using 5-fold cross-validation. The K-Nearest Neighbors (KNN) model was optimized by tuning hyperparameters, including the number of neighbors (k), which was varied between 3 and 11, and various weighting functions such as biweight, cosine, and epanechnikov. The distance metric used was Euclidean, and tuning was conducted using 5-fold cross-validation, followed by grid search and Bayesian optimization. The best-performing model used 15 neighbors along with the epanechnikov kernel. The Decision Tree model was optimized by tuning parameters such as tree depth, minimum samples per split, and cost complexity for pruning. The optimal parameters were tree depth = 7, minimum samples = 16, and cost complexity = 0.00224.
To further substantiate the classification prowess of the models developed by the aforementioned algorithms, calibration curves and Decision Curve Analysis (DCA) were plotted. To determine whether there are statistical differences in the AUC values between the train data and test data of various models, this study employed the Delong test to compare the AUCs of five classification models. The Delong test outputs a P value, which indicates whether the observed difference between two AUCs could be attributed to random error alone. If the P value is < .05, the null hypothesis (stating that there is no difference in performance between the two classifiers) can be rejected. It is therefore considered that the performance difference between the two classifiers is significant.
Statistical Analyses
In this study, the R-4.3.2 software is used to construct the two classification model by using five machine learning models, including SVM, XGBoost, KNN, RF and DT. In order to comprehensively and accurately evaluate the performance of the model, AUC, sensitivity, accuracy, specificity, F1 score and MCC were selected as the evaluation indicators of the model performance. In addition, chi square test was used to analyze the pathological data in the clinical baseline indicators of patients in the train data and the test data, and t test was used to analyze the significance of the remaining continuous variables (P < .05 means there is a statistical difference). The Delong test is used to compare the AUC difference of the same model between the train data and the test data. If the p value is less than 0.05, it indicates that there is a significant difference in the AUC of the model between the train data and the test data.
Results
Baseline Characteristics
The baseline characteristics of patients are shown in Table 1. We randomly divided the 117-patient dataset into a 70:30 train-to-test ratio for model development and evaluation. The average age was similar in both sets (53.5 ± 8.1 years in the train data and 52.4 ± 8.4 years in the test data). The proportion of patients with pathological grade II was 59.3% in the train data and 61.1% in the test data. The Radscore values were −0.9 ± 1.3 and −1.2 ± 1.2 in the train and test data, respectively. However, there was no significant difference in baseline characteristics between the two sets.
Baseline Characteristics

Feature Screening
Radiomics features were extracted from GTV and normal cervical tissue (Figure 1) with a total of 930 features successfully extracted. Through Lasso regression analysis, we screened these features and ultimately retained 30 features with non-zero coefficients. The model's bias was minimized when the minimum value of λ was 0.013 (Figure 2).

ROI of cervical cancer (the red part is GTV, and the green part is normal cervical tissue).

A is a five-fold cross-validation diagram for selecting the minimum criterion in the Lasso model. The vertical line on the left represents the optimal value of the Lasso tuning parameter (λ), and the dashed line on the right represents the maximum λ value within one standard deviation of the average error. B is a distribution diagram of Lasso coefficients for different logarithms (λ).
After screening, the Variance Inflation Factor (VIF) of the independent variables in the Lasso regression model was calculated. After Lasso logistic regression analysis, variables with a VIF > 5 were removed to eliminate features that could lead to overfitting due to high multicollinearity, until the logistic model converged. A total of 18 imaging features were retained, all with a VIF < 5, indicating that there is no multicollinearity among the 18 imaging features (Table 2). The Radscore was calculated based on the 18 selected features after screening.
18 Selected Radiomics Features and Their VIF Values.

Model Construction
The Radscore was used to construct binary classification models based on SVM, RF, XGBoost, KNN, and DT algorithms. The ROC curves of the models are shown in Figure 3. The calibration curves and decision curves for the test data are presented in Figures 4 and 5, respectively. The AUC values, sensitivity, accuracy, specificity, F1 scores, and MCC of the classification models for the train and test data of the five models are shown in Table 3. The results of the DeLong test are shown in Table 4. For the test data, the AUC of all five models ranged from 0.8866 to 0.9190, and all values exceeded 0.8. Notably, the XGBoost model achieved an AUC of 0.8737 (95% CI: 0.8198-0.9277) in the train data and 0.9190 (95% CI: 0.8525-0.9854) in the test data. The results show that the P values for all five classification models are > 0.05, indicating no significant difference in classification performance between the train and test data, thereby verifying the stability and reliability of these models.

ROC curves of five classification models, A-E were SVM, RF, KNN, XGBoost, and DT.

Calibration curves of five classification models, A-E were SVM, RF, KNN, XGBoost, and DT.

Decision curves of five classification models, A-E were SVM, RF, KNN, XGBoost, and DT respectively.
AUC, Sensitivity, Accuracy, Specificity, F1 Score, and MCC for Train Data and Test Data in SVM, RF, KNN, DT, and XGBoost Models.

CI of AUC Values and Delong Test Results for Train Data and Test Data in SVM, RF, KNN, DT, and XGBoost Models.

Discussion
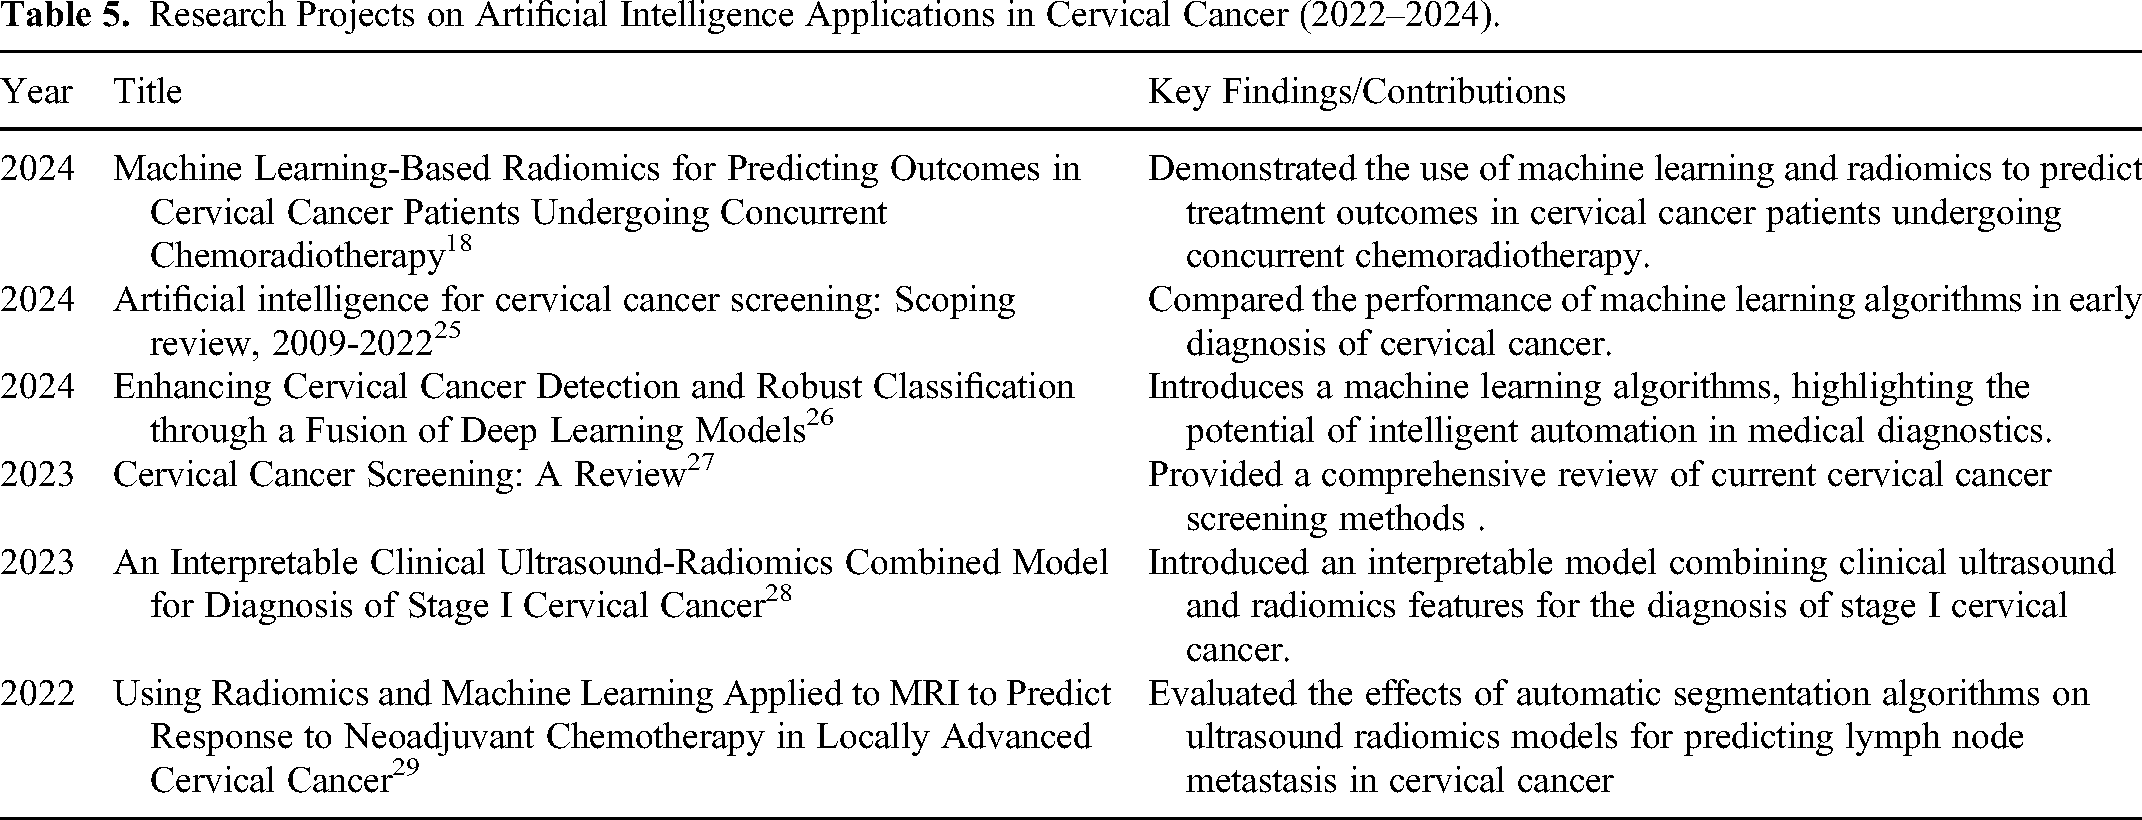
Radiotherapy has long been the standard treatment for cervical cancer. In recent years, most studies on artificial intelligence of cervical cancer have focused in the direction of early diagnosis and efficacy prediction (Table 5). However, achieving accurate classification and recognition of tumor targets and organs at risk of cervical cancer continues to be a significant challenge in radiotherapy. This study successfully constructed a model for classifying cervical cancer tumor tissue and normal tissue using CT radiomics combined with machine learning algorithms. The models achieved excellent performance in the test data, with AUC values ranging from 0.8866 to 0.9190 (all exceeding 0.8). In terms of sensitivity, the values of all models fall within the range of 0.8770 to 0.9170, indicating a high ability to correctly identify cancer cases. With regard to accuracy, the performance of all models was stable between 0.7920 and 0.8060. For specificity, the values of all models ranged from 0.6670 to 0.6940. In terms of F1 score, the scores of all models are between 0.8000 and 0.8250. All these parameters fully show that these models have excellent comprehensive performance. In addition, the MCC values of the five models were between 0.57 and 0.7070, which indicates a strong positive correlation between the predicted results and the actual results of the five classification models. Therefore, it is feasible to apply CT-based imaging methods to the classification of cervical cancer GTV and normal uterus.
Research Projects on Artificial Intelligence Applications in Cervical Cancer (2022–2024).
First, the application of radiomics technology has provided a new perspective for the diagnosis of cervical cancer. Traditional diagnostic methods rely on the experience and subjective judgment of physicians, whereas radiomics can extract a multitude of quantitative features from CT images, offering a new means of assessing tumor heterogeneity. 30 The use of this technology not only reduces human bias but also enhances diagnostic precision. 28
Second, the introduction of machine learning algorithms has further enhanced the model's classification capabilities.31,32,33 In this study, we employed five distinct machine-learning techniques, including SVM, RF, KNN, XGBoost, and DT. KNN is relatively simple and intuitive, relying on proximity for classification. However, it can struggle with feature selection in high-dimensional spaces and is computationally intensive during the prediction phase. 34 DT models offer a straightforward approach with inherent interpretability, making feature selection easy to visualize; however, they are prone to overfitting and may not perform well on small or noisy datasets without pruning techniques. 35 In contrast, SVM excels in high-dimensional spaces and is effective at finding the optimal hyperplane for classification tasks, making it a reliable choice for radiomics. 36 Nonetheless, it can be computationally expensive, particularly with large datasets. 37 RF provides robust feature selection through its ensemble of DTs, offering resistance to overfitting and better interpretability of the selected features. However, its complexity can lead to longer training times. 38 XGBoost is known for its efficiency and high predictive power, 39 especially in handling sparse and unbalanced datasets; however, it often requires careful tuning of hyperparameters to avoid overfitting and ensure optimal performance. 40 XGBoost leverages a gradient boosting framework that sequentially builds models, typically DTs, each model improving on the errors of the previous ones. This approach is highly effective for minimizing loss functions, making it suitable for handling imbalanced datasets and enhancing predictive accuracy.40–41 A significant advantage of XGBoost is its use of L1 (Lasso) and L2 (Ridge) regularization, which helps prevents overfitting, ensuring a balance between simplicity and generalization.21–22 XGBoost excels at handling sparse data, which is common in real-world applications like medical diagnostics, as it manages missing values and improves robustness and efficiency. 42 Its scalability and parallel processing capabilities allow for the rapid processing of large datasets, such as those in medical imaging, making it highly efficient for vast data analyses. 40 The XGBoost model was selected as the optimal model due to its high AUC values in both the train and test data. The AUC value of the XGBoost model in the test data reached 0.9190, which is particularly important in medical image analysis.43,44,45,26
Moreover, the feature selection process using Lasso regression analysis was a crucial step in this study. Through Lasso regression analysis, we screened 930 features and ultimately retained 18 key features with non-zero coefficients, indicating their significant impact on the classification results. This process not only improved the model's interpretability but also reduced its complexity, facilitating rapid and accurate classification in practical applications.
However, this study also had some limitations. The relatively small sample size might affect the model's generalization. Future studies should validate the model on a larger sample size to confirm its stability and reliability. Additionally, this study focused solely on CT images for analysis, excluding other potentially valuable clinical information, such as the patient's age and medical history. Future studies could consider incorporating these factors into the model to enhance the comprehensiveness of the diagnosis.
Furthermore, despite the excellent performance of the XGBoost model in this study, the interpretability of machine learning models remains a challenge. In clinical applications, physicians and patients may need to understand the model's decision-making process to facilitate trust in the diagnostic results. Therefore, future research should explore methods to improve the transparency and interpretability of models.
Lastly, the conclusions of this study need to be verified in a broader clinical setting. Although the model showed good performance in both the train and test data, it may face different challenges in practical application, such as differences in image quality and the impact of different devices.46,47 Therefore, future research should test and optimize the model in a multicenter, multi-device environment.
Conclusion
This study demonstrates the potential of machine learning models based on CT radiomics in the diagnosis of cervical cancer. With further research and validation, this approach is expected to become an important tool in the diagnosis and treatment planning of cervical cancer. Our future work will focus on expanding the sample size, integrating multi-source data, improving the model's interpretability, and conducting model validation in a broader clinical context.
Footnotes
Abbreviations
Author Contribution
Huai-wen Zhang, Jinghong Pei and Hao-wen Pang conceived of the presented idea. Huai-wen Zhang and Hao-wen Pang collected the planning data of all patients in this study. Huai-wen Zhang, Jinghong Pei and Hao-wen Pang took the lead in writing the manuscript. All authors provided critical feed-back and helped shape the research, analysis, and manuscript.
Availability of Data and Materials
All data generated and analyzed during this study are included in this published article.
Consent for Publication
Consent for publication is not applicable in this study, because there is not any individual person's data.
Declaration of Conflicting Interests
The authors declared no potential conflicts of interest with respect to the research, authorship, and/or publication of this article.
Ethics Approval and Consent to Participate
This retrospective study was approved by the ethics committee of Jiangxi Cancer Hospital([2024-04-26] 2024ky057)& Second People's Hospital of Jingdezhen([2024-1-10] 2024-LLLW-06). Due to the retrospective nature of this study, the ethics committee of the two hospitals waived the informed consent of the patients and confirmed compliance with the Declaration of Helsinki and the confidentiality of the patient data.
Funding
The authors disclosed receipt of the following financial support for the research, authorship, and/or publication of this article: This work was supported by the Science and technology plan of Jingdezhen Health Commission, The Xuyong County People's Hospital- Southwest Medical University Science and Technology Strategic Cooperation Project, The Open Fund for Scientific Research of Jiangxi Cancer Hospital, Science and technology plan of Jiangxi Provincial Health Commission, the Gulin County People's Hospital-The Affiliated Hospital of Southwest Medical University Science and Technology Strategic Cooperation Project, (grant number 20231SFZC076, 2024XYXNYD05, 2021J15, 202310876, 2022GLXNYDFY05).