
Abstract
Objective
We investigated the potential of dual-energy computed tomography (DECT) radiomics in assessing cancer-associated fibroblasts in clear cell renal carcinoma (ccRCC).
Methods
A retrospective analysis was conducted on 132 patients with ccRCC. The arterial and venous phase iodine-based material decomposition images (IMDIs), virtual non-contrast images, 70 keV, 100 keV, and 150 keV virtual monoenergetic images, and mixed energy images (MEIs) were obtained from the DECT datasets. On the Radcloud platform, radiomics feature extraction, feature selection, and model establishment were performed. Seven radiomics models were established using the support vector machine. The predictive performance was evaluated by utilizing receiver operating characteristic and the area under the curve (AUC) was calculated. Nomograms were constructed.
Results
The combined model demonstrated high efficiency in evaluating pseudocapsule thickness with AUC, specificity, and sensitivity of 0.833, 0.870, and 0.750, respectively in the validation set, surpassing those of other models. The precision, F1-score, and Youden index were also higher for the combined model. For evaluating the number of collagen fibers, the combined model exhibited the highest AUC (0.741) among all models, with a specificity of 0.830 and a sensitivity of 0.330. The AUC in the 150 kv model and IMDI model were slightly lower than those in the combined model (0.728 and 0.710, respectively), with corresponding sensitivity and specificity of 0.560/0.780 and 0.670/0.830. The nomogram exhibited that Rad-score had good prediction efficiency.
Conclusion
DECT radiomics features have significant value in evaluating the interstitial fibers of ccRCC. The combined model of IMDI + MEI exhibits superior performance in assessing the thickness of the pseudocapsule, while the combined, 150 keV, and IMDI models demonstrate higher efficacy in evaluating collagen fiber number. Radiomics, combined with imaging features and clinical features, has excellent predictive performance. These findings offer crucial support for the clinical diagnosis, treatment, and prognosis of ccRCC and provide valuable insights into the application of DECT.
Introduction
Renal cell carcinoma (RCC) is the most prevalent renal malignant neoplasm of the kidneys worldwide, with an estimated 400 000 new cases diagnosed annually and approximately 175 000 deaths.1 The use of imaging has increased the detection of early-stage patients. Clear cell renal carcinoma (ccRCC), which accounts for 70%-80% of all RCCs,2 has the worst prognosis.3
Like other tumors, the development of RCC is a complex process that involves the interplay between tumor cells and the tumor microenvironment (TME). Cancer-associated fibroblasts play a pivotal role in TME and participate in tumorigenesis, development, invasion, and metastasis of tumors.4 Activated fibroblasts generate abundant collagen fibers to form dense fibrosis around cancer cells, which in turn, facilitates cancer cell invasion via fiber contraction.5 It has been shown that the abundance of collagen fibers in ccRCC is higher than in paracancerous tissue.6 Furthermore, the pathological grade of the former is higher in the high collagen fiber group compared to the low collagen fiber group, and the 5-year survival rate is lower in the former. The pseudocapsule of RCC is composed of collagen fibers and smooth muscle bundles. Compared to non-clear cell carcinomas, the pseudocapsule of ccRCC exhibits greater stiffness, thickness, and density of collagen fibers.7 A thicker pseudocapsule results in less tumor infiltration8 and pseudocapsule invasion, which is associated with higher grade and stage of tumors.9 The number of collagen fibers and the thickness of the pseudocapsule in ccRCC have a significant impact on the treatment and prognosis of renal carcinoma.
Computed tomography (CT) is an important and widely used means for detecting RCC. Dual-energy computed tomography (DECT) provides excellent tissue specificity and reveals the morphology and microscopic characteristics of lesions while overcoming some of the limitations of conventional CT.10 The force DECT system has a quick imaging speed, low radiation dosage, and high image quality, and it also enables the creation of iodine-based material decomposition images (IMDIs), virtual non-contrast (VNC) images, and virtual monoenergetic images (VMI).11 Previous studies on the assessment of matrix fibers using DECT have predominantly focused on hepatic fibrosis and cirrhosis.12 Conversely, few studies have evaluated the interstitial fibers in RCC, especially ccRCC. Radiomics is an emerging imaging technology that involves extracting an extensive volume of data from medical images (eg, CT, MRI, and PET) in an efficient, high-throughput manner. This encompasses the analysis of image data within a region of interest (ROI) and transforming it into quantitative data for lesion feature extraction and model establishment.13 Radiomics offers the advantage of non-invasiveness and is useful in evaluating various aspects of tumors and TME, including spatial heterogeneity and disease progression, or as a novel method for TME assessment. Herein, we investigated the capacity of DECT radiomics models in evaluating the pseudocapsule thickness and collagen fiber quantity in ccRCC. Our findings may offer evidence for the clinical diagnosis, treatment, and prognosis of ccRCC.
Materials and Methods
Study Participants
This is a retrospective study. Patients who underwent radical or partial nephrectomy for renal carcinoma and were pathologically diagnosed with ccRCC postoperatively between January 2015 and January 2022 were enrolled. They all underwent Force DECT-enhanced CT scans. Inclusion criteria: (a) patients who underwent radical or partial nephrectomy and were pathologically diagnosed with ccRCC; (b) patients who underwent DECT scans of the kidney 1 week before surgery; and (c) patients with complete imaging and clinical data. Exclusion criteria: (a) patients who received preoperative radiotherapy and chemotherapy; (b) patients with a history of other abdominal operations; and (c) patients with cystic renal carcinoma with fewer solid components. The Ethics Committee waived the requirement for the patient's informed consent for the study due to the retrospective nature of the study and the anonymous nature of patient information. This study was approved by the Ethics Committee of Jinan Central Hospital (Jinan, China) (ethics approval number: 2023-012-01) (date: Jan 16, 2023). The reporting of this study conforms to TRIPOD guidelines.14
Specimen Processing and Pathological Image Analysis
The ccRCC tissues were fixed in 10% formalin and subsequently embedded in paraffin. The resulting tissue blocks were sectioned into continuous 4 µm sections for Masson staining. The images were analyzed by two pathologists with over 5 years of experience using a light microscope. A semi-quantitative analysis of both the pseudocapsule and collagen fibers was conducted. The pseudocapsule was classified as thinness if it measured less than half of the visual field (x 100); otherwise, it was classified as thickness. In the hotspot for collagen fibers, the coverage area was designated as small if it occupied less than half of the visual field (x 100), and as large if it exceeded this threshold (Figure 1).
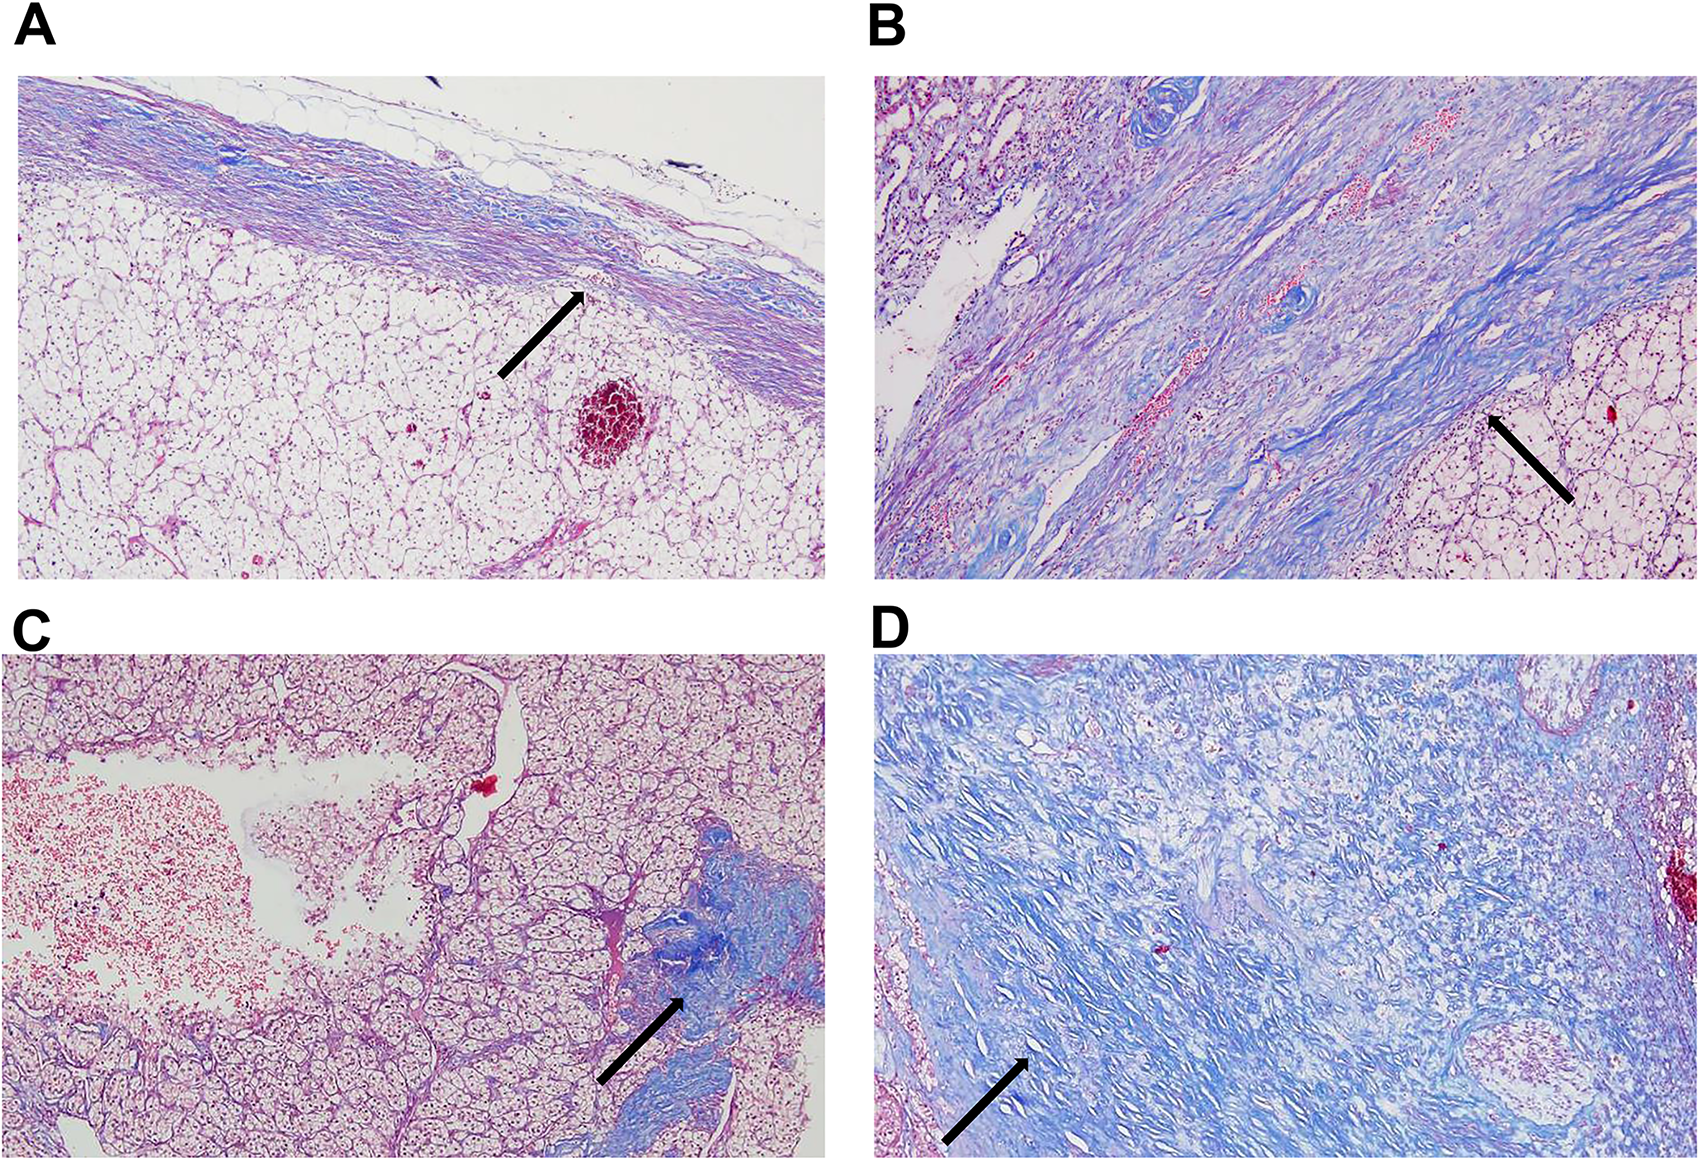
Masson staining of pseudocapsule and collagen fibers (×100). Collagen fibers are stained blue(arrow). (A) Thin pseudocapsule. (B) Thick pseudocapsule. (C) A small amount of collagen fibers. (D) A large amount of collagen fibers.
CT Scanning
The Force CT (Somatom Force, Somatom Flash dual-source CT, Siemens, Germany) was used to perform the scan. Patients were instructed to hold their breath, fast for 4 hours before the procedure, and drink 500 ml of warm water before the scan. The non-ionic intravenous contrast (300 mg iodine/ml) was administered to all patients at a flow rate of 3.5 ml/sec, based on their weight (1.2 mL/kg body weight). The delay time of arterial phase (renal cortical phase) and venous phase (renal medullary phase) was 30 and 80 s, respectively. Additionally, the dual-energy mode and automatic exposure system were utilized with tube voltages of 100 kVp and Sn150 kVp, and tube currents of 130-180 mAs and 80-90 mAs, respectively.
DECT Image Processing
The IMDI, VNC, 70KeV, 100KeV, 150KeV, and mixed energy images (MEIs) of arterial and venous phases were obtained using a processing workstation (Syngo via VB10, Siemens Healthineers, Germany) with slice thickness and spacing of 1.0 mm. All these images were uploaded onto the Radcloud platform (https://mics.huiyihuiying.com). Two radiologists with over 5 years of experience delineated the ROI at the maximum cross-section of the tumor. The outline encompassed the tumor boundary, necrotic areas, cystic changes, and bleeding (Figure 2).
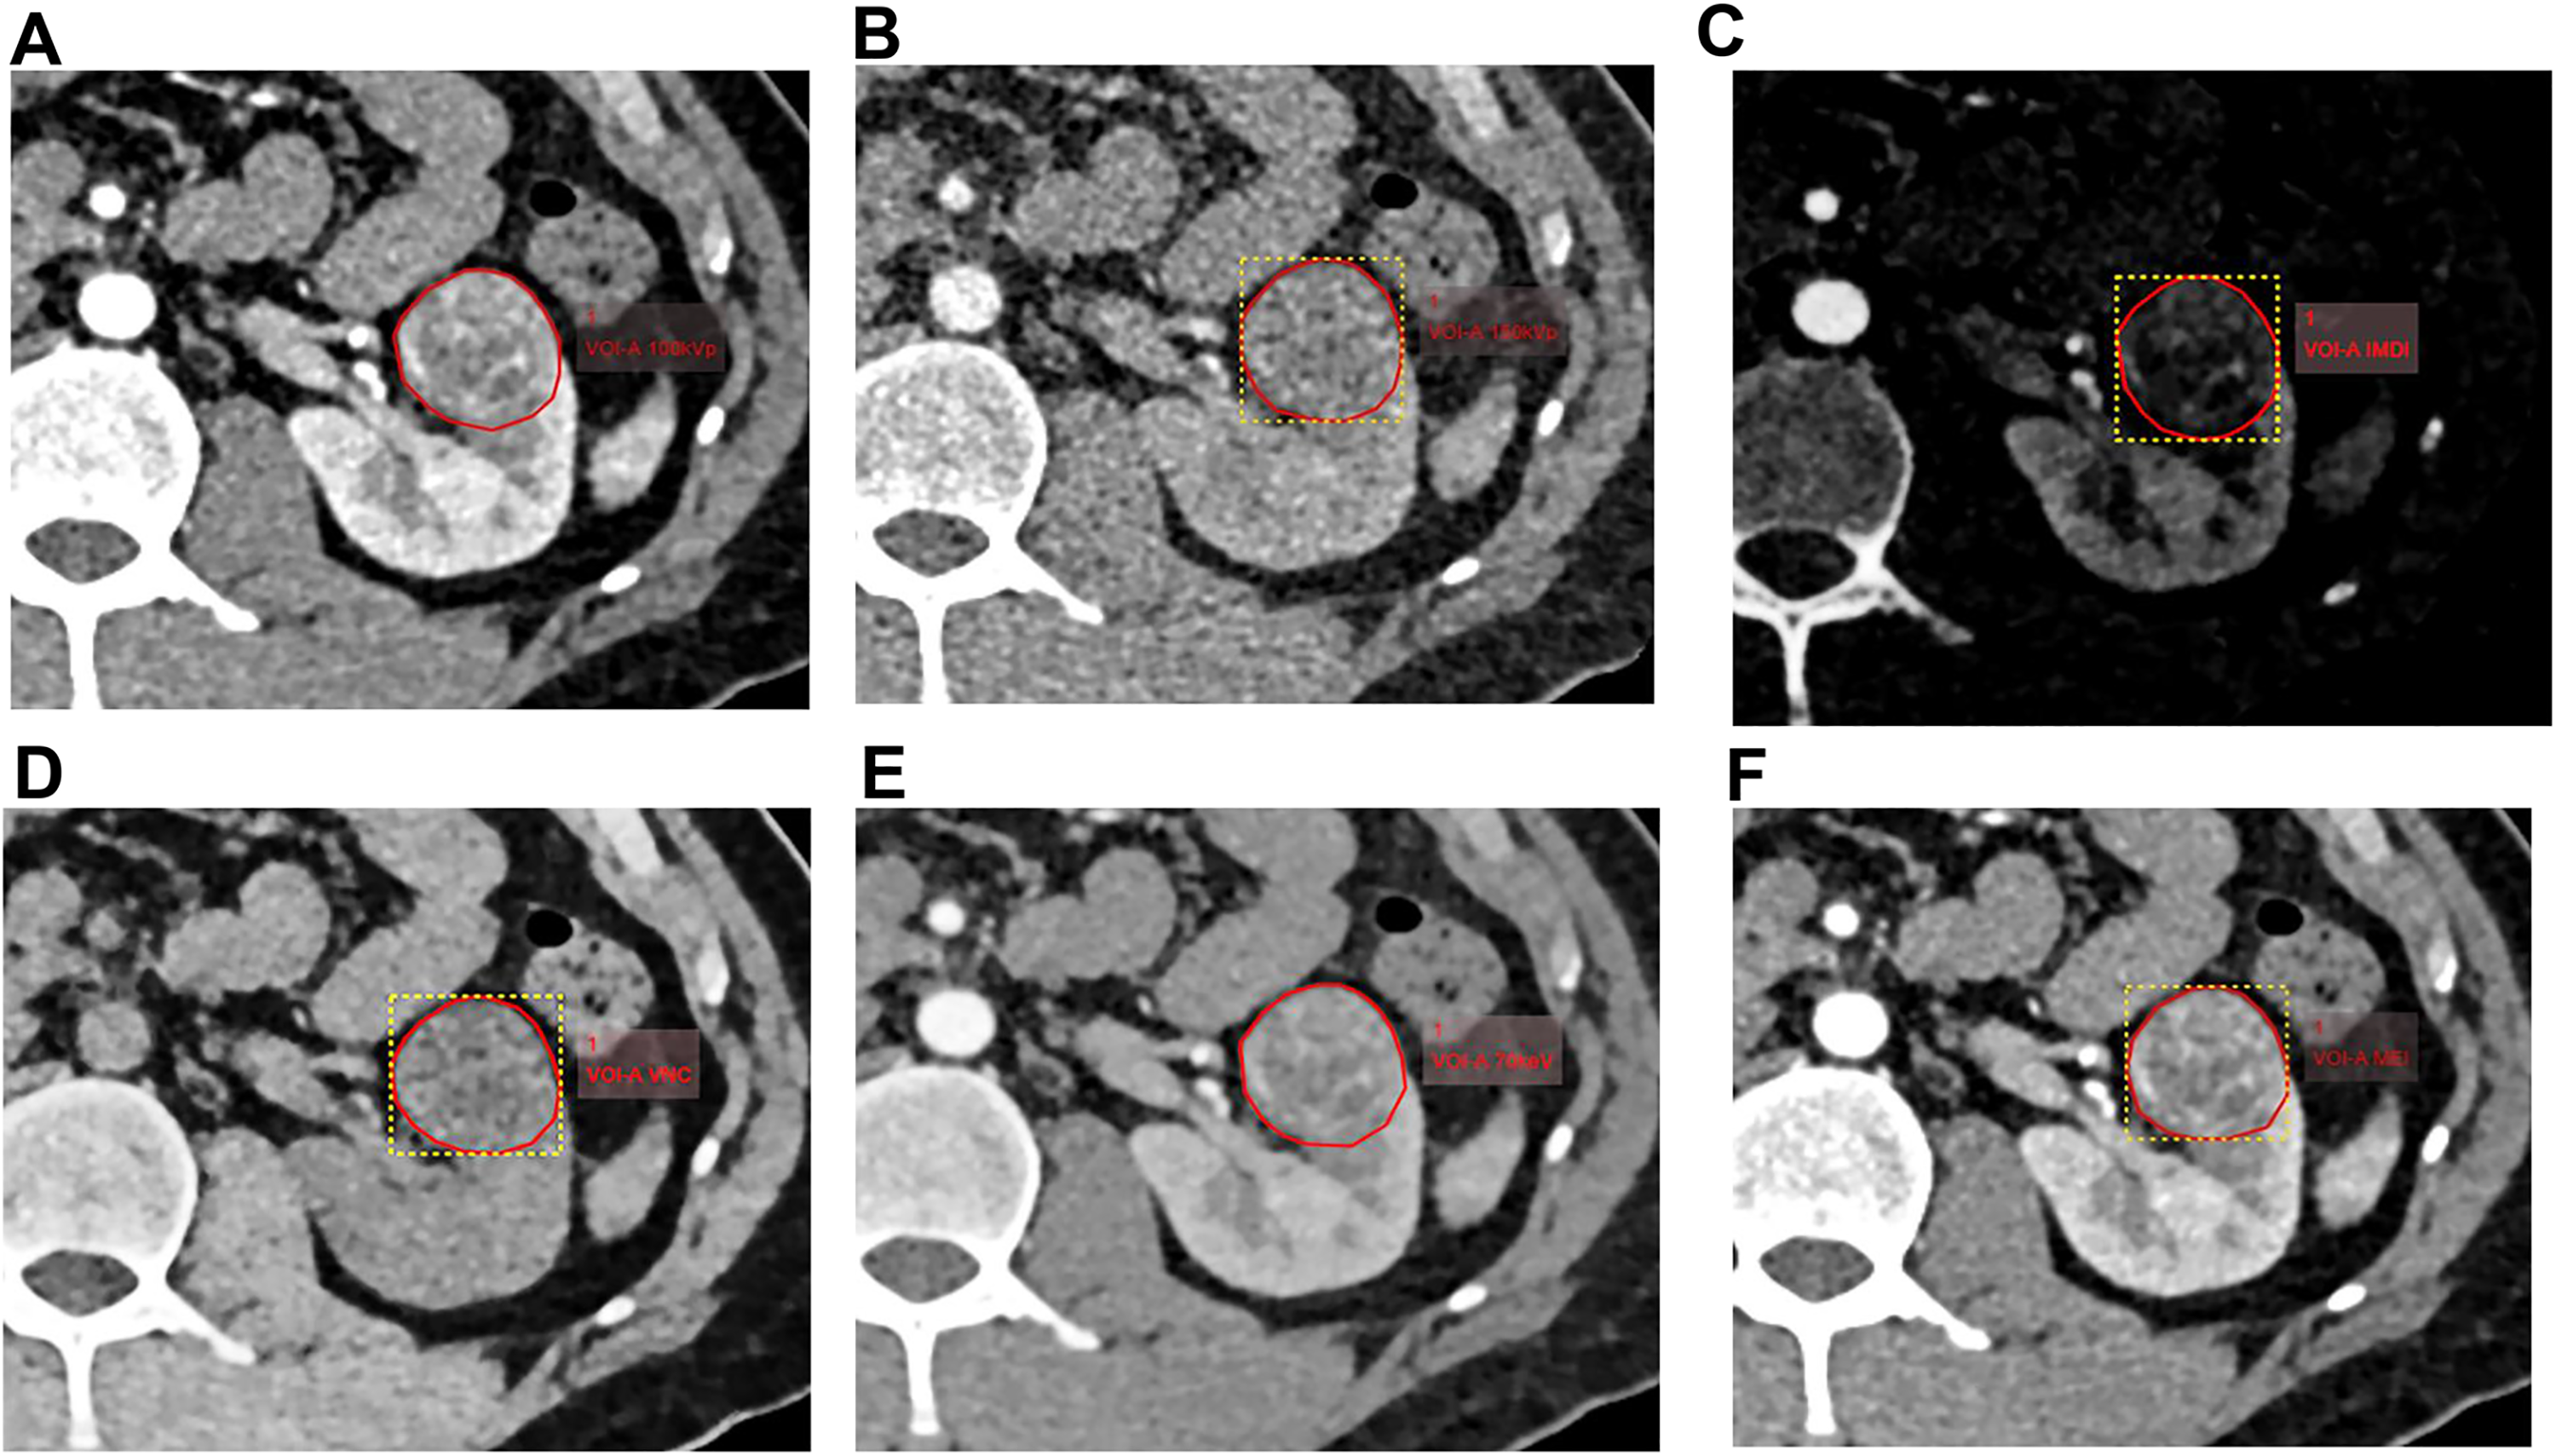
Delineation of ROI. The ROI was delineated for 100 keV (A), 150 keV (B), IMDI (C), VNC (D), 70 keV (E), and MEI (F), respectively, in the arterial phase of CT in a 42-years old man. CT, computed tomography
Radiomics Feature Extraction and Model Establishment
The Radcloud platform was used to carry out radiomics feature extraction, feature selection, and model establishment. To eliminate redundant features, we used feature selection methods including variance threshold, SelectKBest (P ≤ .05), and least absolute shrinkage and selection operator (LASSO). The radiomics score (Rad-score) was calculated by taking a linear combination of the selected radiomics features and multiplying them with their respective coefficients. The radiomics-based models were constructed using the support vector machine algorithm.
Seven radiomics models were established based on the selected features. These models included the 100 keV, 150 keV, IMDI, VNC, 70 keV, and MEI models, and a combined model of IMDI + MEI. The performance of these models was evaluated using the receiver operating characteristic (ROC) curves. The area under the curve (AUC), sensitivity, and specificity were calculated. The decision curve analysis was used to evaluate the net benefits of the different models. Nomograms were constructed based on the Rad-score of the most effective radiomics model and the clinical or imaging features with a P-value less than 0.2. These clinical and imaging features were screened using the Chi-square test.
Results
Baseline Data
A total of 132 patients (91 males and 41 females) with an average age of 57 ± 10.94 years (range: 33-82 years old) were enrolled in this study. Their baseline data are listed in Table 1. The patients were randomly divided into a validation set and a training set at a ratio of 3:7. Figure 3 illustrates the enrollment process. There were 77 cases with thick pseudocapsule and 55 cases with thin pseudocapsule. There were 90 cases with large amounts of collagen fibers and 42 cases with small amounts of collagen fibers.

Flowchart of patient enrollment.
Baseline Data of 1Patients.

The Radiomics Models for Predicting the Pseudocapsule Thickness
A total of 3776 and 7552 features were extracted from images of all patients for individual and combined models, respectively. After screening with the variance threshold method, SelectKbest method, and LASSO, we obtained 5, 5, 6, 5, 13, 4, and 7 optimal features for the 100 keV, 150 keV, IMDI, VNC, 70 keV, MEI, and IMDI + MEI combined model, respectively (Table 2). In the IMDI model, we first applied a variance threshold method to remove features with a threshold below 0.8 from the initial set of 3776 features, which generated 861 features (Figure 4A). We then used the SelectKBest method to eliminate any features with a P-value above .05, resulting in the identification of only eight relevant features (Figure 4B). Finally, by applying LASSO, we selected an optimal set of six features (Figure 4C). As for the combined model, we selected 1642 features using the variance threshold method (Figure 5A) and further narrowed them down to 99 features with SelectKbest (Figure 5B). Finally, we identified an optimized set of seven features using LASSO (Figure 5C).
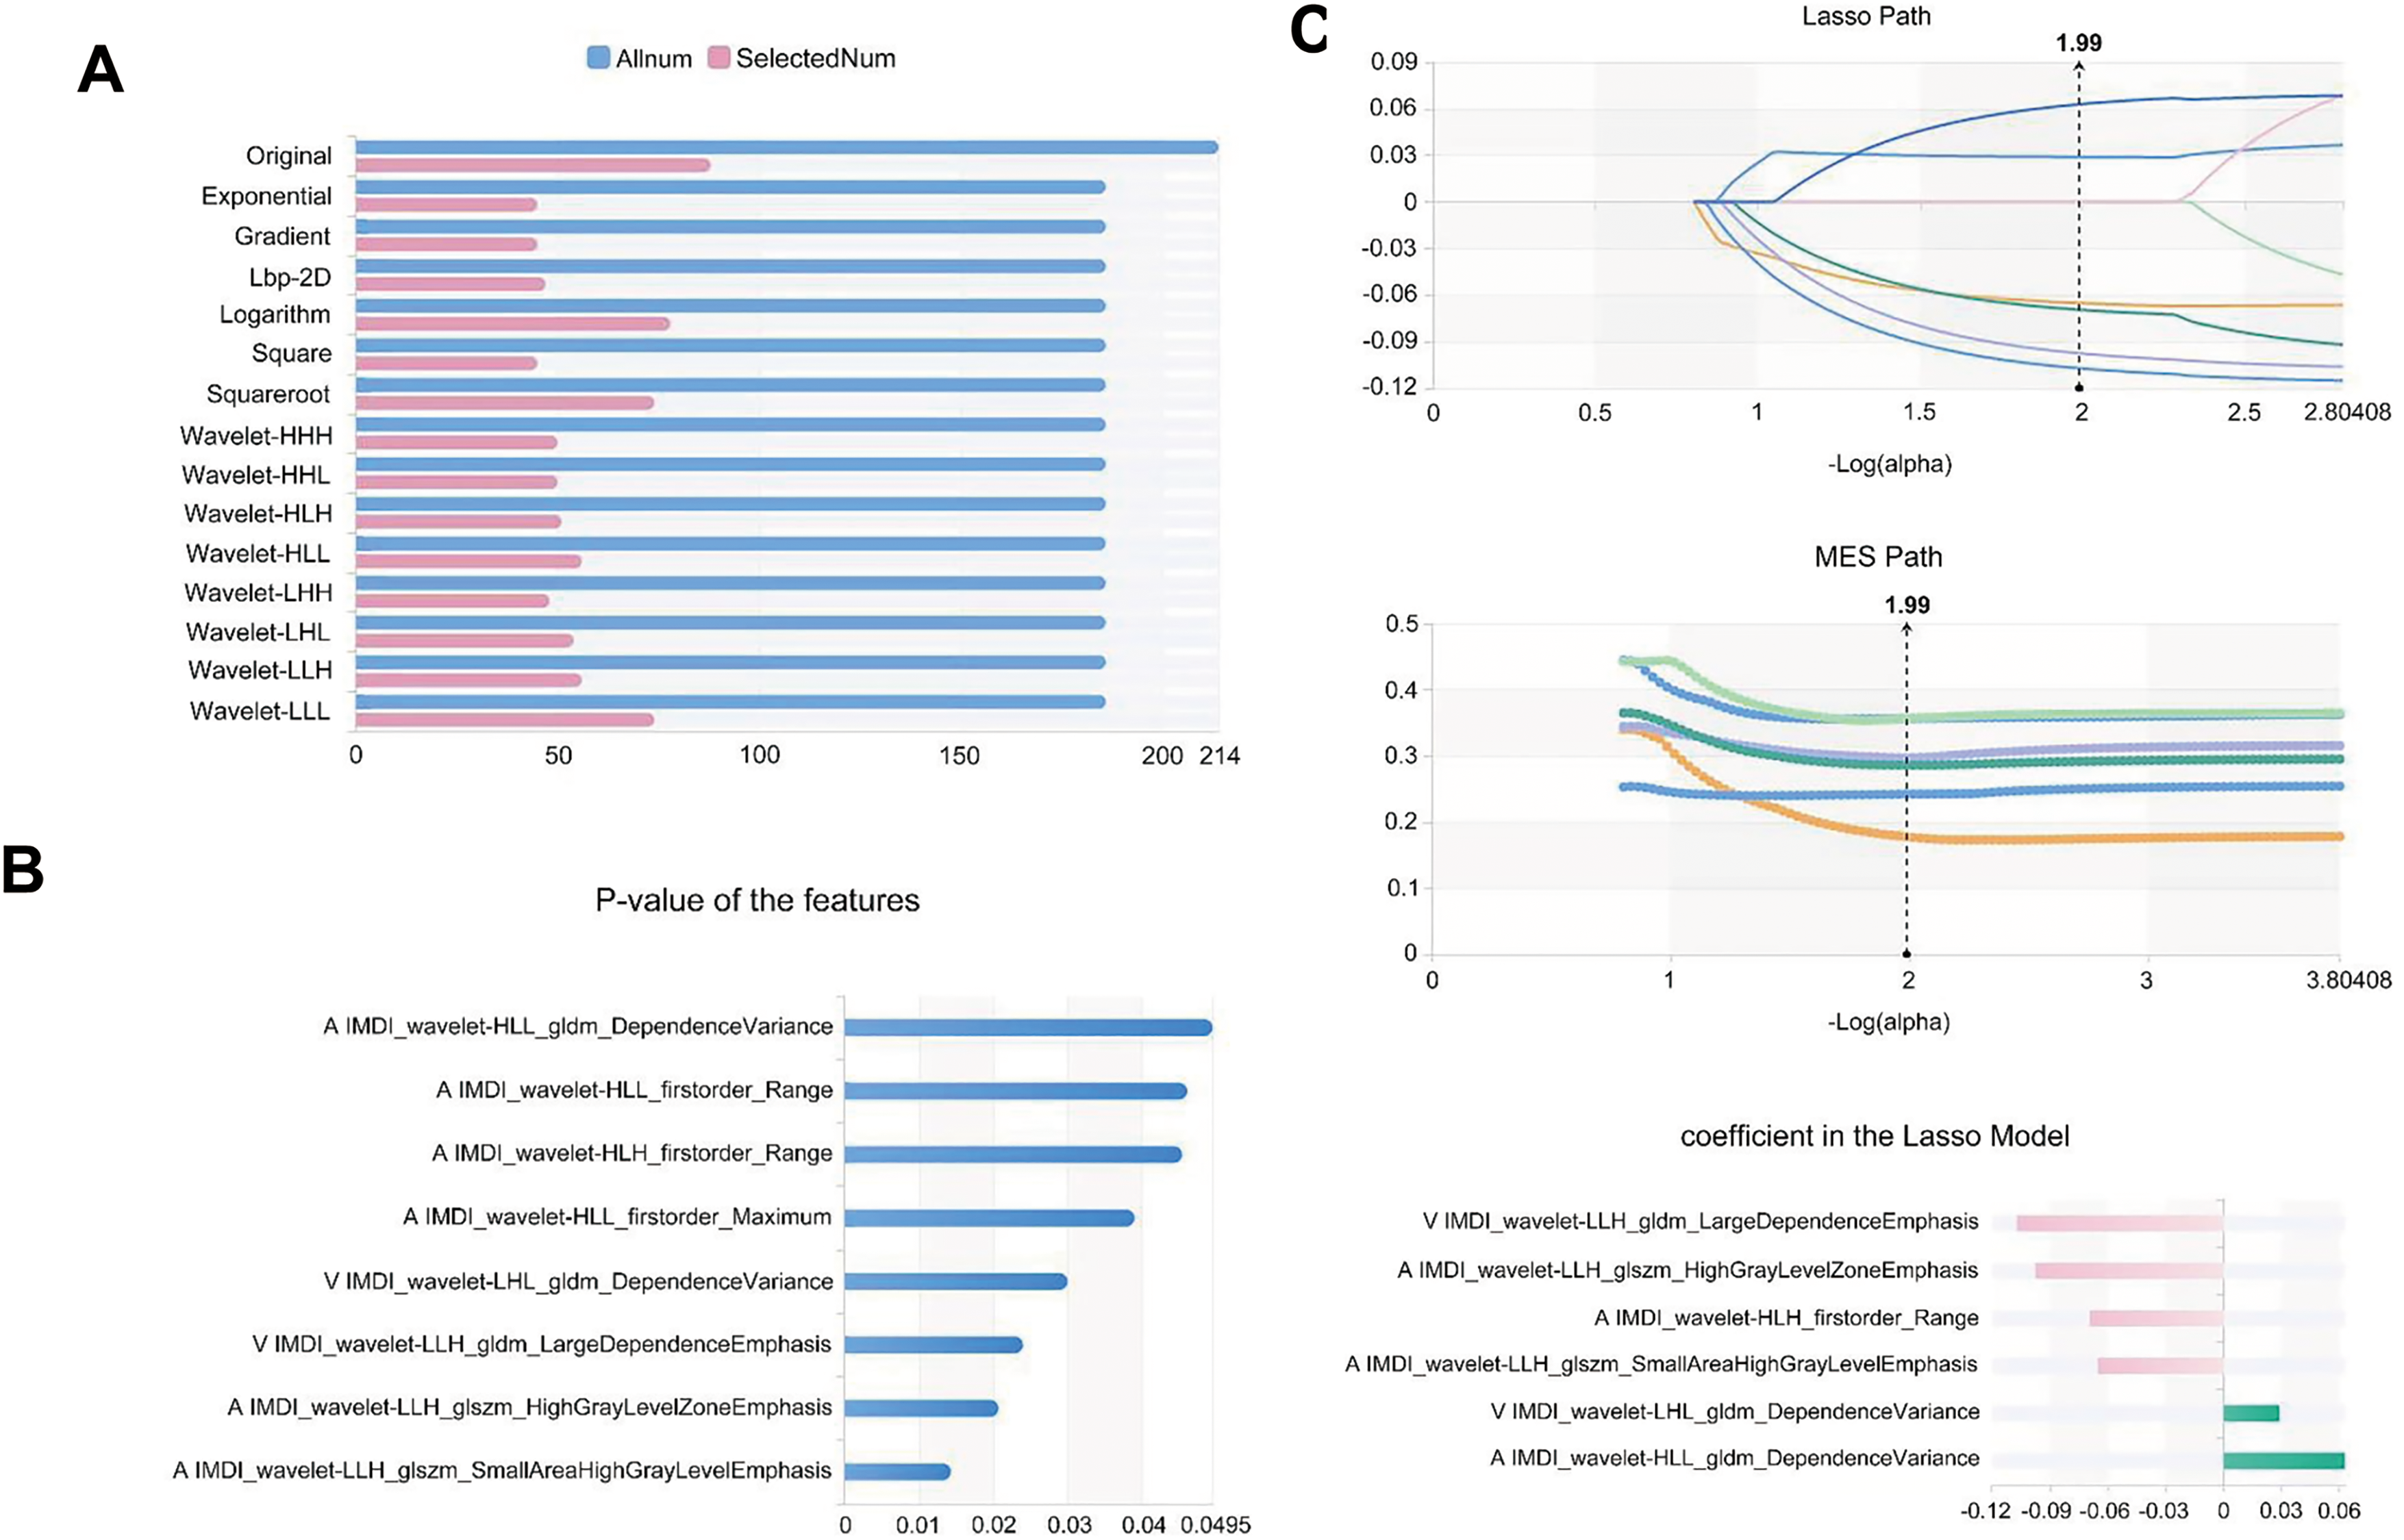
Feature selection of IMDI model for predicting the thickness of pseudocapsule. (A) Variance threshold method was used to select 861 features from 3776 features. (B) SelectKbest method selected eight features. (C) LASSO method selected 6 features. The Laso path, MSE path, and the coefficients in the Lass model were shown. LASSO, least absolute shrinkage and selection operator.
Feature selection of the combined model for predicting the thickness of pseudocapsule. (A) Variance threshold method was used to select 1642 features from 7552 features. (B) SelectKbest method selected 99 features. (C) LASSO method selected seven features. The Laso path, MSE path, and the coefficients in the Lass model were shown. LASSO, least absolute shrinkage and selection operator.
The Optimal Radiomic Features, Radiomic Classes and Filters of Each Model for Predicting the Pseudocapsule Thickness.

Note: IMDI, iodine-based material decomposition images; VNC, virtual non-contrast; MEI, mixed energy images.
The combined model demonstrated high efficacy in evaluating the pseudocapsule thickness in the validation set, with an AUC of 0.833, a specificity of 0.870, and a sensitivity of 0.750, which were all higher than those of the individual models (Table 3). Figure 6A-6G displays the AUC of each model in the validation set. Notably, the combined model exhibited higher precision (0.820), F1-score (0.780), and Youden index (0.620) compared to the individual models (Table 3). Nevertheless, all models had similar support degrees (Table 4). The decision curve analysis demonstrated a favorable net benefit of the combined model (Figure 7). The nomogram was constructed with the nuclear grading, tumor maximum diameter greater than 4 cm, abdominal pain, urinary occult blood, and Rad-score of the combined model (Figure 8).
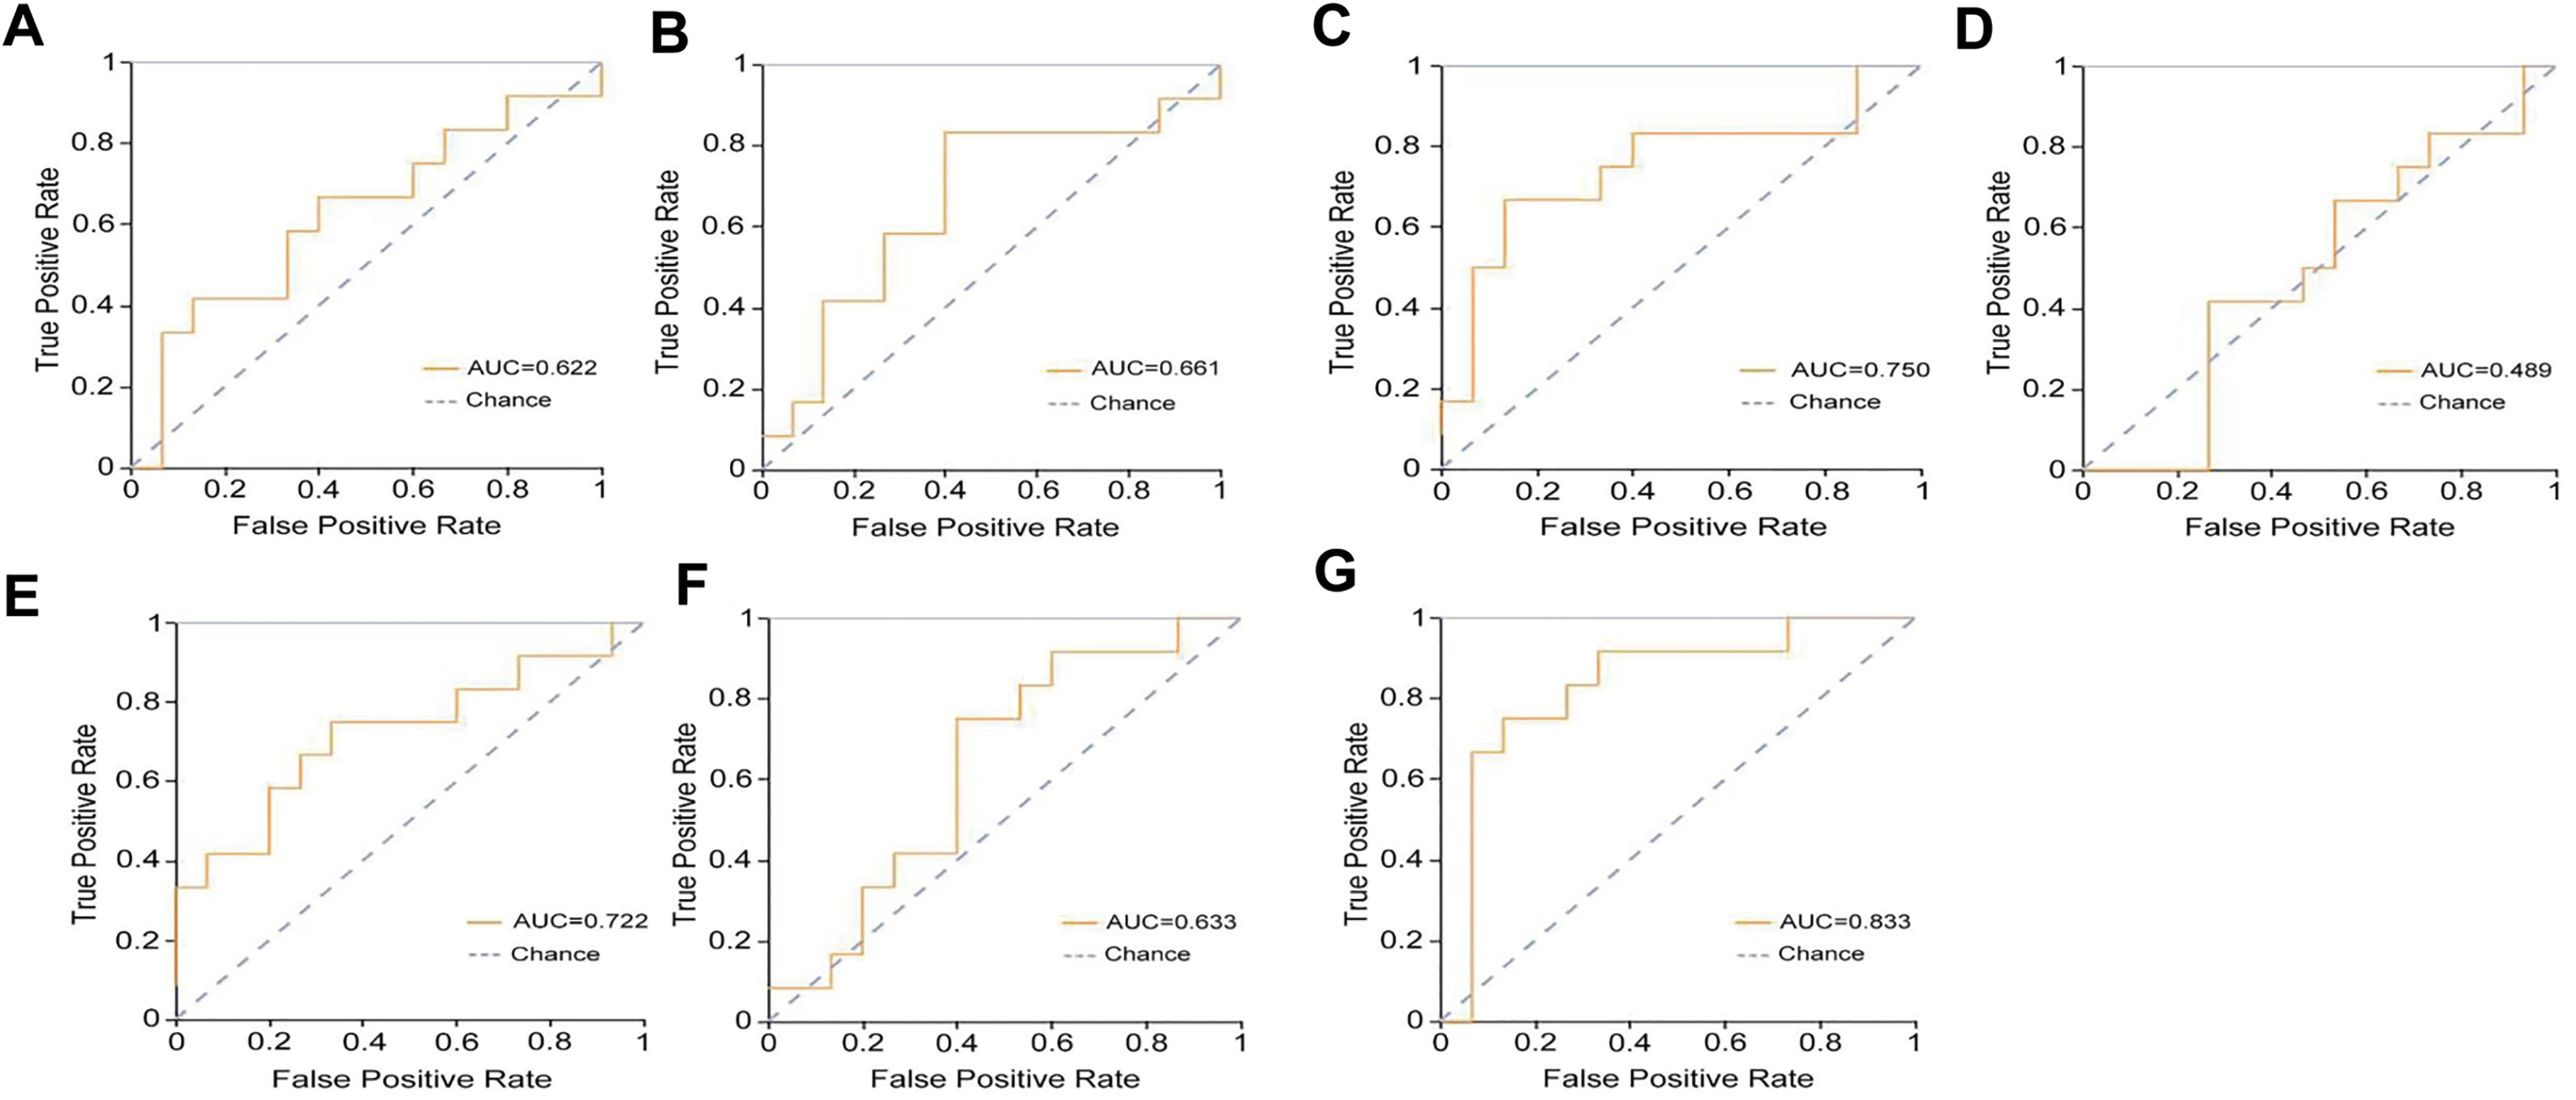
The ROC analysis. The ROC curves of the 100 keV (A), 150 keV (B), IMDI (C), VNC (D), 70 keV (E), MEI (F) and combined model (G) in predicting the thickness of pseudocapsule. The AUC of each model was indicated.

The decision curve analysis of the models for predicting the thickness of pseudocapsule in the validation set.

The nomogram for predicting the thickness of pseudocapsule.
The AUC, 95%CI, Sensitivity and Specificity of Each Model for Predicting the Pseudocapsule Thickness in the Validation set.

Note: AUC, area under the curve; 95%CI, 95% confidence interval; IMDI, iodine-based material decomposition images; VNC, virtual non-contrast; MEI, mixed energy images.
The Precision, Youden index, F1-Score and Support of Each Model for Predicting the Pseudocapsule Thickness in the Validation set.

Note: IMDI, iodine-based material decomposition images; VNC, virtual non-contrast; MEI, mixed energy images.
The Radiomics Models for Predicting the Number of Collagen Fibers
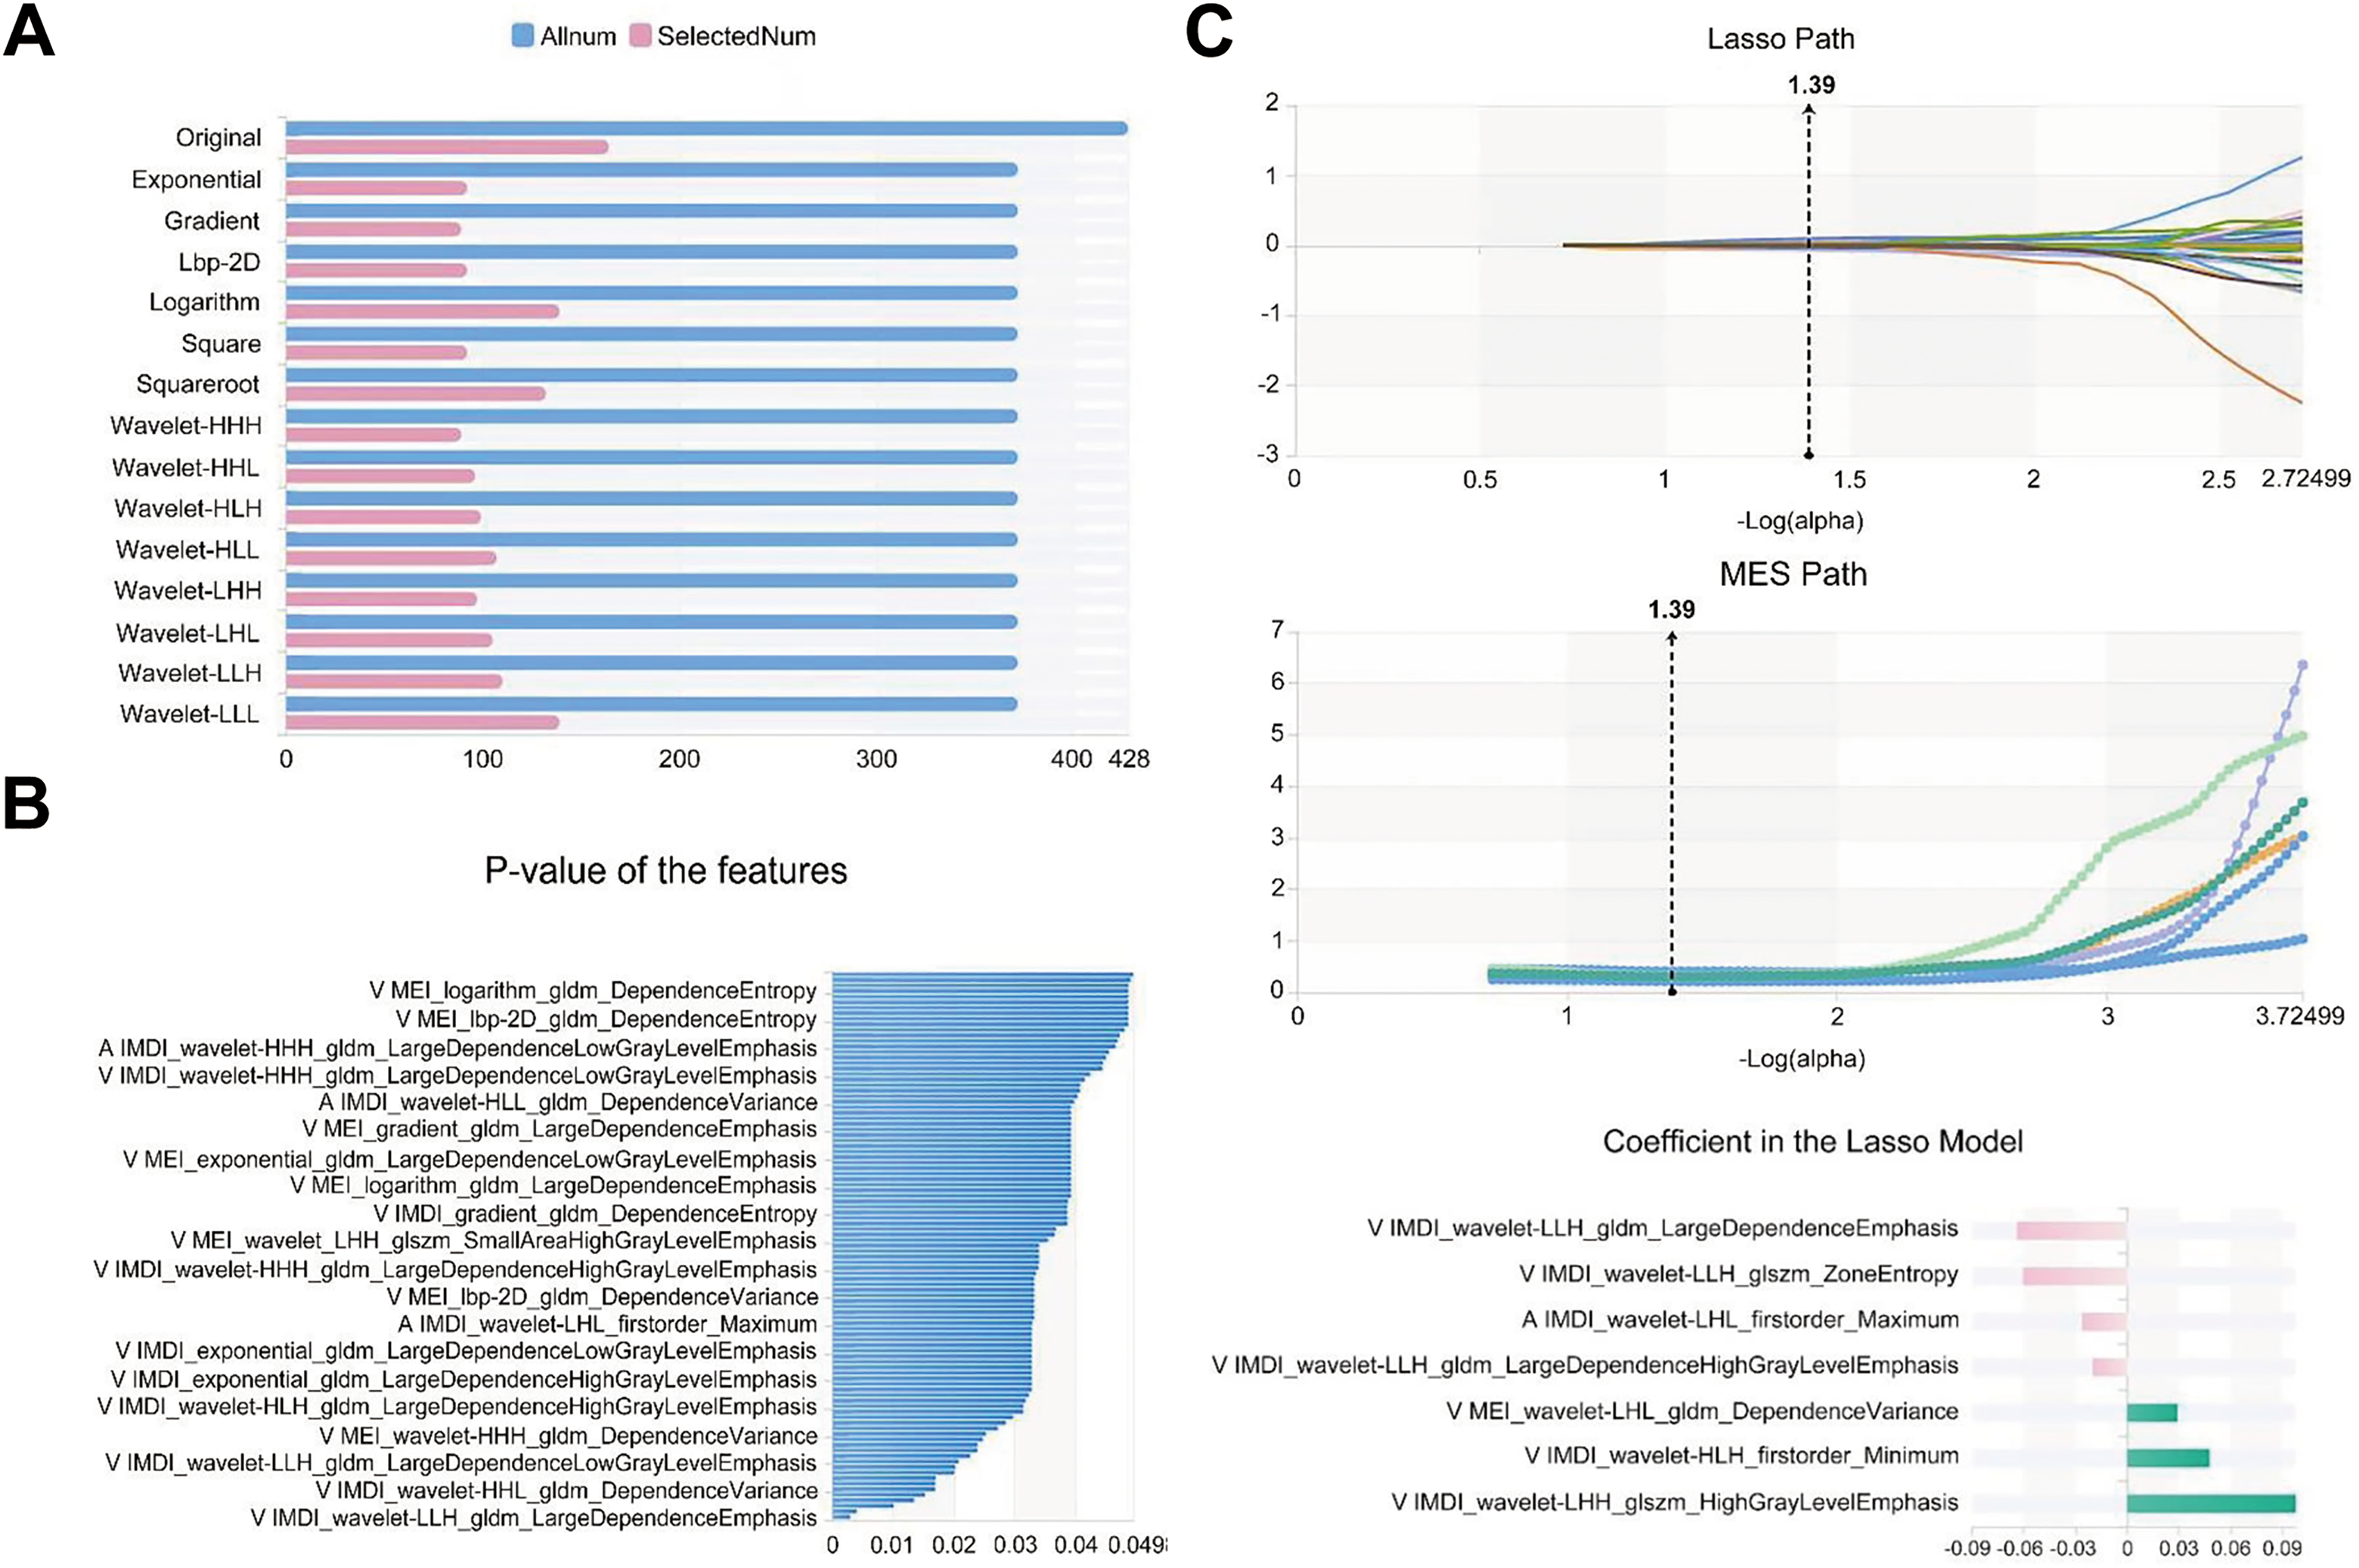
A total of 3776 (individual model) and 7552 (combined model) features were extracted from the images of all patients. In each respective model, we obtained 4, 3, 4, 5, 2, 6, and 5 optimal features after screening with the variance threshold method, SelectKBest method, and LASSO (Table 5). In the IMDI model, we initially eliminated features with a variance threshold below 0.8 from the initial set of 3776 features using a variance threshold method and selected 893 features (Figure 9A). Subsequently, we excluded the features with a P-value exceeding .05 using the SelectKBest method and identified five relevant features (Figure 9B). Finally, by applying the LASSO algorithm, we obtained four optimal features for the IMDI model (Figure 9C). In the combined model, 1668 features were selected from 7552 features using a variance threshold method (Figure 10A). Then, six features were further identified from these 1668 features using the SelectKbest method (Figure 10B). Finally, an optimized set of five features was obtained using the LASSO algorithm (Figure 10C).

Feature selection of IMDI model for predicting the number of collagen fibers.

Feature selection of the combined model for predicting the number of collagen fibers. (A) Variance threshold method was used to select 1668 features from 7552 features. (B) SelectKbest method selected six features. (C) LASSO method selected five features. The Laso path, MSE path, and the coefficients in the Lass model were shown. LASSO, least absolute shrinkage and selection operator.
The Optimal Radiomic Features, Radiomic Classes and Filters of Each Model for Predicting the Number of Collagen Fibers.
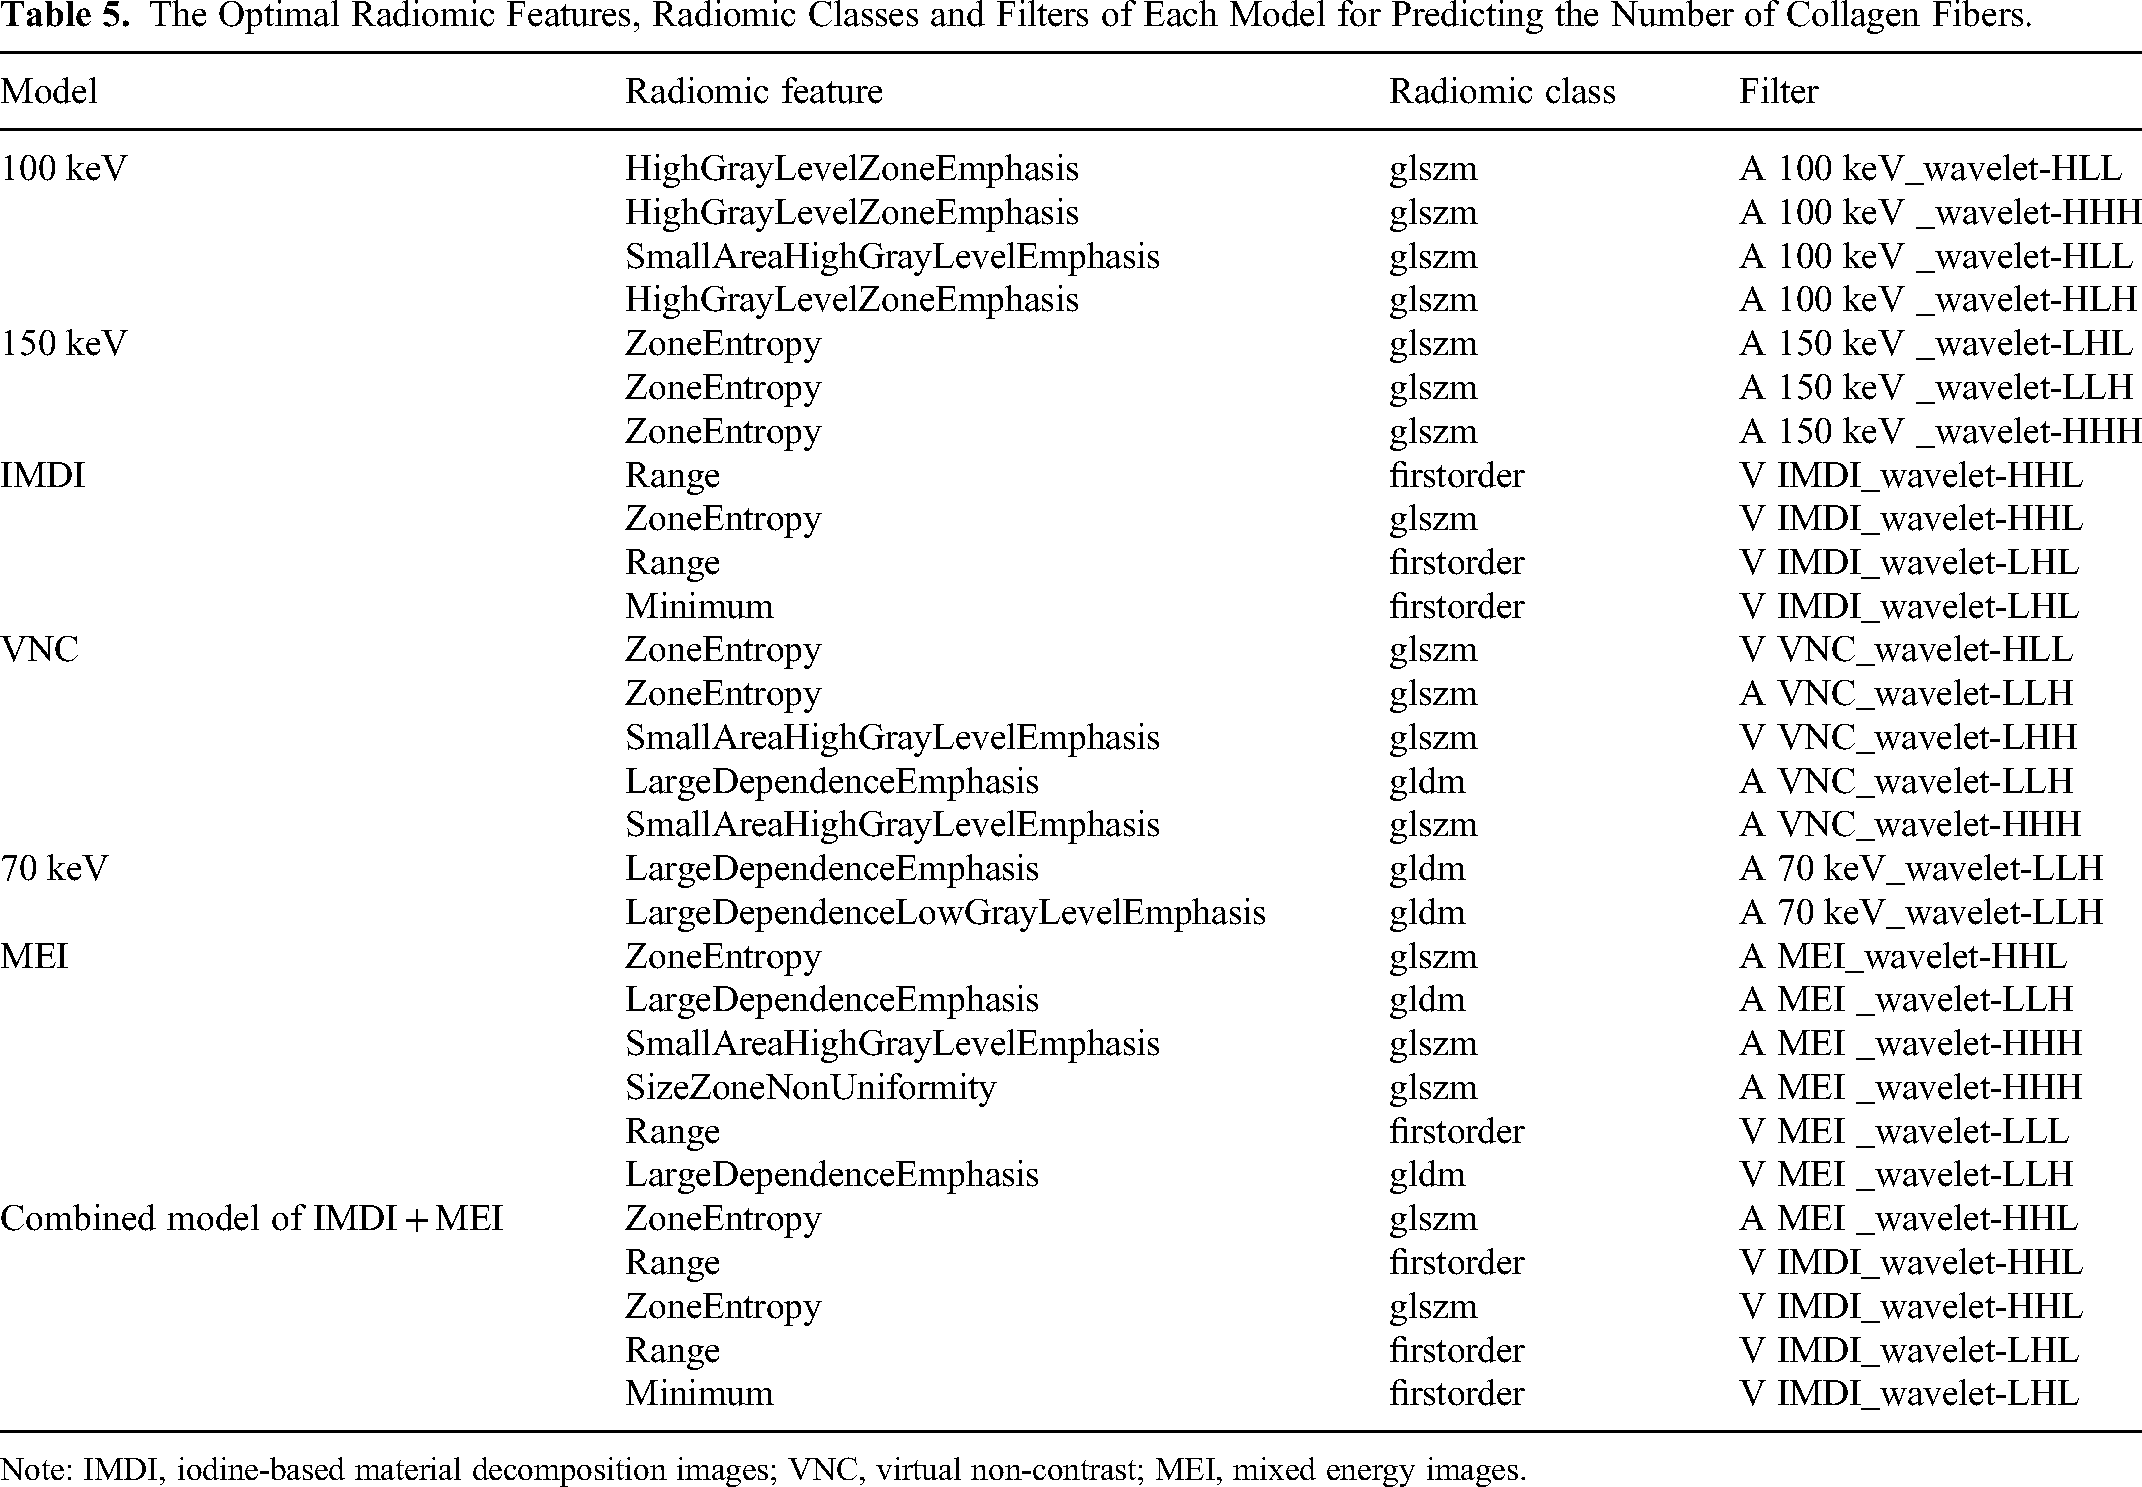
Note: IMDI, iodine-based material decomposition images; VNC, virtual non-contrast; MEI, mixed energy images.
The combined model exhibited the highest AUC (AUC = 0.741) among all models, with a specificity of 0.830 and a sensitivity of 0.330 (Figure 11A-11G) (Table 6). The AUC of the 150 kv model (AUC = 0.728) and IMDI model (AUC = 0.710) were slightly lower than those of the combined model, with the corresponding sensitivity and specificity of 0.560/0.780 and 0.670/0.830. The precision, Youden index, and F1 score of each model are presented in Table 7. The decision curve analysis illustrated a favorable net benefit for the combined model, 150 kv model, and IMDI model (Figure 12). The nomogram was developed with the nuclear grading, clinical symptoms, and Rad-score of the combined model (Figure 13).
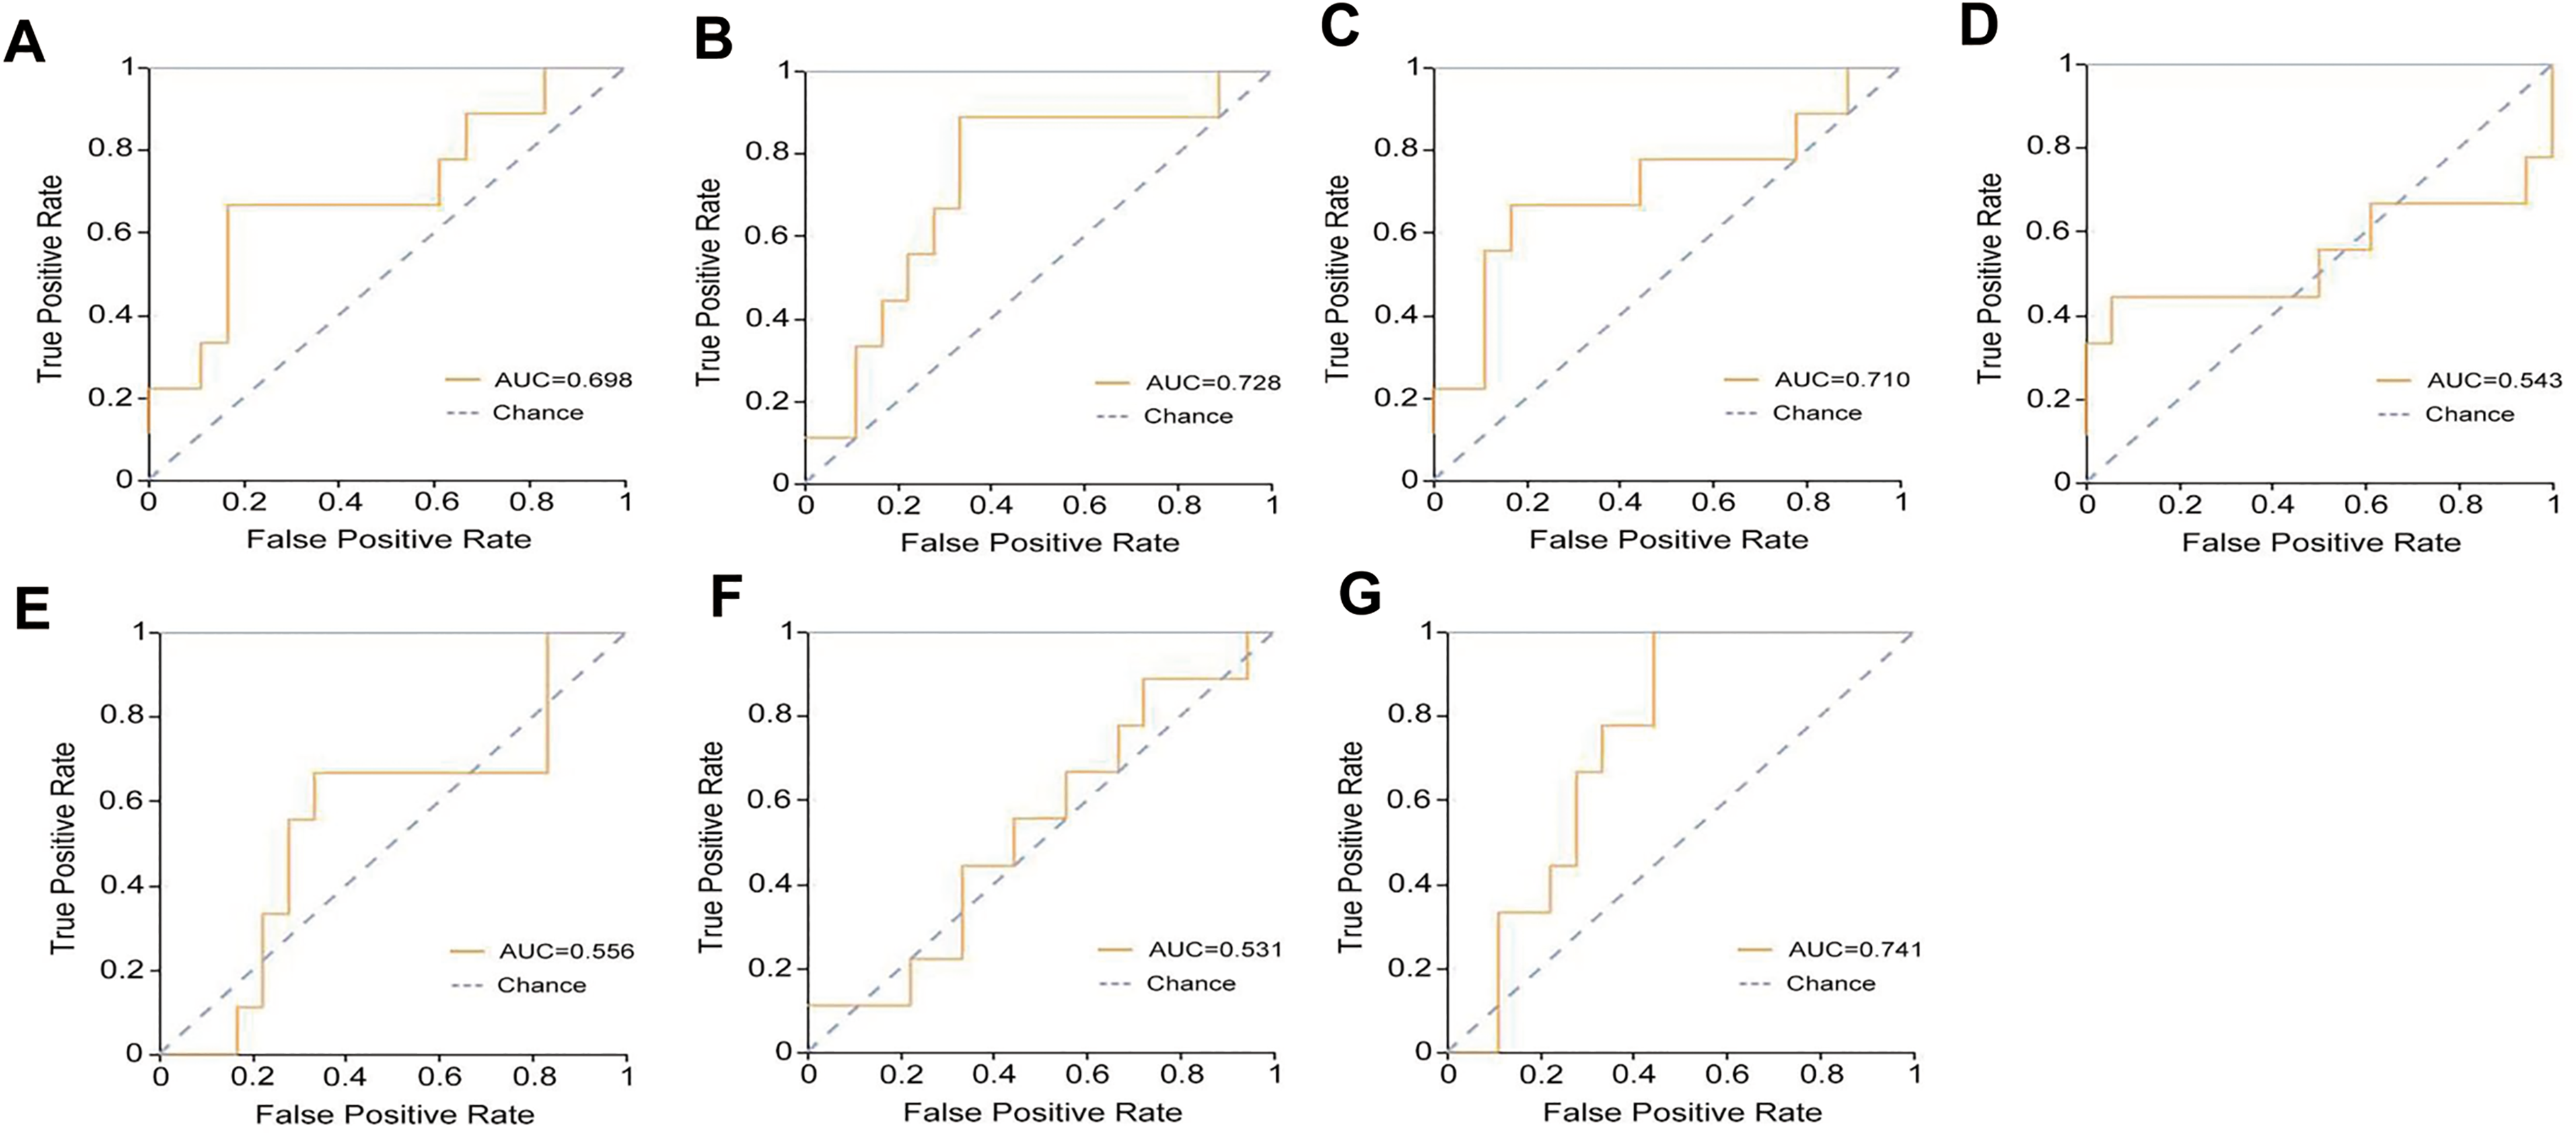
The ROC analysis

The decision curve analysis of the models for predicting the number of collagen fibers in the validation set.

The nomogram for predicting the number of collagen fibers.
The AUC, 95%CI, Sensitivity, and Specificity of Each Model for Predicting the Number of Collagen Fibers in the Validation Set.

Note: AUC, area under the curve; 95%CI, 95% confidence interval; IMDI, iodine-based material decomposition images; VNC, virtual non-contrast; MEI, mixed energy images.
The Precision, Youden index, F1-Score and Support of Each Model for Predicting the Number of Collagen Fibers in the Validation set.
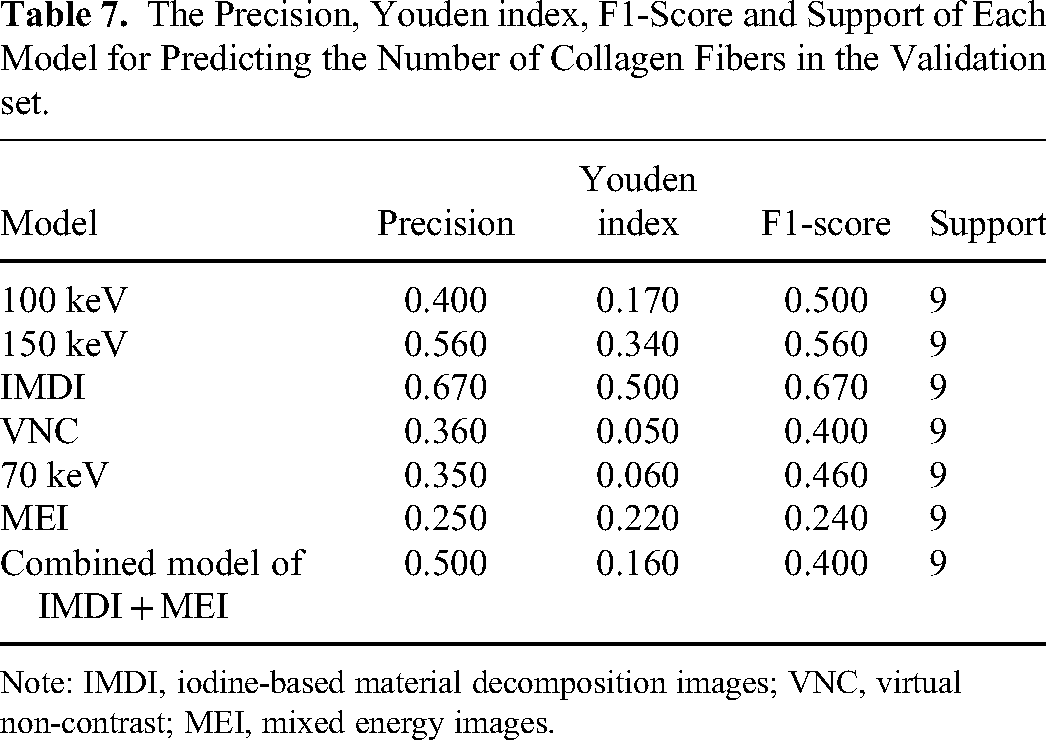
Note: IMDI, iodine-based material decomposition images; VNC, virtual non-contrast; MEI, mixed energy images.
Discussion
Currently, surgery remains the standard treatment for RCC. Renal tumor enucleation is a surgical procedure that involves removing the tumor along the natural plane between the peritumoral pseudocapsule and normal renal parenchyma while preserving healthy renal tissue. Compared to a standard nephrectomy, this technique results in fewer complications and better preservation of renal function.15 RCC typically lacks a true capsule and is enclosed by a pseudocapsule that originates from the compression of proliferating tumor cells against the adjacent normal renal parenchyma.16 This pseudocapsule acts as a barrier that limits the growth and migration of the tumor, facilitating enucleation. Therefore, the feasibility and safety of renal tumor enucleation are largely dependent on the status of the pseudocapsule. In general, a thicker pseudocapsule is associated with lower malignancy of the tumor and reduced tumor cell infiltration. In our current study, we classified the pseudocapsule into two groups based on its thickness: thin and thick. We defined the pseudocapsule as “thin” if it occupied less than half of the visual field, while any measurement greater than that was considered “thick” under light microscopy.
MRI is superior to other imaging modalities in identifying the pseudocapsule17 by demonstrating a low signal shadow around the tumor margin and delayed enhancement. Conversely, CT is the more commonly utilized method because of its ability to detect both the tumor itself and vascular imaging for surgical planning, as well as its short scan time. Li et al18 investigated the correlation between multidetector CT imaging spectrum and histopathological characteristics in 116 ccRCC patients who underwent nephron-sparing surgery. All patients underwent preoperative CT scans, which included unenhanced and phase III (arterial, nephrographic, and excretory) contrast series. They found that CT had a sensitivity, specificity, positive predictive value, and negative predictive value of 97.3%, 83.3%, 99.1%, and 62.5%, respectively, when compared to pathological results as the gold standard for detecting the pseudocapsule. Moreover, the Kappa test showed a high level of consistency between CT and pathological results. These results confirm that multidetector CT has an improved diagnostic performance in detecting the pseudocapsule. DECT is an emerging functional imaging modality that not only visualizes conventional CT changes but also quantifies tissue differences in the category of energetics, providing quantitative parameters for biological characteristics.19 We constructed seven radiomics models, ie, the 100 keV model, 150 keV model, IMDI model, VNC model, 70 keV model, MEI model, and a combined IMDI + MEI model, using radiomics features extracted from the reconstructed images of DECT in both arterial and venous phases. Radiomics facilitates high-throughput extraction and analysis of features in medical images, which allows identifying microscopic structures and texture features unnoticeable to the naked eye.20 Our results demonstrated that the combined model performed better than individual models in predicting pseudocapsule thickness, as evidenced by higher AUC, sensitivity, specificity, precision, and F1-score, indicating superior evaluation performance. Therefore, the combined model has good value for assessing the pseudocapsule thickness in ccRCC. Studies using traditional CT to investigate ccRCC pseudocapsule are limited, and those using DECT are even fewer. Our study further confirmed that DECT radiomics not only facilitated the identification of the pseudocapsule but also predicted its thickness. Our study shed lights on the additional application value of DECT.
The TME, characterized by hyperplasia of connective tissues, deposition of collagen fibers, and remodeling of the extracellular matrix,21 plays a crucial role in promoting tumor progression and metastasis. Several radiomics studies on the TME have investigated the tumor-stroma ratio (TSR).22–24 TSR, which directly reflects the number of stromal cells present in the tumor, is defined as the proportion of extracellular matrix, macrophages, endothelial cells, and fibroblasts in a tumor. TSR is an independent prognostic factor for several solid tumors.25, 26 It has been indicated that tumors with a high interstitial content are associated with an unfavorable prognosis.27 Meng et al22 developed and verified a machine learning classifier (XGBoost) to predict preoperative TSR expression in pancreatic ductal adenocarcinoma patients based on CT radiomics. They found that the survival of the low TSR group was significantly longer than that of the high TSR group. They concluded that the XGBoost classifier may provide a potentially valuable noninvasive tool for predicting TSR and optimizing risk grading in patients with pancreatic ductal adenocarcinoma. Cai et al identified biomarkers for preoperative TSR of rectal cancer using MRI and demonstrated that the radiomics features had higher diagnostic value than ADC in evaluating TSR, suggesting that the radiomics features may potentially facilitate patient stratification and decision-making.23 The findings suggest that both CT and MR imaging demonstrate a favorable efficacy in the assessment of tumor interstitial fibers, which aligns with our study. In contrast to previous studies, we investigated stromal collagen fibers within the TME. This can be attributed to the fact that cellular components provide valuable information, while collagen fibers crucially contribute to cancer progression, aggressiveness, and treatment response.28 Our results revealed that the combined model exhibited superior AUC and specificity compared to individual models, although with lower sensitivity, moderate precision, FI-score, and Youden index. Both the 150 keV model and IMDI model had higher sensitivity, specificity, precision, and F1-score than the combined model, although their AUC was marginally less. We therefore propose that all three models, namely the 150 keV model, IMDI model, and combined model, possess predictive values in estimating collagen quantity.
Our study has some limitations. First, it is a single-center retrospective study that lacks external validation and has a small sample size compared to multicenter studies. Second, the use of manual segmentation in establishing the radiomics model is both time-consuming and subjective, which compromises the model's efficiency and objectivity. Third, the thickness of the pseudocapsule and the number of collagen fibers were qualitatively evaluated. Fourth, the sample size was not calculated. Thus, quantitative analysis requires further investigation.
Conclusion
In conclusion, the DECT radiomics hold potential value in the evaluation of interstitial fibers in ccRCC and have the potential to offer added value for DECT application.
Footnotes
Authors’ contributions
AO conceived the idea and designed the study. XB and NW conducted the study and wrote the manuscript. YL, RL, and ZL collected the cases. JY, HS, and AO revised the manuscript. All authors read and approved the final manuscript.
Declaration of Conflicting Interests
The authors declared no potential conflicts of interest with respect to the research, authorship, and/or publication of this article.
Funding
The authors disclosed receipt of the following financial support for the research, authorship, and/or publication of this article: This work was supported by the Science and technology innovation project of Jinan, (grant number 202019036).
Research ethics and patient consent
The Ethics Committee waived the requirement for the patient's informed consent for the study due to the retrospective nature of the study and the anonymous nature of patient information. This study was approved by the Ethics Committee of Jinan Central Hospital (ethics approval number: 2023-012-01).