
Abstract
Keywords
Introduction
Breast cancer is the fifth leading cause of cancer-related deaths worldwide, with 2.3 million new cases and 68 500 deaths reported.1,2 Despite advancements in diagnosis and treatment, identifying prognostic factors for metastatic relapse is crucial in personalizing therapeutic approaches for patients. 3 Precision oncology and molecular profiling of individual tumors have emphasized the need to identify biomarkers of diagnostic and prognostic value as well as predict therapy resistance to improve patient survival.4–6
Approximately 20%-30% of breast cancer cases exhibit overexpression of HER2 protein, and Trastuzumab is a monoclonal antibody that targets HER2 receptors in HER2-positive metastatic breast cancer.7,8 While Trastuzumab has shown remarkable efficacy, resistance remains a significant clinical challenge, and understanding molecular mechanisms of resistance is critical for developing effective treatments. 9 Various approaches to predicting Trastuzumab resistance have been proposed, including genetic testing, 10 biomarker analysis, 11 and imaging techniques. 9
Predicting Trastuzumab resistance in HER2-positive breast cancer remains a significant clinical challenge. Despite advancements in targeted therapies, a substantial number of patients either fail to respond to Trastuzumab or develop resistance over time. 12 One major hurdle is the molecular heterogeneity of breast cancer. HER2-positive breast cancer consists of diverse subtypes with distinct genetic and epigenetic alterations, complicating the identification of universal biomarkers for resistance. 9 Additionally, the mechanisms driving resistance are complex and multifactorial, involving not only changes in HER2 signaling pathways but also crosstalk with other cellular processes such as the PI3 K/AKT/mTOR pathway, immune evasion, and epigenetic modifications like miRNA dysregulation. 13
Current predictive tools, such as HER2 amplification or expression levels, have limited accuracy in forecasting which patients will respond to Trastuzumab. 13 Moreover, intratumoral heterogeneity can result in variable responses even within the same tumor, further complicating predictions. Another challenge is the lack of robust, non-invasive biomarkers that can reliably predict resistance early in treatment. 14 Liquid biopsies, though promising, require more research to be integrated into clinical practice. These challenges highlight the need for new biomarkers and a better understanding of the underlying resistance mechanisms to improve treatment outcomes and personalize therapy for HER2-positive breast cancer patients. 8
Recent studies have suggested that miRNAs play a crucial role in resistance to Trastuzumab in HER2-positive metastatic breast cancer.15,16 miRNAs have been identified as potentially predictive of Trastuzumab resistance by targeting specific genes and pathways involved in resistance mechanisms. 17 Additionally, miRNAs have the potential to serve as therapeutic targets themselves, 18 as inhibition of specific miRNAs has been shown to restore sensitivity to Trastuzumab. 16 Therefore, miRNAs have emerged as a promising area of research for predicting and overcoming resistance to Trastuzumab in HER2-positive metastatic breast cancer. 19
MiR-200c has been identified as potentially predictive of Trastuzumab resistance, and it targets FOXP3, a transcription factor that regulates immune function and tumor growth. 4 Overexpression of miR-200c is associated with Trastuzumab resistance in HER2-positive breast cancer, and inhibiting miR-200c expression can restore FOXP3 expression and enhance the efficacy of Trastuzumab.4,20
The study's primary objective is to investigate the potential of the miR-200c/FOXP3 network as a predictive biomarker for response to Trastuzumab in HER2-positive metastatic breast cancer. The secondary objectives are to assess the association between miR-200c expression levels and Trastuzumab resistance in HER2-positive breast cancer and determine the clinical utility of the miR-200c/FOXP3 network in predicting Trastuzumab response in HER2-positive breast cancer patients.
Materials and Methods
Study Design and Clinical Assessment
The study was approved by the Research Ethics Committee at Faculty of Medicine, Ain Shams University, Cairo, Egypt. The ethical approval number is FWA000001785, and the approval was granted on 2019. The study followed ethical guidelines established in the 1964 Declaration of Helsinki and its subsequent revisions. A case-control study was conducted from March 2019 to December 2021 involving women with HER2-positive metastatic breast cancer (HER2-MBC). For inclusion, we selected HER2-positive metastatic breast cancer (HER2-MBC) patients confirmed by immunohistochemistry or fluorescence in situ hybridization, and those who had not received prior Trastuzumab treatment. Exclusion criteria included pregnancy, lactation, contraindication to Trastuzumab, Her2-negative breast cancer, primary non-metastatic breast cancer, other malignancies diagnosed in the past five years, and those who had received prior targeted therapy, or those with poor-quality plasma samples. To be included in the case group, patients needed to be over 25 years of age and have a confirmed diagnosis of HER2-MBC, which was determined through immunohistochemistry (IHC) assays or fluorescence in situ hybridization. Exclusion criteria included pregnancy, lactation, contraindication to Trastuzumab, Her2-negative breast cancer, primary non-metastatic breast cancer, and other malignancies diagnosed in the past five years. The control group consisted of healthy individuals of similar age. At baseline, patients underwent radiological and laboratory investigation, and treatment involved Trastuzumab alone or in combination with other therapies. Blood samples were collected from patients before treatment, and plasma was stored at −80 °C until analyzed. The primary endpoint of the study was to predict resistance to Trastuzumab by correlating the plasma expression of miR-200c-3p and FOXP3 with response to treatment. Patients were followed up for 12 months after starting treatment, and clinical response was assessed using the Response Evaluation Criteria in Solid Tumors. Patients were categorized into responders and resistant groups based on their response to treatment, and time to progression (TTP) was defined as the time between the first day after completing the first cycle of treatment and the first documented disease progression of the disease. Follow-up assessments were conducted every three months. The study was conducted in accordance with the guidelines of Strengthening the Reporting of Observational Studies in Epidemiology (STROBE) for observational studies. 21 All participants signed a written informed consent for their involvement in the study, which adhered to the standard of care for diagnosis and management. Confidentiality of all information generated during the study was guaranteed to the participants, and each patient was given a unique identification number upon enrollment.
Using the Power Analysis and Sample Size Software (PASS15), the sample size was determined based on the need to detect a specified effect size in patients with HER2-MBC treated with Trastuzumab at signifcance level 0.05. A total of 40 patients with HER2-MBC were included to ensure sufficient power to detect meaningful differences in treatment outcomes. Additionally, a control group of 20 healthy women with no relevant medical conditions or prior history of cancer was included to provide a baseline comparison. The sample size was chosen to achieve a target power of 80% and an effect size of Cohen's d = 0.8 to ensure the study's ability to detect clinically significant differences between the groups.
The reporting of this study conforms to REporting recommendations for tumour MARKer prognostic studies (REMARK) 22
Measurement of Plasma Level of miR-200c-3p and FOXP3
Total RNA and miRNA were extracted from plasma samples using the miReasy Mini Kit (Qiagen, Hilden, Germany), following the manufacturer's instructions and hemolyzed samples were excluded. The miR-200c-3p gene was amplified using the miRCURY LNA SYBR Green PCR kit and miRNA PCR assay, with cel-miR-39-3p (Qiagen, Hilden, Germany) used as the reference gene for normalization. 23 The FOXP3 gene was amplified using the Hs_FOX3 QuantiTect Primer Assay and QuantiTect SYBR Green PCR Kit, with Hs_GAPDH 1 SG as the reference gene. 24 The 5 plex Rotor Gene PCR Analyzer was used for both PCR tests, and the 2-ΔΔCt equation was used to calculate the relative expression level (fold change) for both genes relative to the calibrator (negative control sample) and normalized to the endogenous control (cel-miR-39-3p for miR-200c-3p and GAPDH for FOXP3).
Statistical Methods
The clinicopathological characteristics of patients were reported using mean and standard deviation for age and median with interquartile range (IQR) or percentages for continuous and categorical variables, respectively. Outliers for miR-200c-3p and FOXP3 plasma-expression values were identified and removed from the analysis. The normal distribution of miRNA expression was assessed using statistical tests. Non-parametric tests were used to evaluate the association of miR-200c-3p expression with clinical response to Trastuzumab and the analysis of paired samples. ROC curve analysis was used to determine the predictive value of miR-200c-3p and FOXP3 for the response to Trastuzumab. The correlation between miR-200c-3p expression and the expression of the FOXP3 gene was evaluated using Spearman's rank correlation test. Kaplan–Meier curves and log-rank tests were used for time-to-progression (TTP) analyses, with the median value of miR-200c-3p at baseline for responders and resistant, used as a cut-off point for survival comparisons. All statistical analyses were conducted using GraphPad Prism version 9.0.0 (GraphPad Software, San Diego, California USA) for Windows, with a P-value less than 0.05 considered statistically significant.
Results
Demographic and Clinical Characteristics of the Studied Cohort
The study involved two groups: forty patients with HER2-MBC who were treated with Trastuzumab and a control group consisting of 20 healthy women with no relevant medical conditions or prior history of cancer. The control group was recruited for the normalization of miR-200c and FOXP3 plasma levels. Table 1 presents the clinical and pathological features of both groups. An independent t-test showed no significant difference in age between the MBC and healthy groups. The mean age for the HER2-MBC group was 56.48 years, with a range of 32 to 75, and 70% of the patients were over the age of 55. Most of the MBC cases were in a post-menopausal state (65%), ER-positive (52%), and PR-negative (65%). The predominant pathological features were BC-stage III (52%), LN-stage 3 (80%), and 85% of the tumor tissue expressed >20% Ki67. The clinical response rate to Trastuzumab was 84%, while 16% of the patients showed resistance to Trastuzumab, which was evident from disease progression.
Demographic Characteristics of Included Patients in the Metastatic Her2-Positive BC (n = 40) and Control (n = 20) Groups.

N: Number; SD: Standard deviation; BC: Breast cancer; LN: Lymph node.
Plasma Levels of miR-200c-3p and FOXP3 in HER2-MBC and Healthy Controls
The study assessed the levels of miR-200c-3p and FOXP3 in the plasma of HER2-MBC patients (n = 40) and healthy controls (n = 20). The plasma expression level of miR-200c-3p was considerably lower in the HER2-MBC group at baseline (BL) than in the control group (P < .0001). Conversely, the plasma expression level of FOXP3 was significantly higher in the HER2-MBC group than in the healthy control group (P < .0001). Table 2 displays the results.
Comparison Between the Expression Levels of miR-200c and FOXP3 in MBC Patients at Baseline and Healthy Controls.

BL: baseline, U: Mann-Whitney U, data are presented in median and range.
Predictive Value of miR-200c-3p and FOXP3 Expression for the Response to Trastuzumab in HER2-MBC
We examined how well miR-200c-3p and FOXP3 could forecast the effectiveness of Trastuzumab in treating Her2 + ve-BC. Using a Receiving Operating Characteristics curve, we determined that plasma levels of miR-200c-3p and FOXP3 could predict resistance to Trastuzumab in Her2 + ve-MBC, with a sensitivity of 71% and 72%, respectively, at an optimal cut-off value of <0.2 and >22.6. Additionally, FOXP3 expression was found to be a more effective predictor of Trastuzumab resistance compared to miR-200c-3p, with greater biomarker specificity. Table 3 presents our results.
miR-200c and FOXP3 Predictive Value for the Response to Trastuzumab in Her2-Positive Metastatic Breast Cancer (ROC Curve).
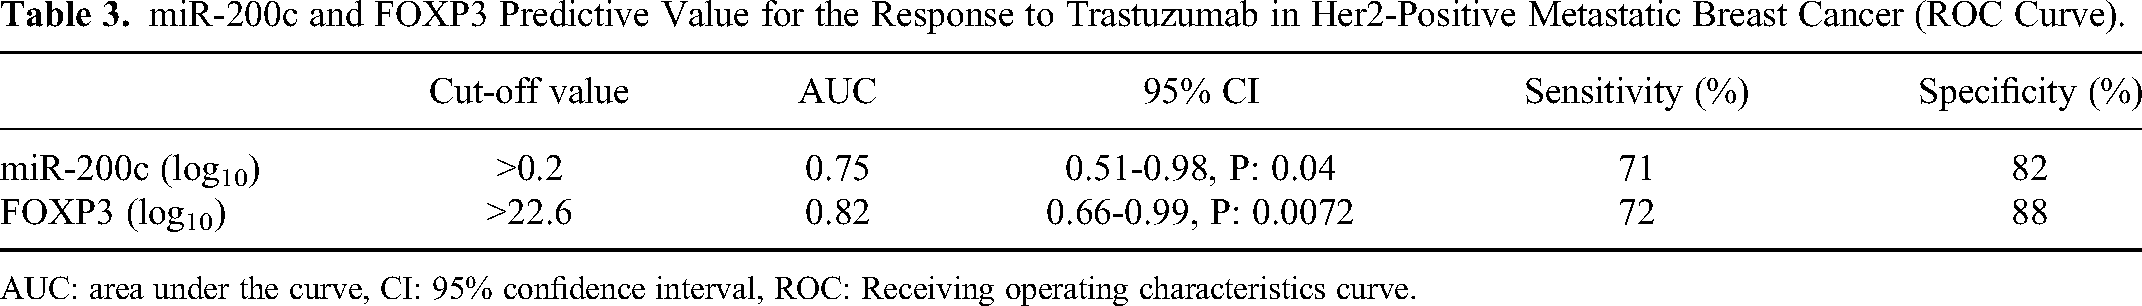
AUC: area under the curve, CI: 95% confidence interval, ROC: Receiving operating characteristics curve.
Plasma Levels of miR-200c-3p and FOXP3 Expression in HER2-MBC Across Time
Figure 1 displays the expression levels of circulating miR-200c-3p (Figure 1a) and mRNA-FOXP3 (Figure 1c) at baseline (BL) and after completing Trastuzumab treatment (1C) (Figure 1b and d) in HER2-MBC patients who either responded to the treatment or showed resistance. The expression levels of each biomarker were normalized to healthy controls and presented in Log10. Responder patients were those who achieved partial remission or stable disease, while resistant cases showed disease progression before the 1C sample was collected.

Plasma expression levels of miR-200c-3p in HER2-MBC patients at baseline (a) and after completing the first cycle of Trastuzumab (b). Panels (c) and (d) show the plasma expression levels of FOXP3 at baseline and following the first cycle of Trastuzumab.
The Mann-Whitney test revealed that a significant decrease in miR-200c-3p expression at BL was associated with resistance to Trastuzumab and disease progression (P = .03). Conversely, higher expression levels of FOXP3 were significantly associated with resistance and disease progression. Furthermore, a substantial increase in miR-200c expression in breast cancer patients after one cycle of Trastuzumab was significantly correlated with sensitivity to the drug, unlike resistant patients who showed no significant change in miR-200c levels after therapy compared to baseline (P = .001). These results are presented in Table 4 and Figure 1a and 1c.
Comparison Between the Expression Levels of miR-200c and FOXP3 Across Measurements in Time in Metastatic Breast Cancer Patients.

BL: baseline, U: Mann-Whitney U, *: the mean increase (miR-200c: 31 in responders, n = 3 in resistant) or decrease (FOXP3, n = 19 in responders, n = 4 in resistant group) of expression is calculated on patients who showed significant change in expression after completed cycle of treatment >2 folds from the baseline level.
Similarly, after treatment (1C), resistant patients showed a significantly lower expression of miR-200c-3p than responders (Figure 1b), while FOXP3 expression was higher in resistant cases at 1C compared to those who showed clinical remission or stable disease (Figure 1d). The fold change (FC) in plasma miR-200c-3p and FOXP3 at 1C was calculated for each patient respective to the expression measured at baseline according to the following equation: FC = [(expression level (1C) – expression level (BL))/ expression level (BL)], and patients were classified into two groups: positive response and negative response. The Chi-square test showed that patients with a positive change in miR-200c or FOXP3 expression levels were predominant in the Trastuzumab responder group and statistically significant (P < .05), while no significant difference was observed between the percentage of patients who showed a positive and negative change in any of the measured biomarkers in the Trastuzumab-resistant group (P > .05). These results are presented in Table 5 and Figure 2a, b.

Changes in miR-200c-3p (a) and FOXP3 (b) expression levels in HER2-MBC after completing cycle 1 of Trastuzumab. (c): Spearman's correlation analysis between miR-200c-3p and FOXP3 at BL and at 1C (d). data are presented in correlation coefficient (r) and 95% confidence intervals.
Results of Student's t-Test Comparing miR-200c and FOXP3 Genes Expression Change” status; “Patients who Showed Significant Change (Positive) from Baseline Level and Those who did not (Negative)”.

Correlation Between miR-200c-3p and FOXP3 Expression in HER2-MBC at BL and 1C
Using Spearman's correlation analysis, a significant negative correlation with moderate strength was found between the expression levels of miR-200c-3p and FOXP3 at baseline in HER2-MBC (r = 0.46, P = .0026). This means that a lower expression of miR-200c was associated with an increase in FOXP3 expression. However, after completing the first cycle of Trastuzumab treatment, no significant correlation was observed between the two biomarkers (Table 6 and Figure 2c, d)
Spearman's Correlation Between miR-200c and FOXP3 Expression in MBC Patients among Time.

r: correlation coefficient, CI: confidence interval.
Correlation Between miR-200c-3p, FOXP3 Expression and Time to Progression (TTP) in HER2-MBC at BL and 1C
The log-rank survival curves in Figure 3 demonstrate that patients with lower baseline miR-200c levels or higher FOXP3 levels experienced shorter TTP, indicating a more rapid progression of disease. This is supported by the significant p-values shown in Table 7 for both miR-200c (P = .0003) (Figure 3a) and FOXP3 (P = .005) (Figure 3b) in the responder group. The median TTP for resistant patients was five months, compared to 8.5 and 10 months for miR-200c and FOXP3 in Trastuzumab responders, respectively. Table 7 and Figure 3 provide more details on these findings.

The log-rank survival curve illustrates the link between the BL plasma levels of miR-200c-3p (a), FOXP3 (b), and the time to progression (TTP) in HER2-MBC, with respect to the responsiveness to trastuzumab. TTP: Time to progression.
A log-Rank Test Comparing TTP (Months) Distribution among miR-200c, FOXP3 Expression, and Response to Trastuzumab in MBC Patients at Baseline.

TTP: time to progression, X2: Chi-square.
Discussion
Resistance to Trastuzumab is the main challenge in the management of HER2-positive metastatic breast cancer. 25 A deeper comprehension of the underlying molecular causes of resistance is required to create more efficient treatment plans. 7 Previous studies have linked the miR-200c/FOXP3 network to drug resistance and poor prognosis in breast cancer (BC), 4 but these studies were conducted using experimental models without clinical validation. 20 Here, we performed a clinical study to evaluate the value of miR-200c-3p and FOXP3 in predicting the response to Trastuzumab in HER2-MBC women. In this study, a total of 40 patients with HER2-MBC and 20 healthy women as a control group were recruited. The findings indicated that the plasma expression level of miR-200c-3p was considerably lower in the HER2-MBC group than in the healthy control group, whereas the plasma expression level of FOXP3 was significantly higher in the HER2-MBC group. The outcomes were consistent with previous studies that reported higher levels of miR-200c-3p in MBC patients.26,27 Zhang et al also demonstrated the predictive role of elevated plasma miR-200c-3p levels for metastasis in patients without metastatic breast cancer at diagnosis. However, it is yet to be determined whether high levels of miR-200c-3p are a surrogate marker or contribute to the development of metastasis. The miR-200 family has recognized a marker of epithelial cells, particularly if they express E-cadherin, 20 implying that miR-200 plasma levels might be linked to circulating epithelial tumor cell load. Ultimately, our results strengthen the previously reported association between elevated plasma levels of this miR-200c and HER2-MBC. Tang et al observed weak expression in breast cancer cells compared to the mammary epithelial cell line. Additionally, overexpression of miR-200c resulted in a significant reduction in tumor load. 28
It has been suggested that miR-200c functions as a tumor suppressor. 29 This was evident by the fact that decreased levels of miR-200c in tumor cells were significantly associated with invasion and metastasis of breast cancer, 30 and restoration of miR-200c reduced metastases in preclinical models. 28 On the other hand, other studies propose the opposite findings. They demonstrated that miR-200c can promote metastases. 31 These studies have shown that tumor cells expressing miR-200 and the extracellular vesicles released by these cells can enhance breast cancer metastasis and allow these cells to settle in distant tissues in a way that is dependent on miR-200. 20 This suggests that miR-200c found in circulation could be a useful marker for breast cancer metastasis. However, the exact source of these circulating miR-200 molecules, how they are released, and their function during tumor growth and metastasis are still not fully understood.
In the current study, miR-200c-3p expression was low before therapy in HER2-MBC and dramatically decreased in the follow-up sample (1C) at the progression of disease and development of resistance; however, it increased after one cycle of Trastuzumab therapy in patients who were sensitive to Trastuzumab. These findings align with prior reports showing elevated expression levels of miR-200c and miR-141 during tumor progression and metastasis. 32 Additionally, elevated miR-200b and miR-200c plasma levels accurately discriminated between patients suffering from early-stage breast cancer and MBC. 33
Beyond the intrinsic subtype and genomic expression test, 10 there is currently no clear, single predictive biomarker available for use in adjuvant or neoadjuvant decision-making for the prediction of sensitivity to chemotherapy in breast cancer. 34 Experimental results have revealed that miR-200c has a predictive role in the response to chemotherapy, 20 but to our knowledge, there has not been clinical proof of response prediction to Trastuzumab in HER2-MBC scenarios.
The association between miR-200c and sensitivity to Trastuzumab was previously investigated by El-Khazragy et al in experimental in vitro and in vivo models. The study determined that miR-200c decreased stemness, enhanced the response of HER2 + breast cancer cells to Trastuzumab, and improved the malignant progression of SKBR3-S and SKBR3 in vivo. 28 Furthermore, the combination of miR-200c and Trastuzumab effectively decreased proliferation and increased apoptosis of HER2-positive SKBR3. The overexpression of miR-200c eliminated the target genes downstream. 28
The Spearman's correlation analysis conducted in this study aimed to investigate the association between miR-200c-3p and FOXP3 expression in HER2-MBC at baseline and after the first cycle of Trastuzumab treatment. The results showed a significant negative correlation between miR-200c-3p and FOXP3 expression at baseline, indicating that lower miR-200c-3p expression was associated with increased FOXP3 expression. This correlation may be due to the regulatory effect of miR-200c-3p on FOXP3 expression.
Interestingly, after completing the first cycle of Trastuzumab treatment, the correlation between the two biomarkers was no longer significant. This could be due to the different mechanisms of action of Trastuzumab compared to miR-200c-3p on FOXP3 expression. Trastuzumab targets the HER2 receptor, whereas miR-200c-3p regulates FOXP3 expression at the post-transcriptional level. Thus, the effect of Trastuzumab on FOXP3 expression may override the regulatory effect of miR-200c-3p after treatment.FOXP3 plays a crucial role as the primary controller in the formation and activity of regulatory T cells and has been associated with immune suppression within the tumor microenvironment.35,36 According to Zhang et al, FOXP3 is a tumor suppressor intrinsic to breast epithelial cells. FOXP3 nuclear expression is lacking in 60%-80% of human breast cancer cells, unlike normal breast epithelial cells. 20
Several studies have investigated the relationship between miR-200c and FOXP3 in breast cancer. One study found that FOXP3 expression was significantly higher in breast cancer tissues compared to normal breast tissue and that FOXP3 expression was negatively correlated with miR-200c expression. 20 This suggests that there may be an inverse relationship between FOXP3 and miR-200c in breast cancer, with FOXP3 possibly inhibiting the expression of miR-200c. Interestingly, higher FOXP3 expression was associated with poorer prognosis 37 ; meanwhile, higher miR-200c expression is significantly associated with lower FOXP3 expression and improved overall survival. 36 These results suggest that miR-200c may play a role in regulating FOXP3 expression and that modulating miR-200c levels could potentially improve prognosis by reducing FOXP3 expression. 20
Additionally, several studies have investigated the potential of miR-200c and FOXP3 as predictive biomarkers for breast cancer treatment response. One preclinical study found that higher levels of miR-200c in the plasma were associated with improved response to Trastuzumab in HER2-positive breast cancer patients. 20 Another study found that FOXP3 expression in tumor-infiltrating lymphocytes was associated with resistance to neoadjuvant chemotherapy in breast cancer patients. 36
In conclusion, while the relationship between miR-200c and FOXP3 in breast cancer is not fully understood, several studies suggest that there may be an inverse relationship between the two and that miR-200c and FOXP3 could potentially be used as predictive biomarkers for breast cancer prognosis and treatment response. 20 Further research is needed to fully elucidate the biological mechanisms underlying this relationship and to determine the clinical utility of these biomarkers.
The Log-rank analysis conducted in this study aimed to investigate the correlation between miR-200c-3p and FOXP3 expression at baseline and time to progression (TTP) in HER2-MBC patients. The results showed that lower levels of miR-200c-3p and higher levels of FOXP3 expression were significantly correlated with resistance to Trastuzumab and shorter TTP in months. This suggests that miR-200c-3p and FOXP3 may serve as potential prognostic biomarkers for predicting response to Trastuzumab treatment and TTP in HER2-MBC patients.
Overall, the findings of this study highlight the potential importance of miR-200c-3p and FOXP3 expression in predicting response to Trastuzumab treatment and TTP in HER2-MBC patients. However, further studies are needed to validate these findings and elucidate the underlying mechanisms involved in the regulatory effect of miR-200c-3p and FOXP3 on Trastuzumab response in HER2-MBC patients.
miR-200c-3p expression in breast cancer tumors is linked to disease-free survival (DFS) and distant relapse-free survival (DRFS), according to previous studies. 38 However, no statistically significant was detected in the univariate model for DFS before or after neoadjuvant chemotherapy (NCT). 4 For DRFS, there was a trend towards significance in pre-NCT samples, but it reached statistical significance in post-NCT samples, indicating that miR-200c-3p may impact overall survival (OS) through DRFS after NCT. However, miR-200c-3p expression was not found to be a strong independent predictor for DRFS in the multivariate analysis. Further research is required to determine the potential of miR-200c-3p as a prognostic biomarker in breast cancer.
One limitation of the study is that the sample size was relatively small, which could affect the generalizability of the findings. Another limitation is the lack of validation in an independent cohort, which could provide more robust evidence for the predictive value of miR-200c/FOXP3. Additionally, the study only focused on Her2-metastatic breast cancer, so the findings may not be applicable to other subtypes of breast cancer. The study also did not investigate the underlying mechanisms by which miR-200c and FOXP3 may be involved in Trastuzumab resistance. Finally, the study only measured the expression levels of miR-200c and FOXP3 at baseline, and after one cycle of Trastuzumab treatment, a longer-term follow-up may be needed to fully evaluate their predictive value.
In addition, Patient heterogeneity plays a crucial role in influencing therapeutic outcomes, particularly in HER2-positive metastatic breast cancer. Variability in genetic and epigenetic profiles, prior treatments, and tumor biology can significantly affect miR-200c and FOXP3 expression, leading to differing responses to Trastuzumab. Acknowledging this heterogeneity provides a more balanced perspective, as it highlights the challenges in predicting treatment responses and underscores the need for personalized approaches in clinical management.
Conclusion
These findings suggest that miR-200c-3p and FOXP3 may serve as biomarkers for predicting the response to trastuzumab therapy in HER2-positive breast cancer patients. However, further studies are needed to validate these findings in larger cohorts and to elucidate the underlying mechanisms by which miR-200c-3p and FOXP3 contribute to breast cancer progression and response to therapy. In conclusion, miR-200c/FOXP3 has the potential to be a useful prognostic and predictive biomarker in HER2-positive breast cancer patients treated with Trastuzumab.
Implications for Future Research and Clinical Value
Resistance to Trastuzumab therapy in HER2-positive metastatic breast cancer patients is a major challenge. While components of the miR-200c/FOXP3 pathway have been independently linked to breast cancer progression and treatment response, no clinical studies have evaluated this network's predictive potential.
This study provides the first clinical evidence that the miR-200c/FOXP3 axis may serve as a biomarker to predict Trastuzumab sensitivity. Low pretreatment miR-200c-3p levels are strongly associated with FOXP3 overexpression, rapid disease progression, and poor prognosis – suggesting utility as a baseline prognostic biomarker. Additionally, increased miR-200c-3p expression after one Trastuzumab cycle specifically characterized treatment responders.
These findings may allow refinement of current clinical decision-making regarding Trastuzumab therapy. Assessment of miR-200c/FOXP3 levels prior to Trastuzumab initiation could identify patients who are unlikely to respond and who may benefit from alternate or combinational treatment regimens. Monitoring miR-200c-3p changes early during Trastuzumab treatment may also predict resistance development and enable rapid adjustment of therapeutic strategies. Overall, this study indicates that the miR-200c/FOXP3 network has strong potential to guide personalized medicine approaches for managing HER2-positive metastatic breast cancer. Further clinical validation is merited.
Footnotes
Abbreviations
Author Contribution
Conceptualization, MSO, MTE, and NE; Formal analysis, MSO, AMA, AAA, MHM, and NE; Investigation, AAA, MHM, and DAMS; Methodology, MTE, AMA, DAMS and NE; Project administration, MSO, and NE; Resources, MSO; Supervision, NE; Validation, NE; Writing – original draft, NE; Writing – review & editing, MSO, MTE, AMA, AAA, MHM, and DAMS.
Data Availability
The data that support the findings of this study are available from the corresponding author upon reasonable request.
Declaration of Conflicting Interests
The authors declared no potential conflicts of interest with respect to the research, authorship, and/or publication of this article.
Funding
The authors received no financial support for the research, authorship, and/or publication of this article.
Ethical Approval
The research was granted approval by the Faculty of Medicine's ethical committee at Ain Shams University, Cairo, Egypt, under the Federal Wide Assurance number FWA 000018682. The study followed ethical guidelines established in the 1964 Declaration of Helsinki and its subsequent revisions. Written informed consent was acquired from each patient.