
Abstract
Background
Hepatocellular carcinoma (HCC) is a serious health concern because of its high morbidity and mortality. The prognosis of HCC largely depends on the disease stage at diagnosis. Computed tomography (CT) image textural analysis is an image analysis technique that has emerged in recent years.
Objective
To probe the feasibility of a CT radiomic model for predicting early (stages 0, A) and intermediate (stage B) HCC using Barcelona Clinic Liver Cancer (BCLC) staging.
Methods
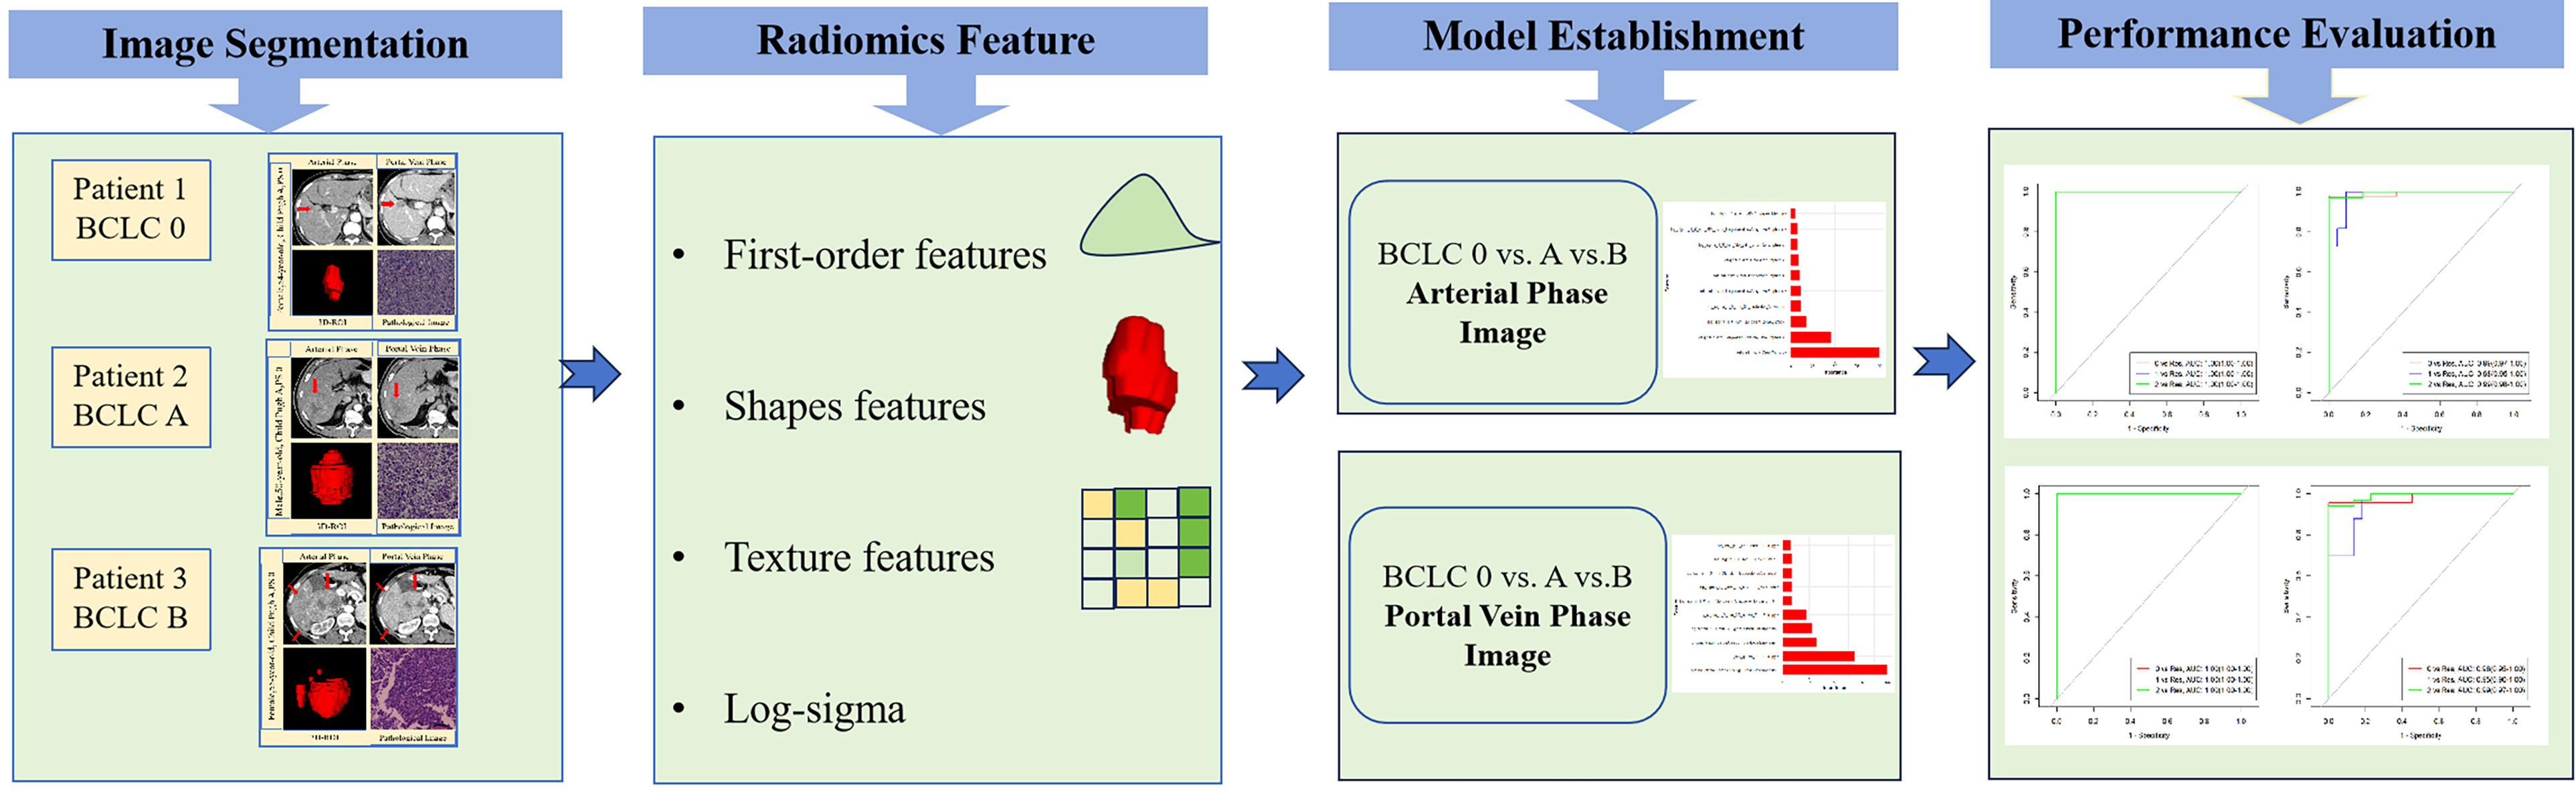
A total of 190 patients with stages 0, A, or B HCC according to CT-enhanced arterial and portal vein phase images were retrospectively assessed. The lesions were delineated manually to construct a region of interest (ROI) consisting of the entire tumor mass. Consequently, the textural profiles of the ROIs were extracted by specific software. Least absolute shrinkage and selection operator dimensionality reduction was used to screen the textural profiles and obtain the area under the receiver operating characteristic curve values.
Results
Within the test cohort, the area under the curve (AUC) values associated with arterial-phase images and BCLC stages 0, A, and B disease were 0.99, 0.98, and 0.99, respectively. The overall accuracy rate was 92.7%. The AUC values associated with portal vein phase images and BCLC stages 0, A, and B disease were 0.98, 0.95, and 0.99, respectively, with an overall accuracy of 90.9%.
Conclusion
The CT radiomic model can be used to predict the BCLC stage of early-stage and intermediate-stage HCC.
Introduction
Hepatocellular carcinoma (HCC) is the sixth most common malignancy and fourth leading cause of cancer-related death worldwide, 1 thus constituting a serious health concern. HCC is a prevalent hepatic malignancy that typically presents within chronic hepatic conditions, including cirrhosis/severe fibrosis. The main pathogeneses include chronic hepatitis B or C viral infection or metabolic liver disorders caused by nonalcoholic steatohepatitis/alcoholic liver disease. 2 The prognosis of HCC largely depends upon the disease stage at diagnosis. Therefore, scientific staging and adopting an optimal therapeutic strategy are essential for improving the prognosis of liver cancer patients. 3
The Barcelona Clinic Liver Cancer (BCLC) staging system was suggested by Llovet in 1999 and was later revised through the American Association for Liver Disease Research 4 in 2005. The BCLC staging system includes 4 prognostic factors: (1) Overall patient status, (2) tumor status, (3) hepatic function, and (4) alternative treatment methods. Currently, the BCLC staging system, which includes treatment recommendations concerning various HCC stages, is accepted worldwide. 1 The PS (performance status) score, status of tumor (size, amount, invasion of the portal vein and metastasis) and liver function status according to the Child‒Pugh class were comprehensively considered. The BCLC stage system defines the early and intermediate HCC stages as stage 0 (very early stage), stage A (early stage), and stage B (intermediate stage). The treatment of patients in each stage varies. Early/intermediate HCC patients are eligible for surgery-based therapy or other forms of intervention due to their early detection ability. Operative treatment involving liver resection (LR), ablation, or transplantation is available when the patient is in a very early stage (BCLC 0) or early stage (BCLC A). However, if the patient is in the intermediate stage (BCLC B), only TACE is appropriate. The prognoses of patients with early and intermediate disease are markedly better than those of patients with stage C (late) or D (terminal stage) disease.
Computed tomographic (CT) image textural analysis is an image analysis technique that has emerged in recent years. Vast-sized quantitative profiles invisible to the naked eye, representing the distribution of pixel intensity in images of the tumor, were analyzed, with space-based associations across multiple intensity levels and between morphology and textural pattern heterogeneity and relationships across the tumor/surrounding tissue. This approach is expected to have a great impact on routine clinical use. In the present study, a predictive model describing tumors through quantitative analysis of image textural profiles was established, and the feasibility of CT image texture profiles for BCLC staging of HCC was investigated.
Materials and Methods
Inclusion/Exclusion Criteria
A retrospective assessment was conducted on HCC patients confirmed through pathology at Huaian No.1 People's Hospital affiliated with Nanjing Medical University (October 2016 – June 2022). This was an exploratory, single-center, retrospective study. This study was approved by the local Institutional Review Board (Ethics number: No. YX-P-2020-117-01 [2020]) and was conducted in accordance with the Declaration of Helsinki. Informed consent was obtained from the participants. The inclusion criteria for patients were as follows: ① Enhanced CT imaging data available prior to surgery or treatment; ② CT images that included arterial phase (AP) and portal venous phase (PVP) images; and ③ complete clinical data, including the general condition of the patient, total bilirubin, albumin, and prothrombin time.
The exclusion criteria for patients were as follows: ① TACE, microwave, radiofrequency ablation or other treatments conducted prior to scanning; ② preoperative lesion rupture and bleeding, obscuring lesion imaging; ③ presence of severe fatty liver; and ④ BCLC stage C or D.
The patient recruitment process is shown in Figure 1. The reporting of this study conforms to STROBE guidelines. 5

Patient recruitment process.
Clinical Information
Overall, datasets from 362 HCC patients validated through pathological examination were retrieved, among them, 190 were ultimately included in the study and aged 32 to 81 years (mean: 57.87 ± 9.85 years). Forty were female, and 150 were male. According to the BCLC staging system for liver cancer, 6 38 patients were in stage 0, 76 were in stage A, and 76 were in stage B. No significant variations were observed within basic case profiles across cohorts.
CT Scanning
A Siemens Somatom Definition dual-source 64-slice CT scanner, using CARE dose mode, a tube voltage of 120 kV, a layer thickness of 5 mm, and a layer spacing of 5 mm, was used for imaging lesions. Supine-positioned individual scan patients were administered 80–100 mL of ioversol (iodine content: 320 mg/mL) via the median cubital vein using a high-pressure syringe (3 mL/s). Arterial/portal vein phase scans were then conducted 30 and 50 s after beginning contrast agent injection.
Radiomics Feature Extraction
Through layered sample collection methodology, patients were randomly allocated within either the training or test cohort at a ratio of 8:2. The data from the training cohort were used for constructing the profile selection model.
Region of interest (ROI) segmentation: 2 expert clinicians were employed for imaging (Doctors A and B) and delineated the target lesion border in layers across both the arterial and portal vein imaging phases using ITK-SNAP® (www.itksnap.org). A ROI was then outlined, allowing a three-dimensional whole-tumor ROI to be defined. For each patient, each lesion was outlined by Doctor A twice and once by Doctor B; 3 ROIs were defined for each patient.
High-throughput Profile Extraction: First, image resampling and grayscale discretization preprocessing were performed on the images. A volume of 1 × 1 × 1 mm3 was selected for image resampling using a palette of 64 gray levels to improve the speed of calculation of textural profiles and reduce noise interference. Anaconda® with Python 3 software (https://www.anaconda.com) was used to execute exampleCT.yaml (https://github.com/Radiomics/PyRadiomics). Profile extraction was first performed on the CT images of each patient, and 217 profile parameters were collected from individual phases, such as histogram, geometric, and textural profiles. Because there were 3 ROIs for each patient, 3 sets of radiomics profiles were created.
Profile Screening: A consistency test was first conducted by researchers to ensure the repeatability of the radiomics profiles. The reproducibility of inter- and intra-observer for extracted features was determined by intraclass correlation coefficients (ICCs). Profiles for which the ICC, both within and across cohorts, was >0.75 were retained, while profiles with nearly zero variance were deleted within the next step. Subsequently, Spearman correlation analysis further screened radiomics profiles, eliminating those with correlation coefficients >0.9. Profiles with a one-way variance <0.01 across the 3 cohorts were filtered. The retained profiles were subsequently imported into a least absolute shrinkage and selection operator (LASSO) regression model. The hyperparameter λ for LASSO was calculated using a 10-fold cross-validation method, and λ values yielding minimal model error were used. Profiles whose coefficients were not 0 were then retained. Finally, following regression and dimensionality reduction processing and using 10-fold cross-validation, the profiles with the best generalization capability were screened out. The selected profile parameters were subsequently used to establish a predictive model, and the Radscore was calculated. The Radscore was the total sum of the profile products plus the relevant coefficient. Radiomics profile analysis used profiles extracted by Doctor A to outline the ROI for the first time, and parameters with good repeatability (ICC > 0.75) and high stability were selected to establish a radiomics label. The flow chart is shown in Figure 2.
Flow chart of experimental steps.
Statistical Analyses
R software (http://www.Rproject.org, Version 3.4.4) was used for statistical analysis of the data. The R package DescTools was used to calculate the ICCs. The clinical parameters were analyzed by χ² test (for categorical data) and Mann-Whitney U test (for continuous data without normal distribution). The Caret package was used for data cohorting, Spearman correlation analysis, and calibration analysis. GlmNet was used for regression analysis via LASSO regression and for construction of the Radscore. The classification of radscores was performed following the Wilcoxon test. Logistic regression was used for single factor and multivariate analysis. The pROC package was used to plot receiver operating characteristic (ROC) curves and evaluate the Radscore as a predictive model. The performance of the prediction model was evaluated with ROC curve and the corresponding area under the curve (AUC). The sensitivity, specificity, negative predictive value (NPV) and positive predictive value (PPV) was calculated according to the cut-off value of ROC. The DeLong test was used to compare diagnostic effectiveness. A P value <.05 suggested a statistically significant difference.
Results
Three groups of clinical characteristics were compared (Table 1).
Comparison of Basic Data of Patients with Different Barcelona Clinic Liver Cancer (BCLC) Stages.

Among the 190 patients, 38 had BCLC stage 0 disease, 76 had BCLC stage A disease and 76 had BCLC stage B disease. There were no significant differences in age, sex, degree of histopathological differentiation, with or without serum AFP elevation (>400 µg/L), Hepatitis B virus infection, and liver cirrhosis among the 3 groups (P > .05).
The intra- and interclass coefficients for all the ROIs are 0.755–0.999; 0.759–1.000, respectively.
Radiomics Analysis of the AP for Patients With Different BCLC Stages of HCC
LASSO was used to screen a total of 10 AP textural profiles, namely, original_glszm_ZoneEntropy, original_glszm_LargeAreaHighGrayLevelEmphasis, log_sigma_1_0_mm_3D_glszm_ZoneEntropy, log_sigma_1_0_mm_3D_firstorder_Maximum, original_glszm_LargeAreaLowGrayLevelEmphasis, original_gldm_SmallDependenceEmphasis, original_glszm_SmallAreaEmphasis, log_sigma_1_mm_3D_glrlm_ShortRunEmphasis, log_sigma_1_0_mm_3D_glszm_LargeAreaLowGrayLevelEmphasis, and log_sigma_2_0_mm_3D_firstorder_Median. The weighting coefficients for each profile were used within the model (Figure 3). The sensitivity, specificity, and positive/NPVs for the training cohort were 100.0%, while the AUC was 1.000 (Figure 4). The overall accuracy rate was 100%. Within the test cohort, the AUC values associated with arterial-phase images and BCLC stage 0, A, and B disease were 0.99, 0.98, and 0.99, respectively. The overall accuracy rate was 92.7% (Table 2).

Radiomics profiles and their weights obtained from arterial-phase image screening.

ROC curves for the prediction of BCLC stage HCC using the CT arterial-phase radiomics model ([A] represents the training cohort and [B] represents the test cohort). Note: “0” stands for “stage 0”, “1” stands for “stage A”, “2” stands for “stage B”. Abbreviations: HCC, hepatocellular carcinoma; BCLC, Barcelona Clinic Liver Cancer; ROC, receiver operating characteristic curve; CT, computed tomographic.
Radiomic Analysis Results for the Arterial Phase for Patients with Different BCLC Stages of HCC.
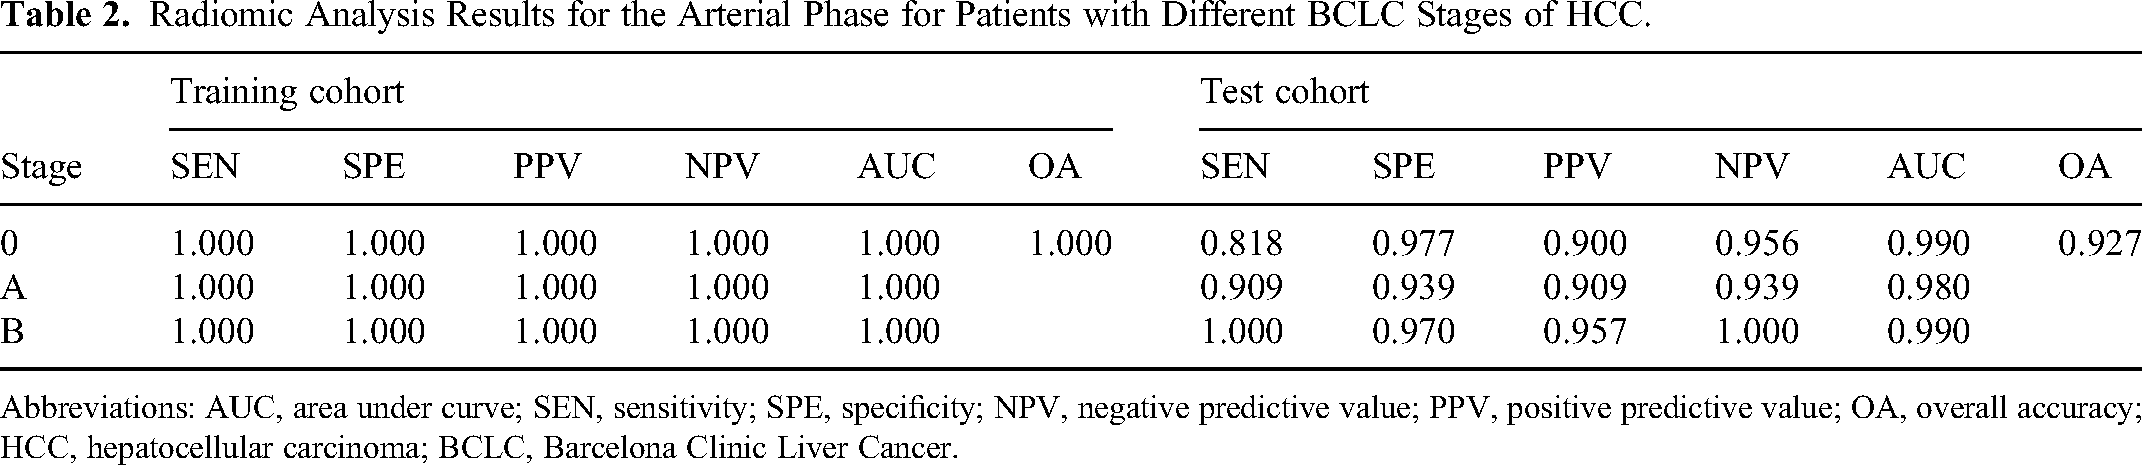
Abbreviations: AUC, area under curve; SEN, sensitivity; SPE, specificity; NPV, negative predictive value; PPV, positive predictive value; OA, overall accuracy; HCC, hepatocellular carcinoma; BCLC, Barcelona Clinic Liver Cancer.
Radiomics Analysis of the Venous Phase for Patients with Different BCLC Stages of HCC
Using LASSO, a total of 10 VP textural profiles were screened when scanned in the PVP, namely, original_glszm_LargeAreaHighGrayLevelEmphasis, original_glszm_ZoneEntropy, original_glszm_LargeAreaLowGrayLevelEmphasis, log_sigma_0_mm_3D_glrlm_ShortRunEmphasis, log_sigma_1_0_mm_3D_glszm_ZoneEntropy, log_sigma_1_0_mm_3D_glszm_GrayLevelNonUniformity, log_sigma_1_0_mm_3D_firstorder_Maximum, log_sigma_1_0_mm_3D_gldm_DependenceVariance, log_sigma_2_mm_3D_glcm_Imc1, and original_gldm_DependenceEntropy. The weighting for each profile is shown in Figure 5. Within the training cohort, the sensitivity, specificity, and positive/NPVs for detecting stages 0, A, and B were 100.0% in each patient, while the AUC was 1.000 (Figure 6). The overall accuracy was 100%. Within the test cohort, the AUCs associated with portal vein images and BCLC stages 0, A, and B disease were 0.98, 0.95, and 0.99, respectively, with an overall accuracy of 90.9% (Table 3).

Radiomics profiles and their weights were obtained from portal vein phase image screening.

ROC curves for the prediction of BCLC stage HCC using the CT venous-phase radiomics model ([A] represents the training cohort, [B] represents the test cohort). Note: “0” stands for “stage 0,” “1” stands for “stage A,” “2” stands for “stage B.” Abbreviations: HCC, hepatocellular carcinoma; BCLC, Barcelona Clinic Liver Cancer; ROC, receiver operating characteristic curve; CT, computed tomographic.
Radiomics Analysis Results of the Portal Vein Phase for Patients with Different BCLC Stages of HCC.

Abbreviations: AUC, area under curve; SEN, sensitivity; SPE, specificity; NPV, negative predictive value; PPV, positive predictive value; OA, overall accuracy; HCC, hepatocellular carcinoma; BCLC, Barcelona Clinic Liver Cancer.
ROC curve analysis of different radiomics models in the test cohort
The DeLong test was used to compare the diagnostic efficacy of the arterial-phase and venous-phase-based radiomics models (Tables 4, 5). Moreover, there was no significant difference between the 2 cohorts (P > 0.05).
ROC Curve Analysis of the Different Radiomics Models in the Test Cohort.
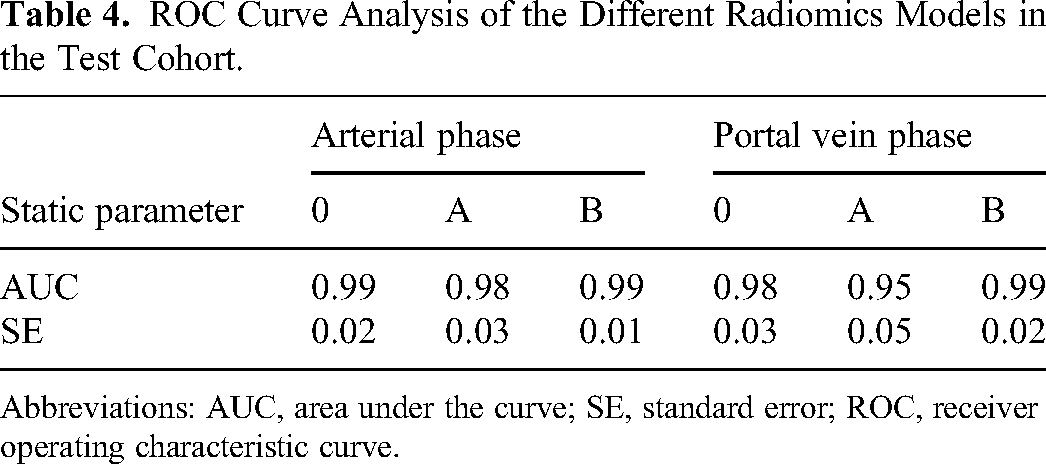
Abbreviations: AUC, area under the curve; SE, standard error; ROC, receiver operating characteristic curve.
DeLong Test to Compare the Diagnostic Effectiveness of Different-Phase Radiomics Models in the Test Cohort.

Discussion
In recent years, the heterogeneity of biogenetic tumor profiling has emerged as a major research focus within oncology. 7 Patient prognoses are mainly founded upon tumor heterogeneity and are determined through assessing pathology-based features, including histology-based tumor grading 8 and microvascular invasiveness. 9 However, the current methods for prognostic assessment of HCC patients using acquired images are nevertheless rudimentary and are generally based only on radiologists’ subjective analysis of tumor size, number, and vascular invasion. Considering the complexity of the information within tumor images, it is clear that data representing more than just the size and number of tumors are required for prognostic judgment and that advanced image analysis tools could extract useful information. 10
Radiomics can measure the distribution of pixel intensity in images of and surrounding a tumor, the intensity distribution in a spatial region image across different intensity levels, spatial associations for differing intensity levels, and morphological and textural feature heterogeneity, together with associations across tumors and surrounding tissue. Moreover, multiple quantitative profiles cannot be recognized by the naked eye, thus representing a considerable advantage for tumor diagnosis, treatment, and prognostic analysis. Li et al 11 constructed preoperative models based on CT radiomics and radiologic and clinical features to predict recurrence-free survival (RFS) after LR in patients with BCLC stage 0 to B stage HCC and to determine the prognosis. The results showed that the integrated model combining the RS and clinical factors could more effectively predict RFS after the LR of BCLC stage 0 to B stage HCC patients and could effectively stratify patients according to prognostic risk. Wang et al 12 investigated the feasibility of pretherapeutic CT radiomics-based nomograms for predicting the overall survival of patients with nondistant metastatic BCLC stage C HCC who underwent stereotactic body radiotherapy, and the resulting model has great potential. Both studies above demonstrate that CT radiomics can be used to predict the therapeutic effect and prognosis of HCC patients in different BCLC stages with different treatment modalities. Xun et al 13 combined clinical and radiomic-based characteristics to construct a model for predicting HCC microvascular invasion (MVI) and patient prognosis and the model demonstrated good detection efficiency. Stoehr et al 14 found that radiomics analysis using imaging at initial diagnosis might be a useful tool for identifying patients with HCC who are at risk for portal vein infiltration during follow-up, and that would benefit from closer monitoring. The 2 studies prove that radiomics analysis is useful for predicting both MVI and macrovascular invasion of HCC which determine the patient's prognosis. Some other researchers explored the relationship between radiomics and tumor microenvironment. For example, Feng et al 15 constructed a CT radiomics model to predict the macrotrabecular-massive (MTM) subtype and to investigate the underlying immune infiltration patterns and declared that accurate prediction of the MTM subtype in patients with HCC was achieved using a CT radiomics model, which was also associated with defective humoral immunity. All these investigations and researches prove CT radiomics analysis to be a valuable tool for the study of HCC. And our study aimed to probe the feasibility of a CT radiomic model for predicting early and intermediate HCC using BCLC staging.
CT is mostly used in the diagnosis/follow-up of HCC patients in the clinic. However, HCC lesions are often unclear on plain CT images, making it difficult to outline the lesions or clarify their scope. Therefore, ensuring the accuracy of an entire tumor ROI identified by the naked eye is difficult. Therefore, enhanced CT arterial-phase and portal vein-phase images were selected for analysis. These results demonstrated that the AUCs for the 0, A, and B stages in the arterial-phase radiomic profile prediction of BCLC staging were 0.99, 0.98, and 0.99, respectively, for a total accuracy of 92.7%. For portal vein imaging prediction, the AUC for BCLC stages 0, A, and B were 0.98, 0.95, and 0.99, respectively, with a total accuracy of 90.9%. According to the radiomic profiles obtained from arterial and portal vein phase imaging and weightings, the discriminating parameters related to gray level size zones (GLSZMs) represent a significant proportion of the radiomic profiles. A gray-level area is considered to be adjacent voxels with identical gray-level intensities. The underlying reasons for this observation require additional exploration. The dataset used in this study revealed that radiomic profiles from the arterial and portal vein phases of HCC can be used to distinguish BCLC stages at stages 0, A, and B. We can help clinicians choose the right treatment decisions by establishing a CT radiomic model for predicting early (stages 0, A) and intermediate (stage B) HCC.
However, the present study has the following shortcomings: ① Single-center study involved a small sample size. ② The included patients required both an abdominal scan and an enhanced CT examination performed at the same time, which may have caused selection bias. ③ Pathological diagnoses for BCLC stages C and D were not added within this study (reduced numbers). A larger sample size is needed, possibly because of the use of multiple centers.
In summary, a CT radiomic model can be used to stratify HCC patients according to BCLC stage, and early and intermediate clinical stages can be satisfactorily predicted using these characteristics. As the technique continues to advance in the future, we will be able to identify additional correlations across radiomic profiles and clinical, pathological, and prognostic aspects and provide superior objective and stable evaluation methods for clinical diagnosis and treatment.
Supplemental Material
sj-png-1-tct-10.1177_15330338241245943 - Supplemental material for Feasibility Study of Computed Tomographic Radiomics Model for the Prediction of Early and Intermediate Stage Hepatocellular Carcinoma Using BCLC Staging
Supplemental material, sj-png-1-tct-10.1177_15330338241245943 for Feasibility Study of Computed Tomographic Radiomics Model for the Prediction of Early and Intermediate Stage Hepatocellular Carcinoma Using BCLC Staging by Han Dong, Lu Yang, Duan Shaofeng and Guo Lili in Technology in Cancer Research & Treatment
Footnotes
Abbreviations
Acknowledgments
The authors thank the Editideas team for editing the article.
Author's Contributions
Li-li Guo designed the study and revise the article. Shao-feng Duan conducted the statistical analysis. Dong Han summarized the results and drafted the manuscript. Yang Lu collected references and made the figures. Final approval of manuscript was provided by all authors.
Availability of Data and Materials
All data generated or analyzed during this study are included in this published article. onsent for publication was provided by all authors.
Declaration of Conflicting Interests
The authors declared no potential conflicts of interest with respect to the research, authorship, and/or publication of this article.
Funding
The authors received no financial support for the research, authorship, and/or publication of this article.
Ethical Approval
The experimental protocol was established, according to the ethical guidelines of the Helsinki Declaration. Ethical approval was obtained by the local Ethics Committee of The Affiliated Huaian No.1 People's Hospital of Nanjing Medical University (Issue No. YX-P-2020-117-01 [2020]).
Informed Consent
Written informed consent was obtained from individual or guardian participants. A retrospective assessment was conducted on HCC patients confirmed through pathology at Huaian No.1 People's Hospital affiliated with Nanjing Medical University (October 2016–June 2022).
Supplemental Material
Supplemental material for this article is available online.
References
Supplementary Material
Please find the following supplemental material available below.
For Open Access articles published under a Creative Commons License, all supplemental material carries the same license as the article it is associated with.
For non-Open Access articles published, all supplemental material carries a non-exclusive license, and permission requests for re-use of supplemental material or any part of supplemental material shall be sent directly to the copyright owner as specified in the copyright notice associated with the article.