
Abstract
Purpose
Our study aimed to investigate the potential of radiomics with DCE-MRI for predicting Ki-67 expression in invasive ductal breast cancer.
Method
We conducted a retrospective study including 223 patients diagnosed with invasive ductal breast cancer. Radiomics features were extracted from DCE-MRI using 3D-Slicer software. Two Ki-67 expression cutoff values (20% and 29%) were examined. Patients were divided into training (70%) and test (30%) sets. The Elastic Net method selected relevant features, and five machine-learning models were established. Radiomics models were created from intratumoral, peritumoral, and combined regions. Performance was assessed using ROC curves, accuracy, sensitivity, and specificity.
Result
For a Ki-67 cutoff value of 20%, the combined model exhibited the highest performance, with area under the curve (AUC) values of 0.838 (95% confidence interval (CI): 0.774–0.897) for the training set and 0.863 (95% CI: 0.764–0.949) for the test set. The AUC values for the tumor model were 0.816 (95% CI: 0.745–0.880) and 0.830 (95% CI: 0.724–0.916), and for the peritumor model were 0.790 (95% CI: 0.711–0.857) and 0.808 (95% CI: 0.682–0.910). When the Ki-67 cutoff value was set at 29%, the combined model also demonstrated superior predictive ability in both training set (AUC: 0.796; 95% CI: 0.724–0.862) and the test set (AUC: 0.823; 95% CI: 0.723–0.911). The AUC values for the tumor model were 0.785 (95% CI: 0.708–0.861) and 0.784 (95% CI: 0.663–0.882), and for the peritumor model were 0.773 (95% CI: 0.690–0.844) and 0.729 (95% CI: 0.603–0.847).
Conclusion
Radiomics with DCE-MRI can predict Ki-67 expression in invasive ductal breast cancer. Integrating radiomics features from intratumoral and peritumoral regions yields a dependable prognostic model, facilitating pre-surgical detection and treatment decisions. This holds potential for commercial diagnostic tools.
Introduction
Breast cancer holds the top position for cancer-related deaths among women, 1 with its incidence increasing each year. 2 Invasive ductal carcinoma emerges as the most prevalent type of breast cancer, 3 and the Ki-67 marker has emerged as a significant prognostic factor for the disease. 4 A higher Ki-67 index points towards more active and aggressive cell division, 5 correlating with a worse prognosis and a greater likelihood of recurrence, as several meta-analyses have shown.6,7 Furthermore, the Ki-67 index helps identify molecular subtypes of breast cancer, distinguishing between Luminal A and Luminal B tumors. 8 Despite this, the cut-off value of Ki-67 expression remains disputed, 9 with the St. Gallen consensus recommending a value of 14% for poor prognosis in 2011, a value of 20% in 2013, and a range of 20–29% in 2015.9,10 The International Ki-67 in Breast Cancer Working Group (IKWG) has since updated the guidelines, with Ki-67 ≥ 30% classified as high expression, used to guide chemotherapy decisions for early breast cancer patients. 11
Radiomics enables the extraction of mineable data from digital medical images by utilizing a high-throughput feature extraction method that analyzes a multitude of quantitative features, including but not limited to shape, intensity, size, and volume.12,13 Radiomic features help in the diagnosis, 14 molecular typing, 15 prediction of treatment response,16,17 and prognosis of breast cancer patients. DCE-MRI not only shows the morphological features of the tumor but also provides information on the blood perfusion, which is of great value in breast cancer MRI. DCE-MRI has important applications in predicting tumor molecular typing, Ki-67 expression status, 15 and lymph node metastasis.18,19
Previous inquiries into the use of DCE-MRI for diagnosing breast cancer have centered on the intratumoral region, neglecting the peritumoral region. 20 Research indicates that the microenvironment surrounding the tumor is pivotal in the advancement and development of breast cancer. 21 In addition to tumor cells, host stromal cells, such as cancer-associated fibroblasts, exist in tumors. These host stromal cells significantly alter the peritumor stroma, creating a milieu that favors tumor growth. 22 Invasive ductal carcinoma was shown to have increased Ki-67 proliferation indexes when high-grade cancer-associated fibroblasts were present, according to a prior study. 23 Essential biological information, which may serve as underlying predictive markers, is present in the peritumoral area, such as vascular development, lymphatic activity, peritumoral invasion of the lymphatic system, and immune responses in peripheral breast tissue.24–28 It was discovered that combining radiomic features of the intratumor with the perineurium helped predict lymph node metastasis in breast cancer. 29 Furthermore, a combined model of intratumor and peritumor radiomic characteristics derived from six functional parameter maps computed from time-intensity curves of DCE-MRI may aid in increasing the precision of preoperative Ki-67 expression status, according to another study. 30 This work aims to build a radiomics model based on five machine learning algorithms and radiomics characteristics to assess the expression status of Ki-67 under two distinct cut-off values.
Materials and Methods
Patients
The Ethics Committee of our hospital approved this retrospective study (approval code: 2020F048), which utilized anonymous data, and waived the need for informed consent. The study analyzed the MRI results of 303 breast cancer patients who received pre-surgery treatment at our hospital from January 2018 to March 2022. The inclusion criteria were: (1) diagnosed breast cancer patients as confirmed by the pathological assessment of biopsy specimens; (2) no preoperative chemoradiotherapy or endocrine therapy; (3) DCE-MRI within one week prior to surgery; and (4) all patient MRI examinations and image post-processing done on the same machine. The exclusion criteria were: (1) other types of breast cancer; (2) lack of pathology or DCE-MRI data (Ki-67 status unknown); and (3) presence of non-mass enhancement in the tumor areas. Finally, 223 patients were enrolled in this study (Figure 1), and the workflow is shown in Figure 2. First, tumor margins were outlined layer-by-layer for each image layer to obtain a 3D tumor image. Then, the peritumor area was obtained by expanding 4 mm outward from the tumor edge. Radiomic feature were extracted using 3D-Slicer software, and Elastic net was applied for feature screening. Second, we assessed five machine learning algorithms to predict the Ki-67 expression level and selected the best one. Based on the best machine learning algorithm and selected radiomic features for each ROI, we established three radiomic models: tumor model, peri-tumor model, and combined model. Finally, we evaluated the performance of the radiomic models using AUC, sensitivity, and specificity.

A flow chart of the patient recruitment process in this study.

Workflow of the study. First, the tumor boundary was delineated layer by layer on each image, and 3D segmented tumor images were obtained using 3D Slicer. Subsequently, a morphological operation of dilation was conducted to segment the surrounding tumor up to a radial distance of 4 mm to obtain the peritumoral ROI. Radiomic features were then extracted using the radiomics plug-in in 3D Slicer software. After normalizing the parameters and reducing dimensionality, characteristic parameters were selected and classified using Elastic Net regression. Next, five machine learning algorithms were assessed to predict the Ki-67 expression level, and the best one was selected. Based on the best machine learning algorithm and selected radiomic features from each ROI, three radiomic models were established: the Tumor model, Peri-tumor model, and Combined model. Finally, the discrimination performance of the radiomic models was evaluated using receiver operating characteristic (ROC) analysis.
Ki-67 Index Analysis
Before the operation, biopsy materials were collected using the tru-cut method and analyzed through immunohistochemistry. 31 The percentage of Ki-67 expression was calculated to determine the severity of the lesions, which were then classified into two groups based on Ki-67 index cut-off values of 20% and 29%. If the Ki-67 positivity was higher than 20% or 29%, it was classified as high, otherwise, it was considered low.
MRI Technique
For this research, the MRI scans were performed utilizing a Siemens Avanto MRI system equipped with an eight-channel breast coil.
32
The patient was placed in a prone position, while a 1.5-Tesla machine was utilized for the scans. The parameters for T1-weighted imaging (T1WI) and T2-weighted imaging (T2WI) were as follows:
T1WI Parameters: Repetition Time (TR) / Echo Time (TE) = 3.5 ms/1.4 ms Flip Angle = 15 degrees Slice Thickness = 1 mm Image Matrix = 448 × 381 Field of View = 360 × 360 mm T2WI Parameters: Repetition Time (TR) / Echo Time (TE) = 4840 ms/53 ms Slice Thickness = 4 mm Inversion Time = 165 ms Image Matrix = 448 × 381 Field of View = 340 × 340 mm Repetition Time (TR) / Echo Time (TE) = 3.5 ms/1.4 ms Flip Angle = 15 degrees Slice Thickness = 1 mm Image Matrix = 448 × 381 Field of View = 360 × 360 mm
For dynamic contrast-enhanced MRI (DCE-MRI), the parameters were:
A substance called gadolinium-based contrast agent (Gd-DTPA; made by Bayer Healthcare Pharmaceuticals in Berlin, Germany) was given to the patient through a mechanical power injector. The amount given was 0.2 mmol/kg followed by 15–20 cc of saline. A total of six phases were captured, including one phase of flattening and five phases of enhancement, each lasting 120 s without any intermittent scans. We analyzed the first-contrast sequence taken between 90 and 110 s because this time window corresponds to the peak distribution of the contrast agent within the tissues. During this period, the contrast between malignant lesions and normal tissues is most pronounced, allowing for clearer differentiation and better diagnostic value. Additionally, capturing images within this timeframe helps reduce motion artifacts and ensures consistency across different scans and patients.
29
Feature Selection and Radiomic machine learning Construction
We acquired early dynamic contrast-enhanced T1 weighted magnetic resonance images (C + MRI) in DICOM format from our hospital's PACS system for our research. 33 Two highly skilled radiologists, possessing a combined experience of ten years in diagnosing breast MRI, utilized the 3D-Slicer software (version 4.11) to demarcate a circular region of interest (ROI). The radiologists were unaware of any clinical or histopathological information. In the event of any discrepancies, a senior radiologist with fifteen years of experience was consulted to render the final verdict. Based on the 3D-Slicer software, tumor margins are outlined layer by layer from each image to obtain a 3D tumor image, and then the peritumor area was obtained by expanding 4 mm outward from the tumor edge.29,34 During this segmentation process, any necrosis, cystic lesions, and bleeding areas within the tumor were considered. To ensure alignment with visual assessment, a subset of images was verified by an experienced radiologist. The first-order features, such as mean intensity, skewness, and kurtosis, were compared with visual characteristics of the segmented regions, demonstrating good agreement. The resulting 3D segments were standardized using Z-score normalization to ensure consistent pixel values across different images. Histogram-based features were extracted using a bin width of 25 for efficient and detailed capture. Radiomic features were subsequently extracted using the radiomics plug-in in 3D-Slicer software. In total, 841 radiomic features per ROIs (intratumoral, peritumoral, combined regions) were extracted (First Order Features: 162, Shape Features (3D): 4, Gray Level Co-occurrence Matrix (GLCM) Features: 216, Gray Level Size Zone Matrix (GLSZM) Features: 144, Gray Level Run Length Matrix (GLRLM) Features: 144, Neighbouring Gray Tone Difference Matrix (NGTDM) Features: 45, Gray Level Dependence Matrix (GLDM) Features: 126).
The training and test sets were constructed by automatically and randomly collecting data in ratios of 0.7 and 0.3, respectively. To reduce dimensionality and ensure high-quality radiomic features, we first calculated the intra-class correlation coefficient (ICC) and screened for features with a value greater than 0.75. We subsequently employed the elastic net regularization method to select the optimal subset of characteristics for building radiomic models. Elastic net combines the penalties of both the L1 (LASSO) and L2 (ridge) regularization methods, allowing for the selection of relevant features while mitigating multicollinearity issues. 35 To avoid overfitting, we determined the optimal elastic net regularization parameters “alpha” and “lambda” using 10-fold cross-validation. We then performed radiomic feature selection for intratumoral, peritumoral, and combined areas based on Ki-67 status, using cut-off values of 20% and 29%. We evaluated five machine learning algorithms to predict Ki-67 expression levels between two cut-off values (20% vs. 29%). These algorithms included random forest, support vector machine, logistic regression, k-nearest neighbors, and naive bayes. We applied these algorithms to tumor, peritumor, and combined models for performance evaluation. To determine the optimal algorithm, we calculated the area under the receiver operating characteristic curve (AUC) for each model under cross-validation and computed the average AUC value to assess their predictive capability. After selecting the best machine learning algorithm, we proceeded to establish three radiomic models: the tumor model, peritumor model, and combined model, utilizing selected radiomic features from each region of interest. These models were developed to predict Ki-67 expression levels for cut-off values (20% vs. 29%).
Statistical Analyses
To compare traits of high and low Ki-67 groups, t-tests and chi-square/Fisher's exact tests were used for continuous/categorical variables, respectively. A two-tailed P-value < 0.05 was considered significant. R software (version 4.2.2) and jupyter notebook (version 6.4.8 in Python 3.9) were used for analysis, feature selection, machine learning, and plotting. We evaluated the performance of models by calculating various metrics including AUC, accuracy, sensitivity, and specificity, using both training and test datasets.
Results
Patient Characteristics
Table 1 presents the clinical and immunohistochemical features of patients categorized into high and low Ki-67 groups. A total of 223 patients were chosen for statistical analysis based on defined inclusion and exclusion criteria. For different cut- off values, there was no noteworthy difference in mean age between the high and low Ki-67 expression groups (P = 0.094 and 0.050 for cut-off values of 20% and 29% respectively). However, there were significant differences in tumor volume (7.1 ± 12.4 vs. 2.2 ± 4.1, P < 0.001, and 7.4 ± 12.8 vs. 3.0 ± 5.3, P < 0.001), ER status (114/45 vs. 60/4, P = 0.001, and 93/43 vs. 81/6, P < 0.001), PR status (90/69 vs. 54/10, P < 0.001, and 71/65 vs. 73/14, P < 0.001), and HER2 status (48/111 vs. 8/56, P = 0.01, and 43/93 vs. 13/74, P = 0.008) between the high and low Ki-67 expression groups of the cut-off values as 20% and 29%. In both the high and low Ki-67 expression groups, there were significant differences in molecular subtype (5/104/22/28 vs. 38/22/2/2, P < 0.001, and 3/85/21/27 vs. 40/41/3/3, P < 0.01) between the cut-off values of 20% and 29%.
Patient characteristic.

P < 0.05 is considered statistically significant. ER estrogen receptor, PR progesterone receptor, HER2 human epidermal growth factor receptor 2.
Extracting and Screening Radiomic Features
A total of 841 radiomic features were extracted from intratumoral, peritumoral, and combined regions, including first-order statistical features describing voxel intensity such as mean, maximum and minimum values, three-dimensional lesion size, and shape features. Texture features include gray-level co-occurrence matrix, gray-level run length matrix, gray-level size region matrix, neighborhood gray-level difference matrix, and gray-level difference matrix. The ICC of each radiomic feature between he two observers was calculated, and 668 features with good consistency were screened out, including features with ICC > 0.75. Then, Elastic Net was used to screen the features, with alpha set to 0.1 and an L1 ratio of 0.7 (Figure 3). The features with non-zero coefficients in Elastic Net were used to construct the model. Finally, 7, 8, and 5 optimal features were selected from the intratumoral, peritumoral, and combined regions, respectively, at a cut-off value of 20%. Similarly, at a cut-off value of 29%, 9, 9, and 7 optimal features were selected from these regions, respectively. (Figure 4)
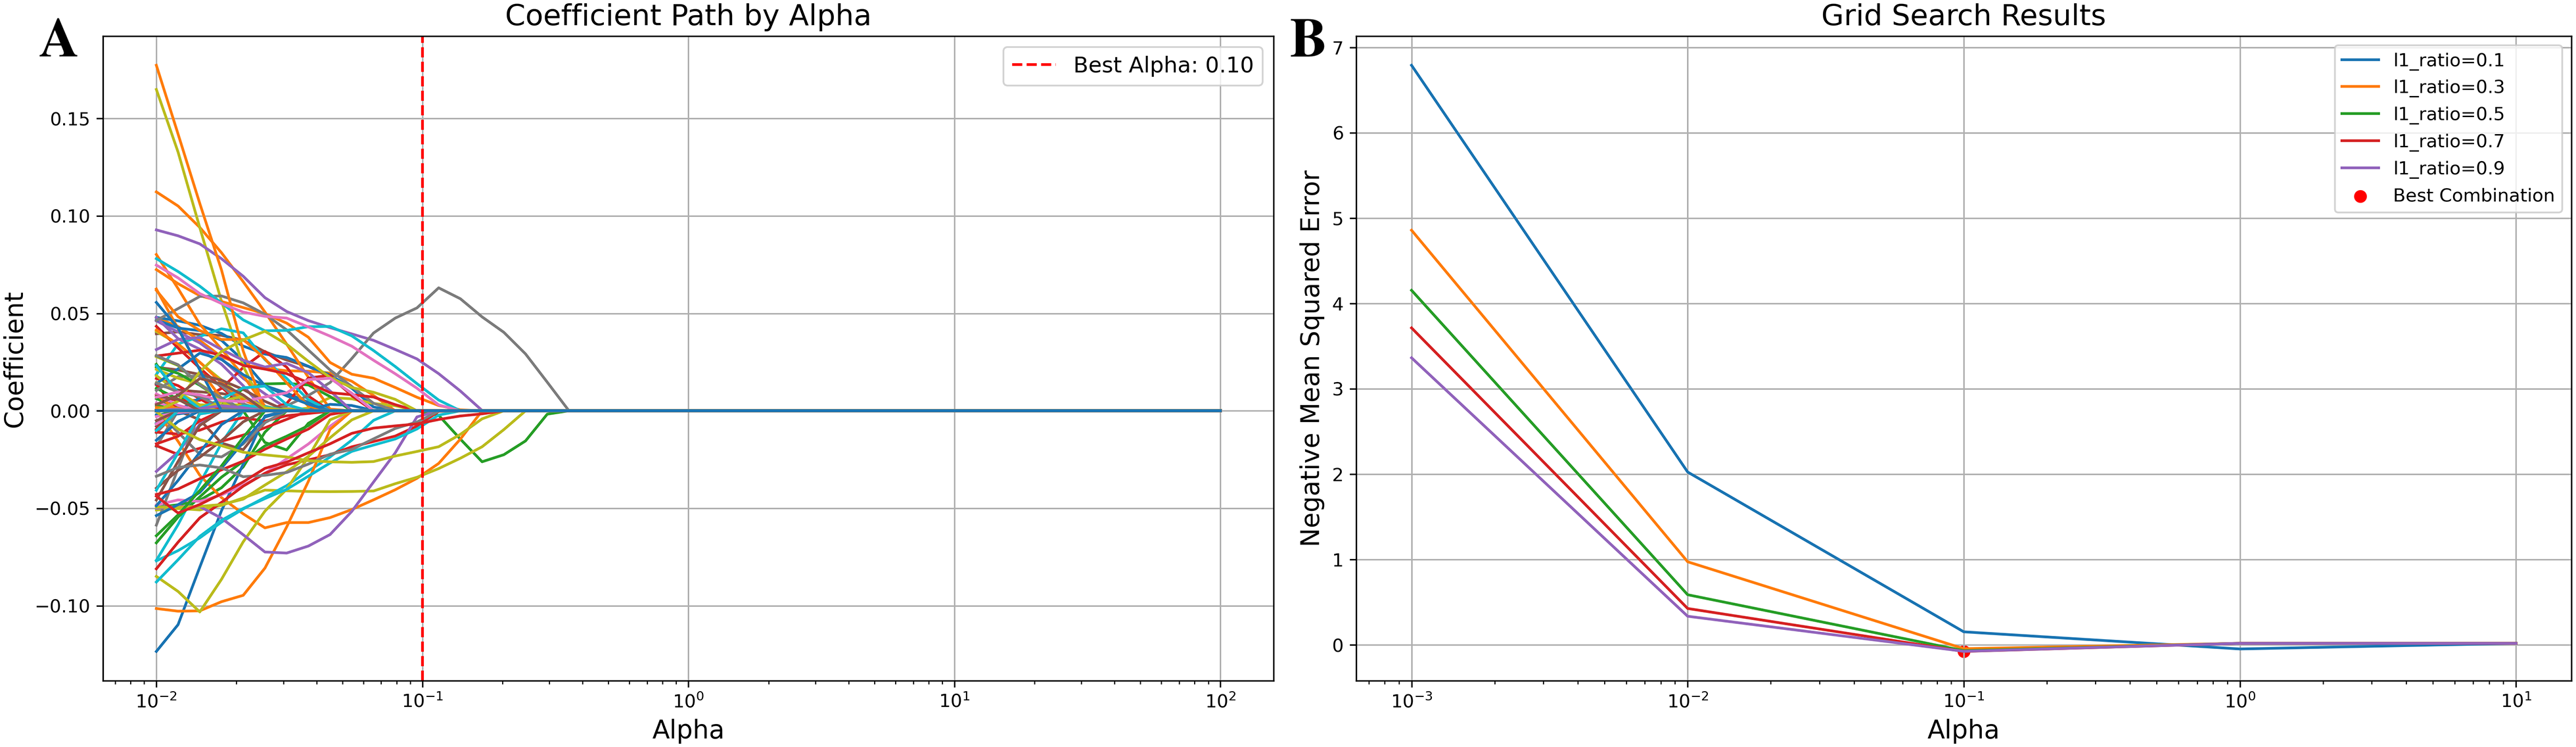
Feature selection using the Elastic Net (take the intratumoral region for example). (A) Variation of Feature Coefficients with Regularization Parameter in Elastic Net. The figure shows the variation of feature coefficients with different regularization parameters (alphas) in Elastic Net regularization. Each line represents the coefficient of a specific feature as alpha changes. The red dashed line indicates the best alpha value selected by grid search. The x-axis is in logarithmic scale to cover a wide range of alpha values. (B) Grid Search Results. The figure illustrates the grid search results for the Elastic Net model, showing how the negative mean squared error changes with different values of the regularization parameter (Alpha) for various L1 ratios. Each line represents the performance for a specific L1 ratio, with the x-axis representing the Alpha values in logarithmic scale.

Feature Selection using Elastic Net. The figure displays features selected from tumor (A/a), peri-tumoral (B/b), and combined (C/c) regions at Ki-67 cut-off values of 20% and 29%. Each bar represents a feature, and its length indicates its importance in the predictive model.
Performance of Five Machine Learning Algorithms and Radiomic Models
We randomly split the data into training and test sets in a 7:3 proportion. To predict Ki-67 expression levels in tumor, peritumor, and combined models, we employed five diverse machine learning algorithms comprising random forest, support vector machine, logistic regression, k-nearest neighbors, and naive bayes. Based on the evaluation results of the model algorithm, with cross-validation, when the Ki-67 cut-off value is 20%, the Naive Bayes algorithm performs best for the tumor model with a mean AUC of 0.802, while logistic regression is optimal for the peritumor (AUC, 0.810) and combined models (AUC, 0.793). However, when the cut-off value is 29%, Naive Bayes performs best across all models (AUC: 0.779, 0.833, 0.796, respectively). Table 2 presents the average AUC values for the five machine learning algorithms following 5-fold cross-validation. Detailed fold-specific results, including AUC, accuracy, sensitivity, and specificity, are provided in Supplementary CSV. When setting the Ki-67 cut-off to 20%, the combined model provided the most accurate prediction with AUC values of 0.838 (95%CI: 0.774–0.897) and 0.863 (95%CI: 0.764–0.949) for both the training and test sets. The AUC values of the tumor model were 0.816 (95%CI: 0.745–0.880) and 0.830 (95%CI: 0.724–0.916), and those of the peritumor model were 0.790 (95%CI: 0.711–0.857) and 0.808 (95% CI: 0.682–0.910). Table 3 presents the performance metrics. To further evaluate the performance improvement, we calculated the Net Reclassification Improvement (NRI) and Integrated Discrimination Improvement (IDI) for each model. For the 20% cut-off, the NRI values for the Combined Model compared to the Tumor Model and Peri-Tumor Model were 0.14 and 0.07, respectively, with IDI values of 0.12 and 0.11. Delong's test demonstrated that the Combined Model significantly outperformed both the Tumor Model (p < 0.05) and the Peri-Tumor Model (p < 0.05). Similarly, for the 29% cut-off, the NRI values for the Combined Model compared to the Tumor Model and Peri-Tumor Model were 0.11 and 0.14, respectively, with IDI values of 0.13 and 0.15. Delong's test confirmed that the Combined Model significantly outperformed both the Tumor Model (p < 0.05) and the Peri-Tumor Model (p < 0.05). (Supplementary Table S1)
Comparison of predictive performance of five machine learning algorithms using cross-validated average AUC values for predicting Ki-67 expression levels between two cut-off values (20% vs 29%) with radiomic features from intratumoral, peritumoral, and combined regions.

ML, machine learning. CV, cross-validation. Intra, Peri, and Com indicate intratumoral, peritumoral, and combined region, respectively. RF, Random Forest. SVM, Support Vector Machine. LR, Logistic Regression. KNN, K-Nearest Neighbors. NB, Naive Bayes.
Performance of three radiomics models for Ki-67 cut-off value of 20%.

CI, confidential interval. ACC, accuracy. AUC, area under the receiver operating characteristic curve. SEN, sensitivity. SPE, specificity.
Figure 5 shows ROC curves of the three models in each dataset. Regarding the Ki-67 cut-off value of 29%, the combined model still showed the highest predictive performance. The AUC values of the training set and test set were 0.796 (95%CI: 0.724–0.862) and 0.824 (95%CI: 0.723–0.911), respectively. The AUC values of the tumor model were 0.785 (95%CI: 0.708–0.861) and 0.784 (95%CI:0.663–0.882), respectively, and the peritumor model had AUC values of 0.773 (95%CI: 0.690- 0.844) and 0.729 (95% CI: 0.603–0.847), respectively. All other performance metrics are presented in Table 4. The ROC curves of the three models in each dataset are shown in Figure 6. To further evaluate the clinical utility of our models, Decision Curve Analysis (DCA) was performed. (Supplementary Figure S1)

(A) Receiver operating characteristic (ROC) of three models for predicting Ki-67 status of cut-off value 20% in the training set. (B) ROC of three models in the test set.

(A) Receiver operating characteristic (ROC) of three models for predicting Ki-67 status of cut-off value 29% in the training set. (B) ROC of three models in the test set.
Performance of three radiomics models for Ki-67 cut-off value of 29%.

CI, confidential interval. ACC, accuracy. AUC, area under the receiver operating characteristic curve. SEN, sensitivity. SPE, specificity.
Discussion
Breast cancer is a malignant tumor that poses a serious threat to women's health, and its morbidity and mortality rates are increasing every year. Additionally, the incidence of the population is getting younger. 2 The main treatment methods include surgery, chemotherapy, radiotherapy, and endocrine therapy according to the clinicopathological type. 36 Currently, the diagnosis of breast cancer mainly depends on imaging examination and pathological biopsy. Imaging methods mainly include ultrasound, X-ray, MRI, etc. 37 MRI is frequently used to diagnose and treat breast cancer because of its excellent soft tissue and spatial resolution capabilities. 38
Studies on breast cancer have demonstrated the effectiveness of radiomics in predicting various factors such as molecular subtypes, histological grading, and lymph node metastasis. 15 Radiomics can also be used to evaluate the response to chemotherapy, determine the level of Ki-67 expression, and analyze the risk of recurrence after treatment.39–42 However, most studies concentrate on the inside of the tumor, but the area surrounding it also holds crucial details, including lymphatic and lymphocyte infiltration and edema.17,27,28,43 These factors are all linked to the advancement of the tumor. Therefore, we think that radiomics analysis of the surrounding tissue of the tumor may help to comprehensively understand the heterogeneity of breast cancer.
Utilizing DCE-MRI, this research extracted histological characteristics from both intratumoral and peritumoral regions, leading to the development of three models that predict Ki-67 expression levels with varying cut-off values. Results indicated that the highest AUC value came from the model incorporating combined features, as seen in both the training and test datasets. In a similar study, Chunli Li 30 revealed that extracting intratumoral and peritumoral imaging characteristics led to a combined model generating the highest AUC value (0.749) at a single cut-off value of 14% for Ki-67 expression. These findings align with the current study's outcomes, highlighting the significance of incorporating peritumoral features to enhance prediction model accuracy. However, our study surpassed previous results in prediction performance (AUC values of 0.863 and 0.824 for cut-off values of 20% and 29%, respectively) due to the 3D tumor segmentation, allowing comprehensive information coverage of both the tumor and surrounding region. Additionally, we constructed five machine learning models based on different algorithms, identifying the optimal algorithm and selecting the optimization model to improve prediction performance via enhanced features and algorithm selection.
Because of the increased permeability of tumor tissue, DCE-MRI can offer valuable information about tumor morphology and hemodynamics.44,45 Research has shown that the imaging features extracted from the first stage of DCE-MRI include significant Ki-67 expression characteristics in breast cancer, which can better reflect the heterogeneity and invasiveness of tumors. 46 Therefore, in our study, we used the first phase of DCE-MRI images and obtained high accuracy (0.816 and 0.764, respectively). However, some studies have indicated that the prediction of Ki-67 expression using extracted radiomics features from T2WI 36 or ADC37,38 can also achieve better prediction performance. Incorporating conventional MRI features like the Rim sign, lesion size, and peritumoral edema, as highlighted in previous studies, could further refine the prediction of Ki-67 expression in invasive ductal breast cancer. The Rim sign, as observed in diffusion-weighted MRI (DWI), has shown potential as a valuable morphological feature. For instance, Kang et al. demonstrated that the Rim sign significantly improves the specificity of DWI in distinguishing malignant from benign breast lesions, with an AUC of 0.701. 47 Moreover, Choi et al. 48 found that while the Rim sign was similarly present in both ER-positive and triple-negative breast cancers, ADC histogram analysis revealed that TNBC exhibited higher kurtosis, indicating greater tumor heterogeneity. Integrating these conventional morphological features with radiomic models could further enhance the diagnostic accuracy and provide a more comprehensive evaluation of tumor aggressiveness, particularly in predicting Ki-67 expression levels.
In addition, we have studied the predictive ability of the radiomics model under two different Ki-67 cut-off values, which are also the most widely used in the clinic, and found that it has good performance in both. A recent study on 154 patients with breast cancer 49 found that the radiomics model based on ADC image could obtain a good prediction effect with varying cut-off values of Ki-67 expression (14%, 20%). When the cut-off value is 14%, the AUC value is 0.849, and when the cut-off value is 20%, the AUC value is 0.617. The reason for the above-mentioned instability may be that most of the lesion boundaries on the ADC image are not clearly displayed, and complete segmentation of the lesions is challenging, particularly for tumors with extensive breast hyperplasia. In fact, Liang C et al. 50 obtained a relatively low AUC value of 0.740 with a cut-off value of 14% for Ki-67 expression in the radiomics model based on T2WI images. Compared with other studies,49–52 the model in our study has achieved better prediction results in different cut-off values, which can prove the universality of the model. According to certain research, deep learning technology can extract radiomics features from combined MRI images, achieving better prediction results (AUC value is 0.875). 52 Therefore, future research needs to use more advanced deep learning technology to extract more abundant information about tumor and tumor periphery from the multi-parameter image of breast MRI to improve the prediction performance.
Conclusion
In conclusion, this study demonstrates the potential of using DCE-MRI for radiomics machine learning to predict Ki-67 expression levels in invasive ductal breast cancer. By incorporating radiomics features from both intratumoral and peritumoral regions, a reliable prediction system was established. This non-invasive and cost-effective approach could assist in pre-operative identification of Ki-67 expression status and guide treatment options. Although further validation with larger datasets and regulatory approval is needed for clinical use, this radiomics machine learning model holds promise for personalized treatment recommendations in invasive ductal breast cancer.
Supplemental Material
sj-docx-1-tct-10.1177_15330338241288751 - Supplemental material for Radiomic Machine Learning in Invasive Ductal Breast Cancer: Prediction of Ki-67 Expression Level Based on Radiomics of DCE-MRI
Supplemental material, sj-docx-1-tct-10.1177_15330338241288751 for Radiomic Machine Learning in Invasive Ductal Breast Cancer: Prediction of Ki-67 Expression Level Based on Radiomics of DCE-MRI by Huan Yang, Wenxi Wang, Zhiyong Cheng, Tao Zheng, Cheng Cheng, Mengyu Cheng and Zhanqiu Wang in Technology in Cancer Research & Treatment
Supplemental Material
sj-csv-2-tct-10.1177_15330338241288751 - Supplemental material for Radiomic Machine Learning in Invasive Ductal Breast Cancer: Prediction of Ki-67 Expression Level Based on Radiomics of DCE-MRI
Supplemental material, sj-csv-2-tct-10.1177_15330338241288751 for Radiomic Machine Learning in Invasive Ductal Breast Cancer: Prediction of Ki-67 Expression Level Based on Radiomics of DCE-MRI by Huan Yang, Wenxi Wang, Zhiyong Cheng, Tao Zheng, Cheng Cheng, Mengyu Cheng and Zhanqiu Wang in Technology in Cancer Research & Treatment
Footnotes
Abbreviations
Acknowledgments
We gratefully thank all the patients and all the staff associated with this study.
Availability of Data and Materials
The datasets generated and/or analyzed during the present study are available from the corresponding author upon reasonable request.
Declaration of Conflicting Interests
The author(s) declared no potential conflicts of interest with respect to the research, authorship, and/or publication of this article.
Funding
The author(s) received no financial support for the research, authorship, and/or publication of this article.
Ethics Approval and Consent to Participate
This study received ethical approval from the Ethics Committee of the First Hospital of Qinhuangdao (Address: 258 Wenhua Road, Haigang District, Qinhuangdao City, Hebei Province, China, approval code: 2020F048) on August 13, 2020. This is a retrospective study, and all patient information was deidentified.
Supplemental Material
Supplemental material for this article is available online.
References
Supplementary Material
Please find the following supplemental material available below.
For Open Access articles published under a Creative Commons License, all supplemental material carries the same license as the article it is associated with.
For non-Open Access articles published, all supplemental material carries a non-exclusive license, and permission requests for re-use of supplemental material or any part of supplemental material shall be sent directly to the copyright owner as specified in the copyright notice associated with the article.