
Abstract
Background
This study aims to investigate the errors in structure volume and shape caused by the replication, expansion, and merging operations of the Monaco system and analyze their influence on dosimetry evaluation.
Methods
A retrospective collection of 30 patients undergoing radiotherapy was utilized. Cylinders with radii of 5, 10, and 30 mm were delineated in computerized tomography (CT) images from 10 patients with thoracic and abdominal issues, and the Margins function in Monaco was used to expand the margins by 0, 3, 5, and 10 mm in 2D mode. In 10 patients with vertebral metastases, the Margins function was utilized to replicate and merge targets, and the Copy Structure function was employed to replicate targets. Cross-CT replication was performed for the targets of 10 patients with nasopharyngeal carcinoma. The deviation between the processed structure volume and the ideal value was compared. The difference in the maximum dose (Dmax) before and after lens replication was evaluated in 10 patients undergoing whole-brain radiotherapy.
Results
Monaco's Margins function increased the volume of the processed structure during the copying procedure. The margin error was equivalent to expanding the structure by 0.3–0.4 mm, and a margin error of 0.3–0.4 mm was produced in each expansion instance. The volume deviation for a cylinder with a radius of 5 mm was 12.99%. The Merge function of Margins copied substructures and merged them. The Copy Structure function did not alter the structure during copying, but the volume was reduced by less than 1% after copying across CT. Dmax after lens replication was higher than that before replication, with a median difference of 31.3 cGy for the left lenses.
Conclusion
Monaco's Margins function introduces errors in organ replication, expansion, and merging, resulting in incorrect dose assessment. Physicians should be mindful of the potential effects when utilizing them.
Introduction
Radiotherapy is a fundamental modality in cancer treatment, with technological advancements over recent decades markedly enhancing patient prognoses. 1 Despite these improvements, radiation-induced side effects persist and seriously affect patients’ quality of life. 2 One of the primary challenges in radiotherapy is managing extensive irradiation, which necessitates precise delineation and accurate external expansion by using minimal margins. 3
The delineation of target areas and organs at risk (OARs) is critical in radiotherapy and the basis for treatment planning.4,5 The processes of expansion, replication, and merging are routine in organ delineation. 6 Physicians often expand the clinical target volume (CTV) to create the planning target volume (PTV) and increase the margins around organs, such as the lens and spinal cord, to derive the planning risk volume (PRV). These expansions account for patient positioning, geometric accuracy, and uncertainties in defining target volumes. 7 Typically, PTV and PRV require an external expansion margin of 5 mm. 8 Reducing the expansion margin from CTV to PTV has been shown to decrease radiotherapy side effects. 9 In a study of 414 patients with head and neck cancer, Nvaran et al. 10 observed that reducing the CTV-to-PTV expansion margin from 5 mm to 3 mm decreases acute grade 3 toxicity from 65% to 53.8%. These findings suggest that narrowing the CTV-to-PTV expansion margin, along with daily cone beam computed tomography guidance, can mitigate the severity, frequency, and duration of radiation-induced toxicity.
Common clinical scenarios that require replication, expansion, and merging functions include copying the original CTV to a new replanning computerized tomography (CT), 11 expanding CTV to derive PTV, and merging subtargets to form the total target 12 in multitarget planning designs. Monaco, a treatment planning system (TPS) developed by Elekta, provides the Contouring Margins menu to execute these functions. 6 Accurate execution of these functions is essential for precise delineation in radiotherapy. However, physicians in our department have observed discrepancies in volume and slight alterations in shape after organ replication using Monaco in clinical settings. Although numerous studies have investigated the dose accuracy of Monaco,13,14 the research on the precision of its replication, expansion, and merging operations in organ delineation remains limited.
To address this gap, this study examined the errors associated with Monaco's Margins function in replicating and expanding targets and OARs. Standard cylindrical replication expansion, multitarget replication and merging, cross-CT replication, and subsequent dosimetry evaluations were conducted. The objective was to analyze potential errors arising from the Margins function in the Monaco system, identify their underlying causes, and provide valuable insights for precise radiotherapy in clinical practice.
Materials and Methods
Patient Selection and Data Collection
Ten patients with thoracic and abdominal issues treated with radiotherapy in our hospital from January 2021 to December 2022 were retrospectively selected to delineate cylinders of various sizes and analyze replication and expansion errors. Additionally, 10 patients with dual-target vertebral metastases were chosen to assess the error of multitarget replication. Another 10 patients with nasopharyngeal carcinoma undergoing replanning radiotherapy were selected to evaluate the error of cross-CT target replication. Then, 10 patients undergoing whole-brain radiotherapy were chosen to evaluate the dosimetry effect of replication bias on OARs.
Patient image data were acquired using a Philips Brilliance Big Bore scanner (Philips Medical Systems, Cleveland, OH, the USA) with an image matrix of 512 × 512, pixel size of 0.975 mm, and scanning thickness of 0.25 cm. Subsequently, the data were transferred to Monaco 5.40.01 (Elekta, Stockholm, Sweden) for analysis.
Cylinder Correlation Test
Constructing a standard sphere in CT images is challenging. Hence, cylinders were utilized in this study. The tests conducted on the chest and abdominal CT images were as follows:
1. Repeatability Test 2. Tests with Different Expansion Margins
Cylindrical C5s with a radius of 5 mm and a height of 10 mm were delineated in 10 CT cases. The contouring margins were expanded by 0, 3, 5, and 10 mm in the 2D direction (left–right and anterior–posterior), resulting in structures denoted as C5 + 0, C5 + 3, C5 + 5, and C5 + 10. Cylindrical C10s were delineated in 10 CT cases and expanded by 0, 5, 10, and 20 mm, yielding structures denoted as C10 + 0, C10 + 5, C10 + 10, and C10 + 20. Cylindrical C30s were delineated in 10 CT cases, and structures C30 + 0, C30 + 5, C30 + 15, and C30 + 30 were obtained by expanding by 0, 5, 15, and 30 mm, respectively. 3. Comparison of Continuous and Direct Expansion
Ten C5 structures were delineated in 10 CT cases and expanded by 3, 5, and 10 mm two times to obtain structures, such as C5 + 3 + 3, C5 + 5 + 5, C5 + 10 + 10, and C5 + 20. Ten C10 structures were delineated in 10 CT cases and expanded by 5, 10, and 20 mm two times to obtain structures, such as C10 + 5 + 5, C10 + 10 + 10, C10 + 20 + 20, and C10 + 20. Furthermore, C10 + 10, C10 + 20, and C10 + 40 were expanded by 10, 20, and 40 mm, respectively. Ten C30 structures were delineated in 10 CT cases and expanded by 5, 15, and 30 mm two times to obtain structures, such as C30 + 5 + 5, C30 + 15, and C30 + 30 + 30. Moreover, C30s were expanded by 10, 30, and 60 mm to obtain C30 + 10, C30 + 30, and C30 + 60, respectively.
A circle with a radius of 10 mm was drawn in CT images of 5 cases. The Copy Next function in the Contouring menu was used, and three layers were duplicated to create a cylinder with a radius of 10 mm and a height of 10 mm (denoted as C10). Ten C10 structures were delineated in each CT scan, and their corresponding volumes were recorded.
The corresponding volumes of these structures were recorded. The expansion with a margin of 0 represents the structure copied using the Margins function.
The volumes of these structures were recorded. Negative expansion was not tested because of its lack of support in the 2D mode of the Margins function in the Contouring menu.
Multitarget Merging Testing
For the 10 patients with vertebral metastases, the two subtarget regions were recorded as PTV1 and PTV2. The PTV merge (PTVM) was obtained by combining PTV1 and PTV2 by using the Margins function. The structures of PTV1 and PTV2 with external expansion of 0 were labeled as PTV1 + 0 and PTV2 + 0, respectively. Notably, the Copy Structure function in the Contouring menu does not allow merging. The structures PTV1_cp and PTV2_cp were obtained using the Copy Structure function for PTV1 and PTV2_cp, respectively.
Cross-CT Replication Test
For patients with nasopharyngeal carcinoma, the target typically encompasses PTV, PTV1, PGTV, and PGTVnd and covers various areas. Given table size limitations, only PTV and PTV1 were selected for testing purposes. In replanning the CT scans of 10 patients with nasopharyngeal carcinoma, the Margins function was utilized to copy PTV and PTV1 from the original CT (labeled as CT0) to the replanning CT (labeled as CT1). The replicated structures were labeled as PTV + 0(CT1) and PTV1 + 0(CT1). PTV and PTV1 in CT0 were denoted as PTV(CT0) and PTV1(CT0), respectively. Similarly, the Copy Structure function was used to duplicate PTV(CT0) and PTV1(CT0) in CT1, and the copied structures were recorded as PTV_cp(CT1) and PTV1_cp(CT1), respectively. The corresponding volumes of these structures were recorded for analysis.
Dosimetric Evaluation
CTV was delineated based on the entire brain tissue of the patient. CTV was expanded by 5 mm, and PTV was generated upon further examination by the physician. The physician delineated the lenses and expanded the left and right lenses by 3 mm to generate PLenL and PLenR, respectively. PLenL and PLenR were expanded with a margin of 0 to obtain PLenL + 0 and PLenR + 0. Subsequently, coplanar double full-arc volumetric modulated arc therapy (VMAT) plans were designed using Monaco. 15 The couch and collimator angles were set to 0°, and the accelerator gantry rotated clockwise from 181° to 179° and then counterclockwise back to 181°. The planning algorithm employed was a Monte Carlo algorithm with a calculation grid of 3 mm. The prescription dose for PTV was set to 30 Gy/10f, and the dose for PTV was normalized to 95% upon the completion of the plan. The maximum dose (Dmax) of PLenL, PLenR, PLenL + 0, and PLenR + 0 was evaluated.
Statistical Analysis
All data were analyzed using SPSS 20.0 (Chicago, IL, the USA) software, and the results were presented as the median (lower and upper quartiles). A comparison of paired data was conducted using the nonparametric Wilcoxon signed-rank test, and the significance level was set to α = 0.05 (two tailed).
Results
Results of the Repeatability Test
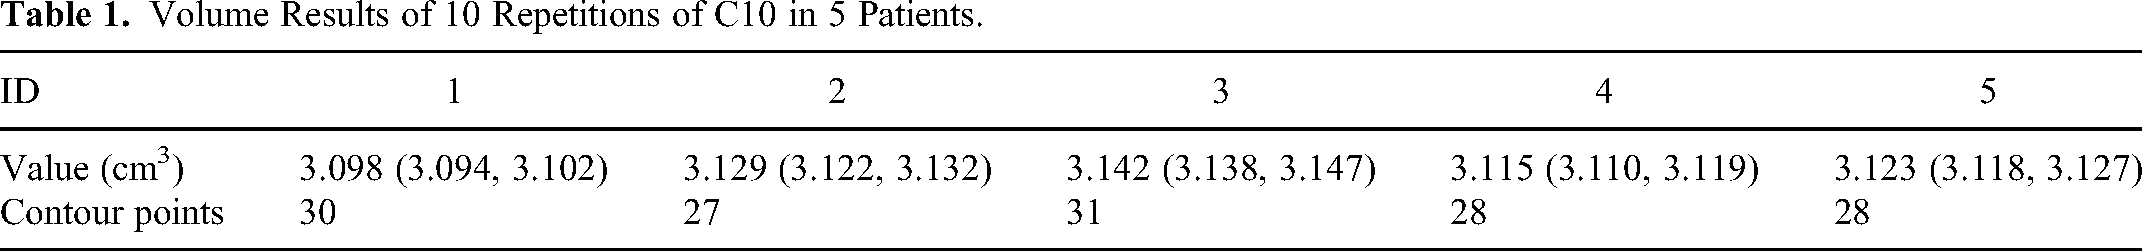
Table 1 presents the volume results of C10 in five patients with thoracic and abdominal issues. Except for the volume of C10 in the third case, the volume of C10 in the other cases was close to the ideal value (3.142 mm3), and the volumes of the remaining C10s were slightly smaller than the ideal value. Additionally, the volumes of C10 within the same CT scans exhibited small differences. The Monaco sketch file delineated the outline by using point coordinates, with the first and last points having the same coordinates, forming a closed outline. Table 1 also presents the number of contour points of C10 in one slice for five patients. Although the contour points of C10 for each patient were consistent, they varied across the different patients. C10 was recontoured 10 times in 5 patients while keeping the center of each contouring unchanged to further determine if the volume of C10 was influenced by the central point. The results demonstrated that the volume of C10 remained consistent across the 10 repetitions within the same CT scan.
Volume Results of 10 Repetitions of C10 in 5 Patients.
Results of Different Margin Expansions
Table 2 presents the results of C5, C10, and C30 in 10 patients with thoracic and abdominal issues undergoing various margin expansions to simulate tumors of different sizes with varying expansions. The ideal volume value is indicated in structural brackets, the deviation represents the difference between the volume value and the ideal value, and the radius denotes the cylindrical radius of the volume median value.
Expansion Results of Different Cylinders in 10 Patients.

Similar to the results in Table 1, those shown in Table 2 indicate that the volumes of C5, C10, and C30 were slightly smaller than the ideal values, with a large deviation observed for small volumes. However, for C5, C10, and C30, the percentage deviation between the structure volume and the ideal value gradually decreased with an increasing expansion margin. At the same expanded margin, the larger the cylindrical radius was, the smaller the deviation from the ideal value was. In general, large structure volumes after expansion exhibit small deviations from the ideal volume value.
The nonparametric Wilcoxon signed-rank test was employed to compare the volume difference between C5 and C5 + 0, and the test revealed a significant difference between the two (P < .001), with C5 having a smaller volume than C5 + 0. Similarly, the volume of C10 and C30 was smaller than that of C10 + 0 and C30 + 0, indicating statistical significance (all P < .001).
The radius values corresponding to the volume values are listed (only the radius values corresponding to the median are provided) to mitigate the influence of different volumes on the deviation. The radius corresponding to the volume showed that after expansion with different margins, the radius increased by mostly 0.3–0.4 mm. Given that the volume radius values of C5, C10, and C30 were slightly smaller than 5, 10, and 30 mm, respectively, the additional value error may be slightly large.
A sketch file of a data example was randomly read to visualize the replication and expansion errors, and the difference between C10 and C10 + 0 was compared. The result is shown in Figure 1. C10 used 30 contour points and C10 + 0 employed 17 points. Monaco used fewer points to describe C10 + 0 after replication, and the coordinates were outward, thus increasing the volume after replication. This result indicates that the Contouring Margin function did not directly copy the coordinates of the contour points of the original structure and instead utilized a small collection of contour points, resulting in errors during duplication. Given that the contour point of C10 + 0 was not uniformly located outside of C10, some contour deviation was greater than 0.4 mm, and the distance in the upper-left corner in Figure 2 is 0.8 mm.

Comparison of an example of C10 and C10 + 0. (a) Two structures are displayed in the CT image, where the green line represents C10, the blue line represents C10 + 0, and the deviation measured at the red mark in the upper-left corner is 0.08 mm. (b) The outlines are redrawn using MATLAB, and the round and square boxes represent the outline points.

Comparison of C10 + 5 + 5 and C10 + 10. (a) C10, C10 + 5 + 5, and C10 + 10 are depicted in the CT image, where the green, blue, and red lines represent C10, C10 + 5 + 5, and C10 + 10, respectively. (b) The outlines are redrawn using MATLAB, where the circle, box, and asterisk denote the outline points.
Results of Continuous and Direct Expansion
Table 3 compares the results of continuous and direct expansion in 10 patients with chest and abdominal problems. The deviation between the volume after continuous expansion and the ideal value was greater than that after direct expansion, and the deviation of the former was about two times that of the latter. This finding suggests that with each expansion, Monaco introduced a certain deviation equivalent to an additional margin of about 0.3–0.4 mm, as shown in Table 2. Under the same expansion condition, the smaller the volume was, the larger the deviation was. For C5 + 3 + 3, the deviation was 13.52%.
Comparison of Continuous and Direct Expansion in 10 CTs.

The nonparametric Wilcoxon signed-rank test was used to compare the volume differences of the structures obtained by continuous and direct expansion. The results showed significant differences between the two structures in all the comparisons (all P < .001). Specifically, the volume of the continuous-expansion structure was greater than that of the direct-expansion structure.
To visualize the expansion error, we randomly read a sketch file of one example of data and compared the difference between C10 + 5 + 5 and C10 + 10. The result is shown in Figure 2. C10, C10 + 5 + 5, and C10 + 10 used 27, 29, and 30 contour points, respectively. Most of the points of C10 + 5 + 5 were located outside C10 + 10, indicating that its volume was greater than that of C10 + 10. Moreover, the number of contour points after expansion was close to that of the original structure, a result that is different from the result after replication (ie, reduction in contour points).
Results of Multitarget Merging
A comparison of the results combined with the target areas in the 10 patients with vertebral metastases is presented in Table 4, where the deviations of PTV1 + 0, PTV2 + 0, and PTVM are relative to the volumes of PTV1, PTV2, and PTV1 plus PTV2, respectively. Notably, the median PTVM volume is not equal to the sum of the median PTV1 and median PTV2 volumes because the value is expressed by the median (lower and upper quartiles); instead, it represents the combined volumes of PTV1 and PTV2 in each case. Similar to the results of cylindrical replication, the volumes of PTV1 and PTV2 increased by about 3% after Margins replication, resulting in a 3.16% increase in PTVM volume.
Comparison of Multitarget Replication and Merging.

The volumes of PTV1_cp and PTV2_cp obtained by the Copy Structure function were 399.396 (330.819, 472.387) cm3 and 437.506 (385.632, 486.660) cm3, respectively. The volumes of PTV1_cp and PTV2_cp in each CT image were equal to the volumes of PTV1 and PTV2, respectively. The outline point coordinates of PTV1_cp and PTV2_cp were similar to those of PTV1 and PTV2, respectively, indicating that the structure shape and volume did not change after replication. The volume of the merge target is not listed here because the Copy Structure function does not support merged structures.
The nonparametric Wilcoxon signed-rank test was used to compare the volume differences between PTV1 and PTV1 + 0 and between PTV2 and PTV2 + 0. The results showed that the volume differences between PTV1 and PTV1 + 0 and between PTV2 and PTV2 + 0 were significant (all P < .001). PTV1 and PTV2 were smaller than PTV1 + 0 and PTV2 + 0, respectively.
To visualize the expansion error, we randomly read a data sketch file and compared the difference between PTV1 and PTV1 + 0. The result is given in Figure 1, where 67 and 61 contour points are used for PTV1 and PTV1 + 0, respectively. Most of the outline points of PTV1 + 0 were outside PTV1, indicating that its volume was slightly larger than that of PTV1, a result that is similar to those shown in Tables 2 and 3.
The contour points of PTV1 in all cross sections in Figure 3 were read to explore the outer expansion margin of PTV1 + 0, which is equivalent to that of PTV1, and the Polybuffer function of MATLAB 2019b was used to perform 2D expansion layer by layer. The outer expansion margins were 0, 0.3, 0.42, and 0.43 mm. The corresponding structural volumes were 487.815, 497.882, 501.925, and 502.263 mm3, and the volumes of PTV1 and PTV1 + 0 were 487.815 and 502.077 mm3, respectively. Therefore, the volume of PTV1 + 0 was equivalent to the volume of PTV1 after 0.42 mm expansion, which was close to the result of the additional radius in Tables 2 and 3. The Polybuffer function retained the original point coordinates when copying the outline, so the volume did not change. The Polybuffer function used additional contour points when it expanded outside. With the cross section in Figure 3 as an example, the structure utilized 477 contour points (more than the 67 contour points in PTV1) in this cross section after expanding by 0.42 mm.

Comparison of PTV1 and PTV1 + 0 in one patient. (a) PTV1 and PTV1 + 0 structures are depicted in the CT image, where the green and blue lines represent PTV1 and PTV1 + 0, respectively. (b) The outline is redrawn using MATLAB, where the round and square boxes represent the outline points.
The contour points of PTV1 in all cross sections in Figure 3 were read to explore the outer expansion margin of PTV1 + 0, which is equivalent to that of PTV1, and the Polybuffer function of MATLAB 2019b was employed to perform 2D expansion layer by layer. The outer expansion margins were 0, 0.3, 0.42, and 0.43 mm. The corresponding structural volumes were 487.815, 497.882, 501.925, and 502.263 mm3, and the volumes of PTV1 and PTV1 + 0 were 487.815 and 502.077 mm3, respectively. The volume of PTV1 + 0 was equivalent to the volume of PTV1 after 0.42 mm expansion and close to the result of the additional radius in Tables 2 and 3. Notably, the Polybuffer function retained the original point coordinates when copying the outline, ensuring that the volume did not change. Additionally, the Polybuffer function utilized additional contour points during outer expansion. With the cross section in Figure 3 as an example, the structure used 477 contour points (more than the 67 contour points in PTV1) in this cross section after 0.42 mm expansion.
In addition, TPS usually involves the export and import of structural outlines. In this regard, the PTV1 and PTV2 contours of the 10 patients with vertebral metastasis were imported and exported, that is, the contours were exported in DICOM format and re-imported into the Monaco system. The results showed that import and export did not introduce volume and shape changes, indicating that Monaco did not introduce errors into the export and import process after using the contour point coordinates to read and write the organ profiles.
Results of Cross-CT Replication
Table 5 presents the comparison of the results of the CT replication targets in 10 patients with nasopharyngeal carcinoma. In the table, the deviations of PTV + 0(CT1) and PTV_cp(CT1) are relative to the volume of PTV(CT0), and the deviations of PTV1 + 0(CT1) and PTV1_cp(CT1) are relative to the volume of PTV1(CT0). The results showed that the volumes of PTV + 0(CT1) and PTV1 + 0(CT1) were larger than those of PTV(CT0) and PTV1(CT0), respectively. The deviation value was about 5%, which is 3% larger than the deviation value obtained using the Margins function (Table 4). Unlike the result in Table 4, which indicates that no copy errors were introduced, PTV_cp(CT1) and PTV1_cp(CT1) were slightly smaller than PTV(CT0) and PTV1(CT0), with deviation values of less than 1%.
Comparison of PTV Replication Results Across CT.

The nonparametric Wilcoxon signed-rank test was used to compare the volume differences among PTV(CT0), PTV + 0(CT1), and PTV_cp(CT1). The results showed that the volume difference between PTV(CT0) and PTV + 0(CT1) and PTV(CT0) and PTV_cp(CT1) was significant (all P < .001). PTV(CT0) was smaller than PTV + 0(CT1) and larger than PTV_cp(CT1). Similarly, the volume of PTV1(CT0) was smaller than that of PTV1 + 0(CT1) but larger than that of PTV1_cp(CT1), with significant statistical differences.
To visualize the replication error, we randomly read a sketch file and compared the differences among PTV(CT0), PTV + 0(CT1), and PTV_cp(CT1). Given that PTV(CT0) and PTV + 0(CT1) were not in the same CT, the coordinate ranges were inconsistent. For this reason, after the delineation of PTV(CT0) and PTV_cp(CT1), the centroid coordinates of both structures were calculated, and PTV(CT0) was translated to the centroid of PTV_cp(CT1). This procedure allowed us to view PTV(CT0), PTV + 0(CT1), and PTV_cp(CT1) in the same diagram, as shown in Figure 4. PTV(CT0), PTV + 0(CT1), and PTV_cp(CT1) used 613, 99, and 289 contour points, respectively. As presented in Figure 4, the contour trajectory of PTV_cp(CT1) had higher coincidence with PTV(CT0), and PTV + 0(CT1) used few contour points and was located outside PTV(CT0).
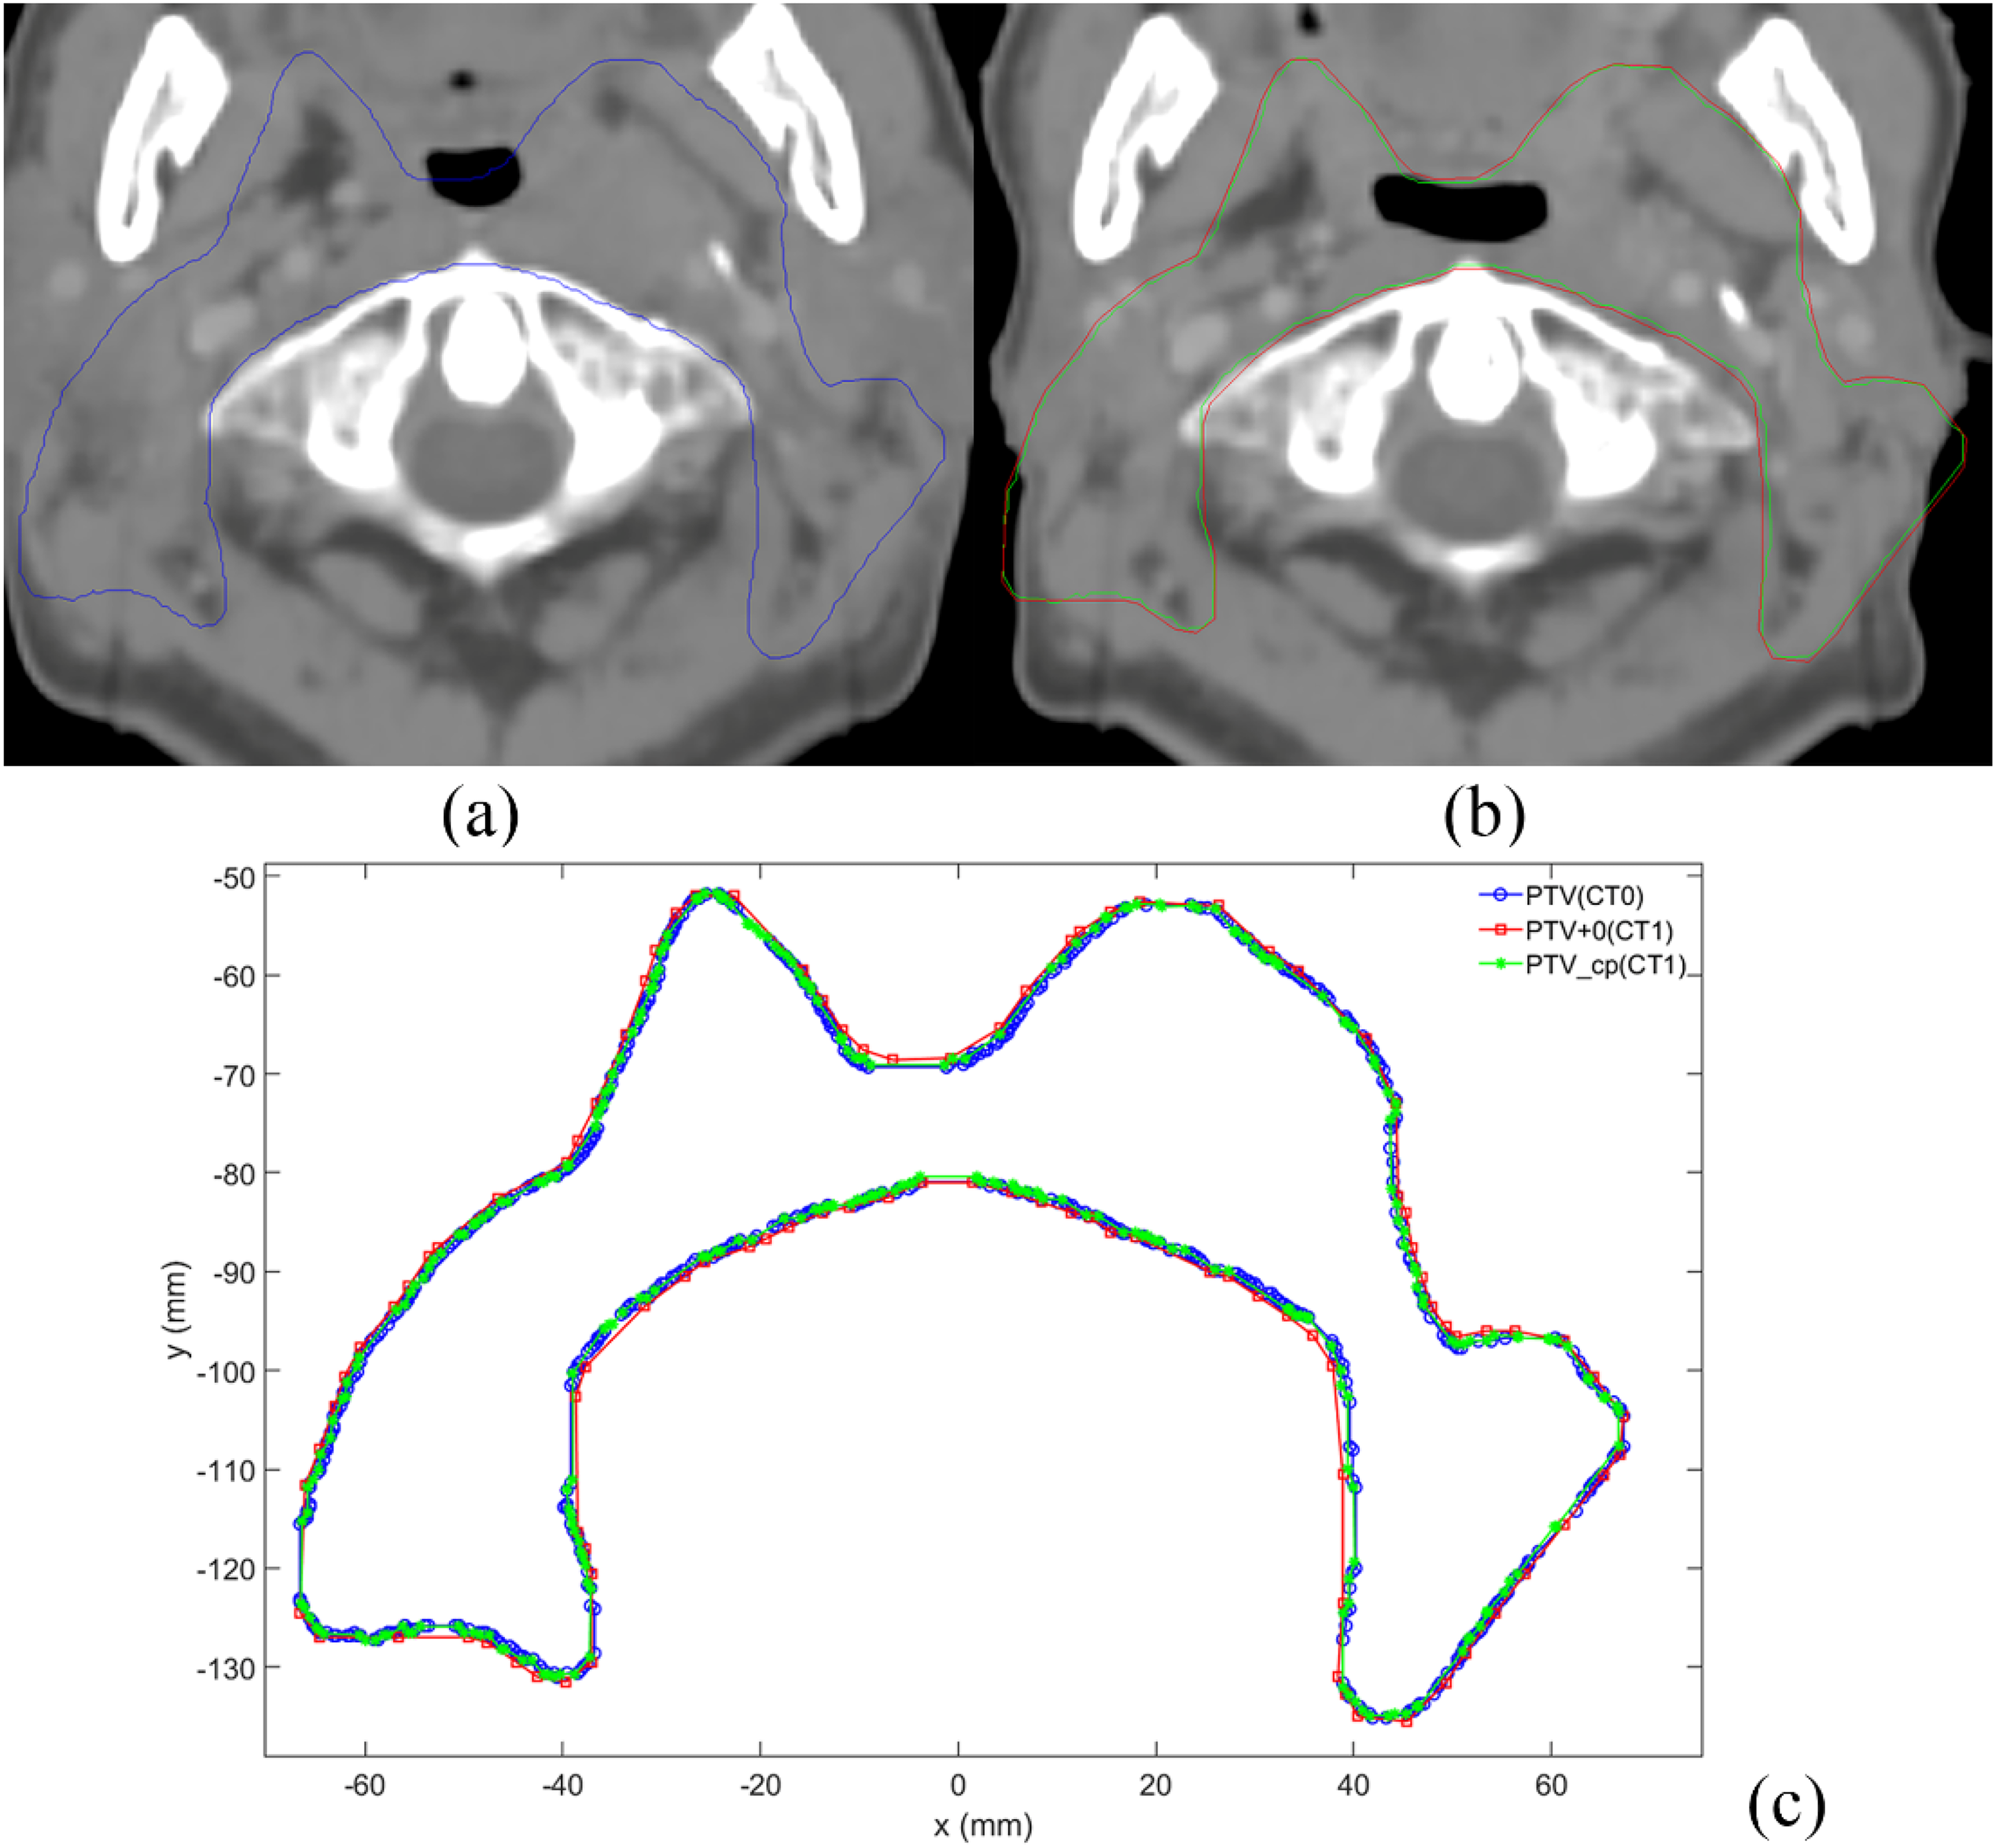
Comparison of cross-CT replication targets in a patient with nasopharyngeal carcinoma. (a) The PTV structure is shown in the CT0 image. (b) The PTV + 0 and PTV_cp structures are depicted in the CT1 image, where the red and green lines represent PTV + 0 and PTV_cp, respectively. (c) The outline is redrawn using MATLAB, where the blue, red, and green lines represent PTV, PTV1, and PTV1 + 0, respectively.
Dosimetric Effects
Table 6 presents the dose difference of Dmax before and after lens replication in the whole-brain VMAT plans. The Dmax of PLenL + 0 was higher than that of PLenL, with a median difference of 31.3 cGy, indicating a statistically significant difference (P < .001). Similarly, the Dmax of PLenR + 0 was higher than that of PLenR, with a median difference of 24.0 cGy (P < .001). Figure 5 shows the dose distribution of a whole-brain patient. PLen + 0 after replication was greater than PLen, which led to dose misevaluation.

Dose distribution map of the whole brain of a patient. The green translucent area is PTV, and the enlarged cyan, yellow, blue, and purple lines refer to PLenR, PLenR + 0, PLenL, and PLenL + 0, respectively.
Dmax of the Lens Before and After Replication in the Whole-Brain VMAT Plans.

Discussion
Radiotherapy is a cornerstone in cancer treatment, emphasizing the importance of accurately delineating tumors and OARs. Functions, such as copying, expanding, and merging, are essential in the delineation process and for precise target and OAR definition. Monaco's ability to record contour boundary coordinates with planar contours 16 enhances organ preservation. Monaco has advantages over mask preservation because it avoids jagged boundaries, conserves space, and facilitates DICOM format preservation and transmission.
This study utilized cylinder and patient CT data to highlight that the use of the Contouring Margins function in Monaco expands margins by an additional 0.3–0.4 mm, thereby increasing the volume of structures. For small structures, such as a cylinder with a 5 mm radius and 10 mm height, the deviation reaches 12.99%. Despite the Margins function's ability to conserve file size through the use of few outline points, its replication errors considerably affect dosimetry assessment, as evidenced by a 31.3 cGy dose difference for Dmax after lens replication in whole-brain radiotherapy plans.
In this study's cylinder repeatability test, slight volume disparities were observed among repeated sketches within the same CT scan, but pronounced variations accompanied with contour point fluctuations were noted across different CT scans. Although the cylinder's volume slightly fluctuated with random position selection, consistency prevailed with identical centers. Analysis of different expansion margins revealed varying deviations between outer expansion volume and ideal structure size, with large volumes exhibiting less deviations post-expansion. However, a comparison based on radius deviation revealed an additional margin error of 0.3–0.4 mm after replication and expansion. This discrepancy is particularly critical for small tumors treated with stereotactic radiosurgery or stereotactic body radiotherapy. Hence, physicians should carefully consider the effect of this discrepancy on organ delineation and shape alterations during reproduction.
Unlike the Margins function, Monaco's Copy Structure function directly replicates the original structure's outline point coordinates, thereby minimizing errors. However, cross-CT replication requires contour point coordinate mapping, resulting in an error of less than 1% for the Copy Structure function. Merging operations conducted with the Margins function introduce additional errors, with continuous and direct external expansion producing consistent errors as previously discussed.
Given the undisclosed specifics of Monaco's replication extension algorithm, this analysis is based solely on test results. Clinicians must remain aware of potential errors in replication, expansion, and merging during clinical practice. Manufacturers should further evaluate algorithmic intricacies to mitigate inaccuracies in delineation.
This exploratory study has several limitations. First, the tests were confined to the Monaco system, precluding a comparison with other mainstream TPSs. Second, only 2D tests were conducted in alignment with the gold standard, and 3D evaluations were omitted. Last, due to space constraints, other Boolean operations, such as organ crossing and subtraction,17 were not examined. Future studies should explore additional Boolean operations across 3D models in diverse TPS systems and analyze their effects on dosimetry to provide insights into accurate radiotherapy.
Conclusions
Replication, expansion, and merging are common functions in radiotherapy sketching. Utilizing the Contouring Margins function in Monaco for replication and expansion results in an increased volume of the treated structure that is equivalent to an additional expansion of 0.3–0.4 mm. Each expansion introduces this additional deviation. The difference in Dmax assessment of the lens before and after replication is 31.3 cGy. The Copy Structure function of the Contouring menu can replicate the structure without any change but may result in a volume deviation of less than 1% when the structure is copied across CT scans. Clinicians who use Monaco's Margins function must assess the potential effects of replication, expansion, and merging errors, particularly for small tumors.
Highlights
The impact of delineation errors caused by replication and expansion operations in one treatment planing system (TPS) was considered.
Cylindrical replication expansion, multitarget replication and merging, cross-CT replication, and subsequent dosimetry evaluations were used. Results showed that Utilizing Contouring Margins for replication and expansion increased the treated structure volume, equivalent to an additional expansion of 0.3 to 0.4 mm.
The dosimetric effects were evaluated. The Dmax after lens replication in whole brain radiotherapy plans was higher than that before lens replication, with a median difference of 31.3 cGy.
Footnotes
Abbreviations
Acknowledgments
None.
Ethics Approval and Consent to Participate
This retrospective study was approved by the ethics committee of the Affiliated Nanjing Medical University Changzhou Second People's Hospital (approval number: [2020] KY154-01). Due to the retrospective nature of this study, the ethics committee of the hospital waivedthe informed consent of the patients and confirmed compliance withthe Declaration of Helsinki and the confidentiality of the patient data.
Declaration of Conflicting Interests
The authors declared no potential conflicts of interest with respect to the research, authorship, and/or publication of this article.
Funding
The author(s) disclosed receipt of the following financial support for the research, authorship, and/or publication of this article: This work is supported by the National Natural Science Foundation of China (No. 62371243), Changzhou Social Development Program (No. CE20235063), General Program of Jiangsu Provincial Health Commission (No. M2020006), and Jiangsu Provincial Key Research and Development Program Social Development Project (No. BE2022720), Jiangsu Provincial Medical Key Discipline Cultivation Unit of Oncology Therapeutics (Radiotherapy) (No. JSDW202237), the National Natural Science Foundation of Jiangsu (No. BK20231190).