
Abstract
Purpose:
To analyze the setup errors and residual errors of different spinal cord parts in esophageal cancer patients and to explore the necessity of spinal cord segmental expansion.
Methods and Materials:
Sixty cases of esophageal cancer were included with 20 patients subdivided into the following groups: neck, chest and abdomen as per the treatment site. The patients underwent intensity modulated radiation therapy (IMRT) between 2017 and 2019. Thermoplastic mask or vacuum bag were utilized for immobilization of different groups. CTVision (Siemens CT-On-Rail system) was used to acquire pre-treatment CT, and 20 consecutive pre-treatment CT datasets were collected for data analysis for each case. Images were exported to MIM (MIM Software Inc.) for processing and data analysis. Dice coefficient, maximum Hausdorff distance and centroid coordinate values between the spinal cord contours in the pre-treatment CTs and the planning CT were calculated and extracted. The contour expansion margin value is calculated as MPRV = 1.3 ∑ total + 0.5 σ total, where ∑ total and σ total are the systematic and random error, respectively.
Results:
For neck, chest, abdominal segments of the spinal cord, the mean Dice coefficients (± SD) are 0.73 ± 0.06, 0.80 ± 0.06, 0.82 ± 0.06, the maximum Hausdorff distance residual error (± SD) are 4.46 ± 0.55, 3.49 ± 0.53, 3.46 ± 0.69 mm, and the mean centroid coordinate residual error (± SD) are 2.40 ± 0.53, 1.66 ± 0.47, 2.14 ± 0.95 mm, respectively. The calculated margin using residual centroid method in medial-lateral (ML), anterior-posterior (AP), and cranial-caudal (CC) direction of spinal cord in neck, chest, abdominal segments are 3.86, 5.37, 6.36 mm, 3.45, 3.83, 4.51 mm, 4.05, 4.83, 7.06 mm, respectively, and the calculated margin using residual Hausdorff method are 3.10, 5.33 and 6.15 mm, 3.30, 3.77, 4.61 mm, 3.35, 4.76, 6.87 mm, respectively.
Conclusion:
The setup errors and residual errors are different in each segment of the spinal cord. Different margins expansion should be applied to different segment of spinal cord.
Introduction
The spatial relationship between the organs-at-risk (OARs) and the tumor, and accurate evaluation of radiation dose to the OARs are of great importance in radiotherapy. Precise positioning, steep dose gradient, the proper expansion of OAR contours, and the tumor target areas, are of importance to radiation oncologists and medical physicists, especially for IMRT which has become the mainstream radiotherapy technology. Research on the structural uncertainty of interest areas in radiation range are mostly focused on the planned target area expansion (margin). Studies about the expansion of OARs are limited and most of which are focusing on the study of OAR as a whole organ. 1 However, recently researchers have demonstrated that some OAR substructures should be singled out, such as sub-ventricles of the heart, atria, and coronary arteries, etc. 2,3
The spinal cord is a critical organ to keep under tolerance dose. Radiation-induced spinal cord injury from excessive irradiation will have serious consequences. The dose limit is 50 Gy to spinal cord from guidelines, 4 but in clinical practice the limit is usually set to be 45 Gy due to the seriousness of the side effect. At present, the clinical practice adopts a unified approach to expand a certain range to form OAR expansion planning organ at risk volume (PRV). However, the spinal cord accompanies vertebrae, and should have different expansion margins in different areas due to its physiological characteristics. In this study, we aim to provide a segmental spinal margin reference for clinical application based on the diagnostic quality on-line CT image measurement and analysis of the moving range of different segments of spinal cord.
Materials and Methods
Patient Selection
Sixty patients with esophageal cancer confirmed by imaging and pathology in Henan Cancer Hospital between 2017 and 2019 were selected for on-line CT image verification. Image-guided radiation therapy (IGRT) on-line CT scans were acquired before the correction of positioning error and every radiotherapy fraction. According to the officially defined subsections of spinal column, 60 patients were evenly divided into neck, chest and abdomen groups. The first 20 IGRT CT verification images of each patient were used for data analysis.
Instruments and Equipment
The immobilization device used for neck group is a thermoplastic mask, and the vacuum bag was used for chest and abdomen groups. Philips 16 row BrilliantTM big bore CT simulator (Philips Medical Systems) is used for simulation. Siemens CT-on-rail imaging system (Siemens Medical Solutions USA, Malvern, PA) was used for CT image guided radiotherapy. The images were analyzed using MIM 6.9.2 image processing system (MIM Software Inc.).
Spinal Cord Contouring
The spinal cord was contoured both on the simulation CT and the IGRT CTs with the window width set at 400, and the window position set at 40. The spinal cord was drawn from the foramen magnum to the lower edge of the seventh cervical vertebra, from the upper edge of the first thoracic vertebra to the lower edge of the twelfth thoracic vertebra, from the upper edge of the first lumbar vertebra to the lower edge of the second lumbar vertebra in the neck, chest and abdomen groups respectively.
Online Image Registration
Rigid image registration was performed online using the maximum mutual information algorithm to detect patient setup errors. The fused images were reviewed slice by slice to check the alignment of the treatment target and the OAR using the vertebral bodies as the surrogate of the esophagus. The image registration was manually adjusted when deemed necessary. The 3-dimensional setup errors were recorded and corrected before the treatment implementation.
Parameters Acquisition Obtained Offline
IGRT CT images acquired before fractional treatment were imported into MIM 6.9.2 software. The position center point of IGRT CT image sequence was mapped on the IGRT CT coordinate system. A rigid fusion and manual adjustment were then performed between the IGRT CT and the planning CT. The position center point of IGRT CT was transformed and mapped onto the planning CT according to the registration transformation. Positioning error was obtained from the difference of these 2 center points on the planning CT coordinate system. The CT sequence of the spinal cord was named reference and the contour of spinal cord on the IGRT CT series was mapped onto the planning CT series through the same operations as the center points. Dice coefficient, 5 Hausdorff distance, 6 centroid 7,8 and other parameters of the 2 sets of spinal cord contours were then calculated using Microsoft Excel. Two sets of spinal contours on planning CT series are shown in Figure 1 after processed in MIM. The difference between the centroid parameters of 2 sets of spinal cord contours after registration was thus the residual value of positioning error. Each parameter is defined as follows. The subscript “test” indicates quantities acquired from IGRT CT images; the subscript “ref” indicates quantities acquired from planning CT images.
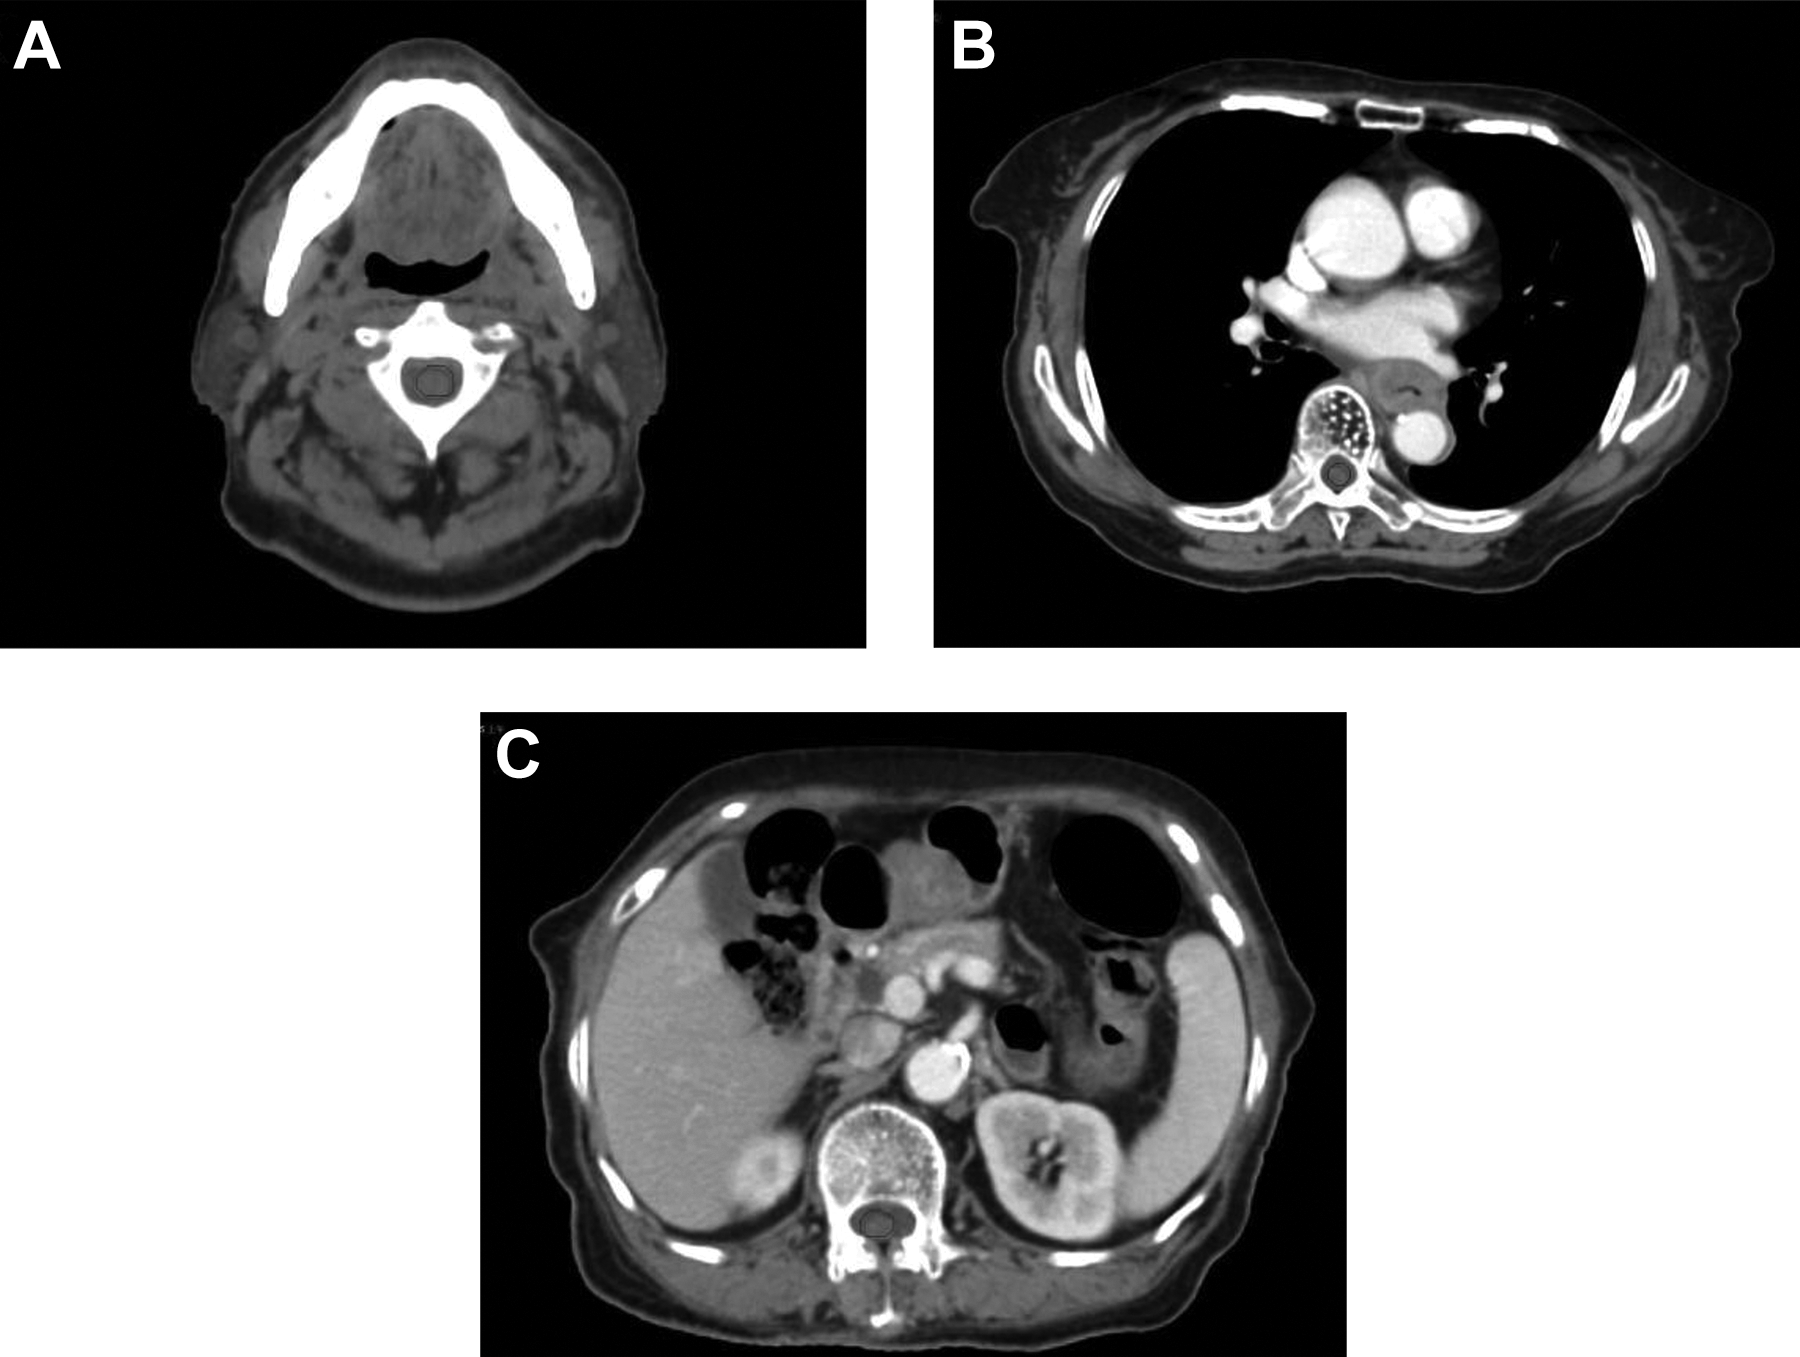
Simulation CT images of different spinal cord segments of an esophageal cancer patient after processed with Dice workflow. Panels A, B, and C show the cervical, thoracic and lumbar spines, respectively. The red and blue lines are spinal cord contours in the simulation CT and the IGRT CT, respectively.
Dice coefficient

The Dice coefficient reflects the degree of overlapping from the 2 volumes enclosed by the 2 sets of contours and it is a good indication of registration accuracy and the coincidence level of 2 body positions.
Hausdorff distance
For 2 sets of points A = {a1,…, ap} and B = {b1,…, bq}, the Hausdorff distance between the 2 sets is defined as

where


Hausdorff distance in MIM is used to depict the distance between 2 groups of images and is a measure of registration error (residual). In this study, the maximum Hausdorff distance was used to verify the maximum deviation distance of the spinal cord edge after CT mapping and registration, which actually reflects the maximum deviation between spinal cord positioning during each fractional treatment.
Centroid
The X, Y, Z coordinate values of the centroid of the contour are calculated by dividing the contour enclosed area into many individual sub voxels, and then calculating the average values of all sub voxel centers to determine the centroid. In this study, the centroid is the geometric center of the delineated spinal cord.
Centroid deviation
The centroid deviation (DC) is defined as the distance between 2 points in 3D space

where Xtest, Ytest and Ztest are the centroid coordinates of the spinal cord delineated on IGRT CT images, while Xref, Yref and Zref are those of the spinal cord delineated on planning CT images. X, Y and Z directions represent left to right, dorsal to ventral, and caudal to cranial respectively.
The centroid deviation reflects the distance between any 2 points in 3-dimensional space. 8 In this study, the coordinate value is obtained by rigid registration between positioning CT image and pre-treatment CT image.
Four sets of data are extracted by MIM, including positioning coordinates, Dice coefficient, maximum Hausdorff distance, centroid coordinate, and are expressed in the form of mean ± standard deviation (
The Calculation Method of Expansion Margin (PRV)
According to the Research report from Remeijer et al 8 individual systematic error (sigma individual) and random error (sigma individual) are expressed by mean and standard deviation of individual error respectively; group systematic error (sigma group) and group random error (sigma group) are expressed by standard deviation of all sigma individuals and root mean square of all sigma individuals respectively. According to Stroom and Heijmen 9 the total group systematic error (∑ total group) and the total group random error (σ total group) are the square root of the sum of squares of each factor respectively. The geometrical quality consistency of positioning laser, Linac isocenter, deviation of radiation field center and Linac isocenter in the department are all 1 mm. The expansion margin is calculated according to the Mprv formula from McKenzie et al 10 [12], which is, 1.3 Σtotal population + 0.5 σtotal population.
Statistical Treatment
SPSS 25.0 software (IBM Corporation) was used for data analysis. The difference of the 3 distances and the difference between the 2 groups were compared using compatibility variance analysis. Bilateral test results were considered statistically significant when P < 0.05.
Results
There were 20 cases in each of the 3 groups, cervical, thoracic and abdominal spinal cord group. The first 20 fractional IGRT CT series for each patient were imported into MIM. Total of 1200 series of IGRT CT images were used. There are 4 groups of data analyzed in each IGRT CT series, and a total of 4800 groups were processed in MIM software, Microsoft Excel, SPSS 25 and other software. The processed data is summarized in Tables 1 to 5.
Spinal Cord Positioning Error in the 3 Groups of Patients by Centroid Method (mm).

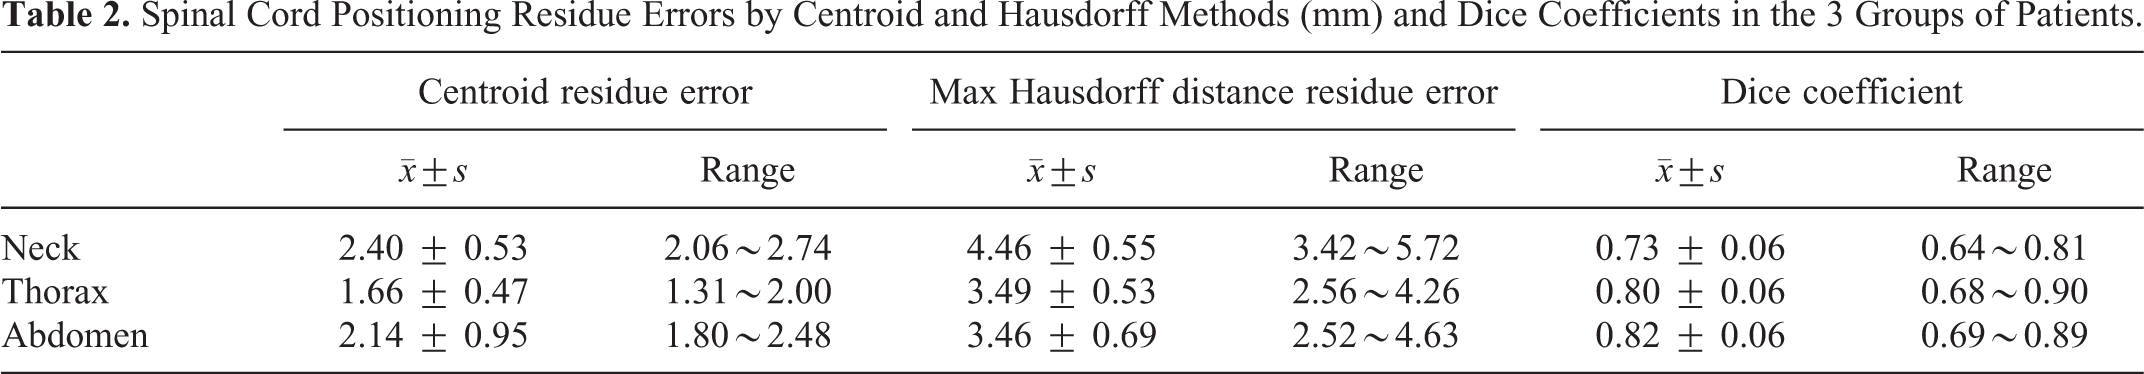
Spinal Cord Positioning Residue Errors by Centroid and Hausdorff Methods (mm) and Dice Coefficients in the 3 Groups of Patients.
Centroid Deviation Comparison P Value in the 3 Areas.

Residue Error Comparison P Value in the 3 Areas.

Spinal Cord Margin Extension in X, Y and Z Direction for Different Areas on Non-IGRT CT and IGRT CT (mm), Calculated Through Centroid Deviation (MxxCentroid) or Hausdorff Distance (MxxHausdorff).
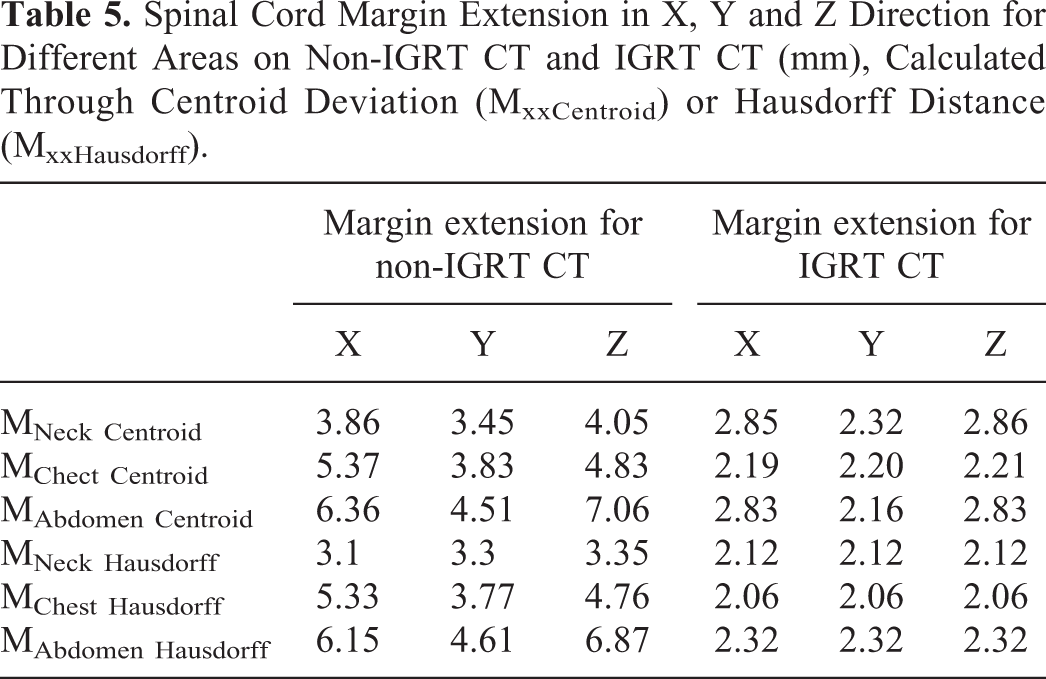
Table 1 shows that non-IGRT positioning error increases as the distance increases from planning CT centroid position. The positioning errors are statistically different between the cervical and the thoracic spines (P = 0.000), the cervical and the lumbar spines (P = 0.000), but are not statistically significant between the thoracic and the lumbar spines (P = 0.665). Table 2 shows that centroid deviation of spinal cord is the largest in the neck area, the smallest in the chest area, and in between the value in the abdomen area. The Dice coefficient is the largest in the abdomen area, the smallest in the neck area, and in between the value in the chest area. Hausdorff distance has the same tendency with the centroid deviation but has a wider standard distribution in the abdomen area. The Dice coefficient is a description of the overlap degree, the Hausdorff distance is a description of the maximum deviation, while the centroid deviation is the centroid difference, all between the spinal cord contours on the 2 sets of CTs. The centroid deviation and the Hausdorff distance are different.
Difference of spinal contours on the 2 sets of CT can be seen in Figure 1. Red contours are on drawn on the simulation CT, while the blue ones are drawn on the IGRT CT.
Table 3 shows that the centroid deviation difference between the neck area and the other 2 areas is statistically significant while the difference between the chest area and the abdomen area is not. Table 4 shows that the residue error of centroid deviation difference between neck and chest areas is statistically significant while the difference between the neck and abdomen areas as well as the difference between the chest and abdomen areas is not statistically significant. The residue error of Hausdorff distance difference between the areas are the same as those of centroid deviation shown in Table 3.
Table 5 shows that on non-IGRT CT, both of the margin extension calculation methods display very similar results, that is, the margin extension is the smallest in the neck area, and is the largest in the abdomen area. While on IGRT CT, margin extension can be greatly reduced, and the differences between the 3 areas are not statistically significant.
Discussion
The correct definition, delineation and margin extension of OAR volumes are very important in dose calculation and plan evaluation. The positioning error is one of the major factors affecting true OAR volumes. 11 Spinal cord is long and crosses in the neck, the chest and the abdomen areas. It therefore brings challenge to patient positioning; even a 6-dimensional couch could not completely correct the whole range of spinal cord 12 within a large treatment field. Especially for IMRT and SBRT where dose gradient is dramatic, even a small positioning deviation may be lethal when the OAR is close to treatment target volumes. 13
With the development of technology, it is possible to study the substructure of organs at risk. Public reports also show the necessity of the study, such as Bahig et al 14 used prospective ECG gated imaging with dual source CT to obtain cardiac images, and then to evaluate dosimetry dynamic change of the substructures of the heart during contraction and relaxation cycle by using Hausdorff distance and 4-dimensional dose volume histogram. Feng et al 15 established the heart substructure delineation guidelines, compared the results before and after the guidelines using the volume overlap percentage (Dice coefficient) and the Jaccard consistency index, and showed that the unified guidelines improved the consistency of substructure delineation and dose evaluation among different planners. Hardcastle et al 16 used the Dice coefficient, Hausdorff distance and the centroid displacement of OARs and GTVs to evaluate the anatomical deviation between contours drawn from professionals and contours derived from deformable image registration (DIR) algorithms. They showed that DIR method has good anatomical consistency in OAR delineation, but not in GTV delineation, and care needs to be exercised. In this study, the Dice coefficient, Hausdorff distance and centroid were used to analyze the residual error after rigid registration of each segment of spinal cord based on diagnostic quality positioning CT images, so as to get the deviation information of spinal cord in different areas more accurately.
Sarwar et al 17 found that the upper and lower segments of the brachial plexus had different range of motion by using Jaccard consistency index, and that PRV of the brachial plexus need to have different extension margins because the lower segment of brachial plexus has wider range of motion. In our study, the spinal cord was drawn by the same person according to the same standard. The Dice coefficients vary consistently in different body areas between spinal cord contours on plan CT and on positioning CT. The Dice coefficient and residue error are the smallest in the neck area. Although the positioning variance can be reduced significantly between fractions, the presence of the large residual distance after correction indicates that the original simulation positioning of the chest and abdomen can hardly be reproduced. This is similar to the results of Ma et al 18 in the delineation deviation study of lesions in the cervical vertebra, thoracic vertebra and lumbosacral areas. The range of non-random motion of the target is the largest near the cervical vertebra area. We also confirmed that there is statistical significance in the deviation comparison between spinal cord delineations in neck, thoracic and abdomen areas.
The results of this study showed that in non-IGRT positioning, the deviation of positioning is the smallest in the neck area, the largest in the abdomen, and in between in the chest area. They are consistent with the results reported by Li et al. 19 Mongioj et al 20 used EPID to study the PRV boundaries in L-R, A-P and S-I directions of cervical spinal cord and reported 3.8, 3.5 and 3.2 mm respectively, similar to our off-line spinal cord centroid method. Baron et al 21 used CTvision accelerator to measure the residual vectors of 6 points of thyroid cartilage after aligning the center point with the top front point of the fifth cervical vertebra. The residual PRV of the OARs in the neck area was around 3 mm, which was also similar to our on-line neck residual centroid method. In this study we used diagnostic quality 3-dimensional CT image and achieved better analysis of spinal cord fractional positioning deviation.
Method reported by Hyde et al 12 is often used in calculating residual error, where images are acquired multiple times after IGRT correction is completed. While in our method here, only one positioning CT during each treatment fraction was acquired, reducing excessive dose exposure to patients. On-line IGRT positioning is done here through CT scanning for each treatment fraction, while the non-IGRT positioning is done here through a combination of laser positioning and CT scanning every few other fractions. Our results showed that on-line IGRT greatly reduces spinal margin extension in each direction. Previous reports used either the whole organ 1,20 or only a few points, 21 while here we studied segmental spinal cord in different areas on diagnostic quality CT. We analyzed and compared the positioning deviation and residual errors among the spinal cord sub-segments, and proposed more accurate extension of the sub-segment spinal cord in either on-line IGRT positioning or off-line IGRT positioning situations.
The Centroid difference approach was used in the present study to generate margin expansion by comparing the centroid deviation of the spinal cord contours between the simulation CT and the IGRT CT. Whereas the Hausdorff distance method compares a large number of points between the 2 CT datasets and derives the margin expansion using the maximum distance. Geometrically, the Hausdorff distance assesses local discrepancies between registered contours whereas the Centroid difference is insufficient to provide such information. Therefore, the authors are inclined to believe that the Hausdorff distance method is more suitable for clinical applications.
There are limitations in the present study. Firstly, this study was labor intensive and required a large amount of clinical data. Although the spinal cord contouring and data processing were completed by a single person, the longitudinal consistency of contouring could very well be a concern. Secondly, more investigation is necessary to determine which is the superior method, between the 2 margin expansion approaches based on Centroid difference and Hausdorff distance method.
Conclusion
The results of this study show that different spinal cord margin extension need to be considered for different sub-segmental areas, no matter whether on-line IGRT positioning or other offline positioning technique is used.
Footnotes
Authors’ Note
Dingjie Li was responsible for data collection, analysis and thesis writing; Hong Ge and Jing Cai were responsible for experiment design, guidance, and thesis revision; Shengtao Wei, Tian Li and Yang Liu assisted in the experiment. Our study did not require an ethical board approval because it did not contain human or animal trials.
Declaration of Conflicting Interests
The author(s) declared no potential conflicts of interest with respect to the research, authorship, and/or publication of this article.
Funding
The author(s) received no financial support for the research, authorship, and/or publication of this article.