
Abstract
Keywords
Introduction
Incorporation of multimodal imaging and intensity-modulated radiotherapy improved local tumor control for head and neck cancer (HNC) patients and decreased toxicity to adjacent organs at risk (OAR). 1 Because of improved tumor control and patient outcome, shifting focus to radiation-induced, swallow-related toxicities have been a major concern for HNC quality of life management. In order to determine the radiation dose–volume effects,2,3 delineation of the normal organs is a prerequisite to study the radiation dose effect of different pharyngeal muscles on dysphagia. 4 Traditionally, the pharyngeal muscles are contoured manually but can be further segmented into upper, middle, and lower pharyngeal muscles. However, manual segmentation of these muscles is time-consuming 5 and is associated with interobserver variability.2,6 Furthermore, due to the anatomic complexity, accurate segmentation of these structures requires extensive HN expertise.
The HN region is considered to be the most challenging anatomic site for radiation therapy due to the large number, small size, and geometric complexity of organs to be contoured. Automatic segmentation has been used to facilitate manual segmentation with reduced interobserver variations.7–9 Atlas-based auto-segmentation (ABAS) has been tested for various cancer sites, 10 and refinement for clinical application continues.7,11–14 Separately, deep-learning-based models trained with convolutional neural networks (CNNs) have demonstrated great accuracy in delineating various organs.15–19 DL-based CNNs have shown promising accuracy in recent years16,20,21; however, research specifically using CNNs to outline the subdivisions of the pharyngeal contractors and larynx for swallowing-related functions has not been thoroughly investigated. In this study, we aim to evaluate the accuracy of deep-learning-based auto-segmentation (DLAS) of the swallowing-related OARs compared with ABAS and the gold-standard manual segmentation. The performance of these 2 methods was comprehensively evaluated using quantitative geometric and dosimetric measures, along with subjective scores.
Methods and Materials
Dataset
The study has received approval from Institutional Review Board (IRB #1313551-1). A total of 105 computed tomography (CT) image sets in 83 HN cancer patients (including diagnosis and simulation CTs) were retrospectively identified from the database from November 2014 and April 2017. Four swallowing OARs were manually segmented by an HNC expert radiation oncologist (YL), following the published consensus guideline. 22 All manual contours were then reviewed and modified if needed by another radiation oncologist specialized in HNC (SR). The 4 OARs were named CONSSUP, CONSMID, CONSINF, and LARYNX, corresponding to the superior constrictor muscle, mid constrictor muscle, inferior constrictor muscle, and larynx, respectively. Among the 105 data sets of CT and manual contours, 50 were used for training and 33 for validation. After model training and validation, the remaining 22 were used for testing and performance benchmarking. Patient characteristics with their corresponding treatment plans are listed in Supplemental Table S1. Exclusion criteria include patients with prior radiation therapy or surgery in the head and neck region. No model retuning or retesting was performed. The majority of HN radiotherapy plans had a prescription up to 70 Gy to the primary target in 30 to 35 fractions.
Auto-Segmentation Model Creation
A commercial software (INTContour, Carina Medical LLC) was used to create deep-learning models for swallowing OARs and has been previously described.23,24 The software employs 3D U-Net structure 25 for automatic organ segmentation. Briefly, CT datasets were resampled to consistent spatial resolution and matrix size. Two separate 3D U-Nets were trained, one with dilated convolutions and one without. The outputs from both networks were averaged. Augmentations such as random translation, rotation, scaling, and left-right flipping were used for both training and model deployment. The loss function used includes the weighted cross entropy and soft Dice loss. The model training was packaged as an “incremental learning” feature in the software which allows the user to train new or update existing organ segmentation models. The hyperparameter tuning and network training schemes were automated, and no human intervention was performed.
The ABAS model (MIM Version 6.9.6, MIM Software Inc) was built using a representative set of 25 CT datasets taken from the training set. The cases selected for training the atlas model were carefully evaluated to represent a wide spectrum of clinical scenarios, including patients with dental implants and different head tilt angles. The same 22 datasets that were used for testing the DLAS model were used for the ABAS model testing and evaluation.
Quantitative Evaluation
Geometric comparisons
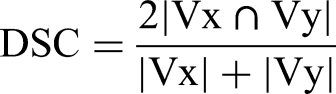
The performance of both DLAS and ABAS was evaluated by comparing differences between the automatically generated and manual contours. Dice similarity coefficient (DSC), precision, recall, Hausdorff distance (HD), 95th percentile of Hausdorff distance (HD95), measure surface distance (MSD), and mean dose were used as the evaluation metrics for all 22 patients in the testing cohort. The calculation formula of each parameter is as follows:
The DSC,
26
precision, and recall are parameters to measure the degree of overlap between 2 volumes (Vx and Vy). The calculation formula is as follows:
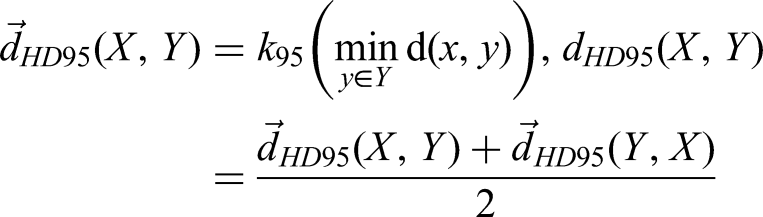
For DSC, Precision, and Recall are ratio or percentage, the range of the above 3 metrics are [0, 1], with 1 being the best value, and 0 being the worst. The HD determines the maximum distance from one point of a contour to the closest pair-wise point of another contour. The HD95 is the 95th percentile of the distance of the corresponding point between the 2 structures.
27
The specific points on contour X and contour Y are described as “x” and “y.” HD and HD95 define as:


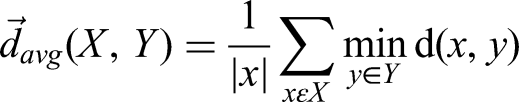

Dosimetric comparisons
Dose statistics were computed for DLAS and ABAS contours and manual contours (reference) using the dose distribution of the original, delivered clinical treatment plans. Dosimetric metrics of manual contours and autosegmented contours for 4 studied OARs were assessed.
Qualitative Evaluation
DLAS and ABAS generated contours were randomly assigned to 3 radiation oncologists for independent evaluation of the 4 swallowing structures following expert consensus guidelines. 28 The number of slices that needs manual modification in each of the structure was recorded. The average modification rate was calculated for each structure from all 3 evaluators.
Statistical Analysis
SPSS (SPSS Inc, version 22) and GraphPad Prism version 6 (Graph pad software) were used to analyze the data. We used paired t test to calculate the difference of DSC, recall, precision, HD, HD95%, MSD, and mean absolute dose between DLAS and ABAS. A P value <.05 was regarded as statistically significant.
Results
Quantitative Evaluation
For all 4 studied structures, an improvement in a quantitative evaluation of overlapping areas is observed in DLAS contours, as compared to ABAS (Figure 1). Similarly, an improvement in distance measures for all 4 studied structures was observed in DLAS contours, compared to ABAS (Figure 2). Most of the distance related parameters indicated that DLAS is greater than ABAS, and the comparison shows statistical significance (P < .05) (Figure 2).

Average and 95% confidence interval of DSC, Recall, Precision of DLAS (blue) and ABAS (red). All others were significant with a P value <.001 of the paired test, except for the Recall difference of CONSINF (P = .038) and LARYX (P = .301). Abbreviations: CONSSUP, Superior pharynx constrictor muscle; CONSMID, Middle pharynx constrictor muscle; CONSINF, Inferior pharynx constrictor muscle; LARYNX, larynx; ABAS, atlas-based auto-segmentation; DLAS, deep-learning-based auto-segmentation; DSC, Dice similarity coefficient.

Average and 95% confidence interval of HD 95, HD and MSD of DLAS (blue) and ABAS (red). All others were significant with a P value <.001 of the paired test, except for the HD of CONSMID (P = .945), CONSINF (P = .011), and MSD of the CONSMID (P = .067). For OAR abbreviations refer to Figure 1. ABAS, atlas-based auto-segmentation; DLAS, deep-learning-based auto-segmentation; HD, Hausdorff distance; MSD, mean surface distance.
The greatest improvement was observed in CONSMID, details shown in Table 1. The DSC increased from 0.36 ± 0.18 (ABAS) to 0.60 ± 0.19 (DLAS) and the HD95 decreased from 0.95 cm ± 0.40 cm (ABAS) to 0.57 cm ± 0.57 cm (DLAS). The DSC of LARYNX increased on average from 0.70 ± 0.13 (ABAS) to 0.84 ± 0.05 (DLAS) and the HD95 decreased on average from 1.90 cm ± 0.75 cm (ABAS) to 1.00 cm ± 0.33 cm (DLAS). When comparing the CONSMID and LARYNX, the improvement of DSC and HD95 in CONSSUP and CONSINF was relatively smaller.
Statistical Data Corresponding to Individual ROIs for DLAS and ABAS.

Abbreviations: ABAS, atlas-based auto-segmentation; DBAS, deep-learning-based auto-segmentation; DSC, Dice similarity coefficient; HD, Hausdorff distance; HD95, 95th percentile of Hausdorff distance; MSD, mean surface distance.
The mean absolute dose obtained from the manual and auto-contours is shown in Figure 3. There is no statistical significance for all studied structures (P > .05). The ratios of the OAR volume obtained by DLAS and ABAS, to the reference volume obtained from those manual contours, are VDLAS/VManual, and VABAS/VManual, respectively. The mean values of VDLAS/VManual and VABAS/VManual for CONSSUP, CONSMID, CONSINF, and LARYNX are 0.79 ± 0.20 VS 0.70 ± 0.34, 1.19 ± 0.30 VS 1.52 ± 0.69, 1.32 ± 0.25 VS 1.88 ± 0.49, 0.86 ± 0.14 VS 1.15 ± 0.22. There is statistical significance in differences for all studied structures, except for CONSSUP (P > .05).
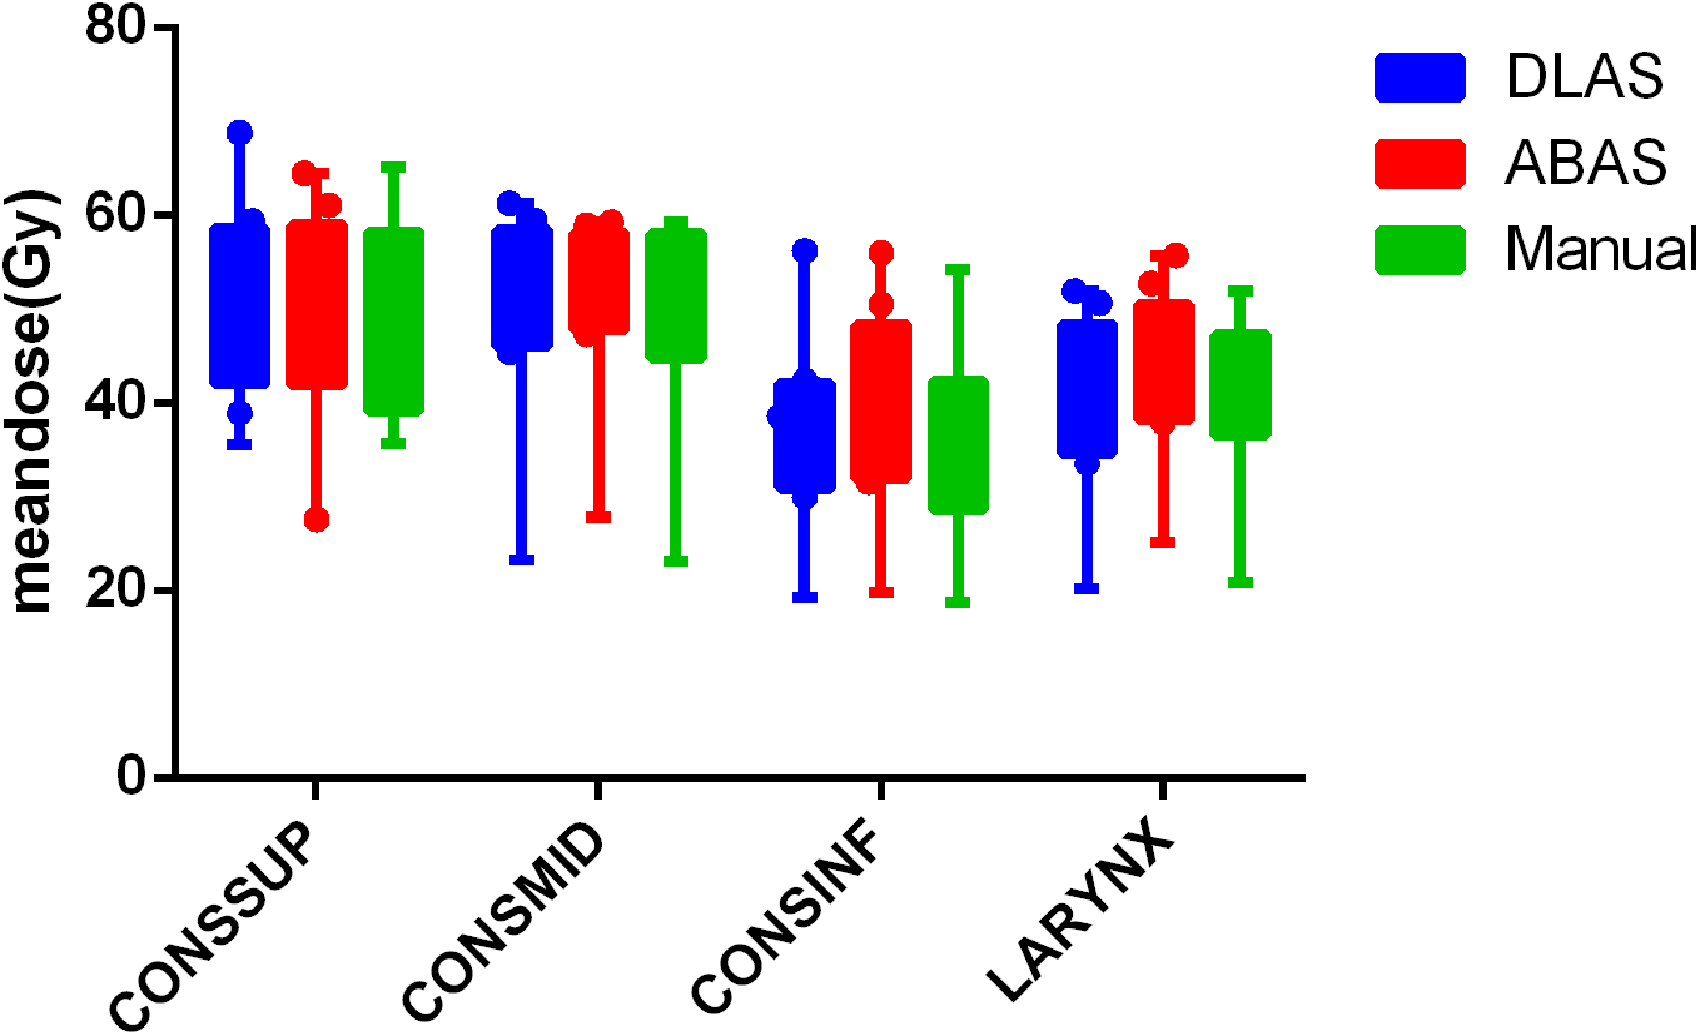
Mean doses of DLAS (blue), ABAS (red), and manual (green) contours. For OAR abbreviations refer to Figure 1. ABAS, atlas-based auto-segmentation; DLAS, deep-learning-based auto-segmentation.
The time for building an ABAS model library took about 2 h, and the model training time for DLAS took about 6 h. The average time for each patient to complete an ABAS and DLAS cycle is about 10 and 2 min, respectively.
Qualitative Evaluation
Overall, the average modification rate of ABAS was higher than that of DLAS for all studied structures, as shown in Figure 4. The modification rate of CONSSUP, CONSMID, and CONSINF in DLAS was lower than 50%, while those of ABAS exceeded 60%. CONSSUP had the largest improvement, from 0.78 ± 0.15 (ABAS) to 0.33 ± 0.21 (DLAS), while Larynx had the smallest, from 0.93 ± 0.09 (ABAS) to 0.73 ± 0.22 (DLAS). . The independent sample t test indicated that difference was statistically significant for all 4 structures (P < .05).

Modification rate of the 4 OARs. For OAR abbreviations refer to Figure 1.
DLAS performed better than ABAS when segmenting all 4 swallowing structures. The DSC and modification rate of CONSSUP are significantly better for DLAS than that of ABAS, and the performance of DLAS is significantly better than ABAS in judging the posterior and lateral border (Figure 5A). For CONSMID and CONSINF, DLAS also showed higher accuracy in determining the contour borders in 3-dimensions compared to ABAS. In the case with the lowest DSC (0.272), it was found that the autogenerated contour is too forward compared to the manual one for CONSINF (Figure 5B). However, this particular patient had a tracheostomy and a cannula, which may have caused inaccuracy of automatic segmentation due to significant anatomy change.

(A) Panel A shows the back border are more accurate in DLAS, and Panel B shows the posterior and lateral border are more accurate in DLAS. (B) A worst scenario case with a tracheotomy and a cannula, which may cause inaccuracy due to large anatomy change. Panel A shows the axial slice, and Panel B shows the sagittal slice. Cyan, magenta, and blue lines represent manual, ABAS, and DLAS, respectively. ABAS, atlas-based auto-segmentation; DLAS, deep-learning-based auto-segmentation.
LARYNX has the best DSC and HD95 performance compared to the pharyngeal constrictor muscles. Modification rate exceeded 0.5 in both DLAS (0.73 ± 0.22) and ABAS (0.93 ± 0.09) for LARYNX. Figure 6 shows reasonable overlap between DLAS and manual contours, with inferior overlap between ABAS and manual. Figure 7 shows a representative case of Larynx performance that the DLAS failed to maintain the triangle shape for larynx.

A representative case with good overlap between DLAS and Manual, while ABAS is relatively poor, in axial, sagittal, and coronal views. Cyan, magenta, and blue lines represent manual outline, ABAS, and DLAS in turn. ABAS, atlas-based auto-segmentation; DBAS, deep-learning-based auto-segmentation.

Panel A shows DLAS and manual overlap very well. Panel B shows the discrepancy between DLAS and manual locates at the cranial side and caudal side mostly. Cyan, magenta, and blue lines represent manual outline, ABAS, and DLAS in turn. ABAS, atlas-based auto-segmentation; DBAS, deep-learning-based auto-segmentation.
Discussion
To our knowledge, this is the first data to evaluate the feasibility of automatic segmentation of swallowing function structure based on deep-learning CNN. In our study, DLAS and ABAS were comprehensively evaluated using quantitative methods of geometric overlap, distance measures, absolute dose difference, and qualitative modification rates. Compared with ABAS, the results indicate that DLAS creates more accurate, consistent, reproducible pharyngeal contraction muscles, and larynx contours with less manual correction. Although it takes more training time for DLAS than building an ABAS model, it takes less time for each patient to complete a DLAS cycle, which will greatly improve our clinical efficiency in eliminate manual contouring time.
Our results show similar DSC values to those 22 normal organs determined by van Dijk et al 18 using a training set of more than 500 HNC patients. In this study, the pharyngeal contraction muscle was automatically segmented and evaluated as a whole structure. We expanded upon van Dijk's paper by segmenting the pharyngeal contraction muscle into 3 parts: superior, middle, and inferior pharyngeal contraction muscle. In addition, we contour the larynx, which was analogous to “glottis area” in van Dijk's study. 18 The subdivision of the pharyngeal constrictor is meaningful in the evaluation of side effects of radiotherapy for dysphagia. Levendag's research has shown that the radiation dose of different parts of the pharyngeal constrictor causes different quality of life scores for patients with swallowing dysfunction. 4 In fact, the guidelines for delineation of organs related to swallowing in radiotherapy published by Miranda 22 in 2011 have already suggested a detailed delineation of the pharyngeal constrictor muscle. It is challenging to manually contour these substructures. Our aim was to evaluate the feasibility and accuracy of deep learning to automatically delineate the subdivided pharyngeal contraction muscle and larynx which may be beneficial for more elaborate research on dysphagia in the future. The difference between organ dose of the automatically segmented and the manual contour was analyzed, which serves as a prelude for future correlation analysis between radiation dose of swallowing related organs and dysphasia after radiotherapy.
Examples of comparing DLAS and ABAS are shown in Figure 5 with best and worst case scenarios. When large anatomy deviation exists (probably due to surgery), DLAS may have higher inaccuracy when the special scenarios are not included in the training model (Figure 5B). This phenomenon is somewhat similar to Tong's 29 research, which indicated that the shape of the structure can be greatly impacted on the results of automatic segmentation for surgical patients. Although the modification rate of LARYNX is high, the results are still meaningful, as the Larynx actually has high Dice score, and similar HD95, HD, MSD as other structures. The discrepancy between DLAS and manual locates at the cranial side and caudal side mostly. It can be found clearly in sagittal plane (shown in Figure 6). In addition, due to the cartilage boundary of the larynx is relatively clear, the difference looks more eye-catching, which may also be the reason for the high proportion of unacceptable from the evaluators. The deep-learning method showed encouraging results for autosegmenting larynx, as shown in Figure 6; however for a few cases, as shown in Figure 7, the contours from the deep-learning model failed to maintain the triangle shape for the larynx. This is likely due to the variation in the intensities surrounding the bony structures and the model failed to utilize the high-level shape information to make the correct segmentation. Previous study also has shown that Intra-imaging uncertainty for segmented geometry and position. Larynx is highly variable during deglutition and could skew training during imaging the larynx and there is around an 8 mm total laryngeal setup error. 30
Although we hypothesized that the model has learned both high-level and low-level information for segmentation, it may not yield the right balance for every case. A straightforward and effective solution for improvement is to use a larger training set. Our future study will explore the probabilistic output of the model to use additional post-processing steps to explicitly enforce shape constraints. In addition, researchers have proposed the concept of swallowing functional units31,32 in recent years, which brought a more in-depth study on the anatomy and physiology of swallowing function compare to the classic constrictor muscles and larynx. This may provide another application in future research for the auto-segmentation concerning swallowing organs.
Conclusion
The application of DLAS in subdivided swallowing-related organs (superior, middle, and inferior pharyngeal contractions and larynx) is feasible. In comparison with an automatic drawing based on Atlas, DLAS is significantly better than ABAS in the aspect of geometric overlap and distance parameters as well as the subjective evaluation and will consume less time. In the near future, DLAS may replace ABAS as a routine in the automatic segmentation of swallowing-related organs.
Supplemental Material
sj-docx-1-tct-10.1177_15330338221105724 - Supplemental material for Evaluating Automatic Segmentation for Swallowing-Related Organs for Head and Neck Cancer
Supplemental material, sj-docx-1-tct-10.1177_15330338221105724 for Evaluating Automatic Segmentation for Swallowing-Related Organs for Head and Neck Cancer by Yimin Li, Shyam Rao, Wen Chen, Soheila F. Azghadi, Ky Nam Bao Nguyen, Angel Moran, Brittni M Usera, Brandon A Dyer, Lu Shang, Quan Chen and Yi Rong in Technology in Cancer Research & Treatment
Footnotes
Abbreviations
Authors’ Note
Our study was approved by University of California Davis Medical Center (UCD #: CCRO 058) and UCD Internal Review Board Committee (IRB ID: 1313551-1). IRB approves exemption for patients’ informed consent forms due to the retrospective nature of the study.
Declaration of Conflicting Interests
The author(s) declared no potential conflicts of interest with respect to the research, authorship, and/or publication of this article.
Funding
The author(s) disclosed receipt of the following financial support for the research, authorship, and/or publication of this article: Yimin Li is supported by the China Scholarship Council (CSC), (grant number No. 201706080096), Xiamen Science and Technology Planning Guidance Project (3502Z20214ZD1004), and The First Affiliated Hospital of Xiamen University Translational Medicine Research Incubation Fund(XFY2020004).
Supplemental Material
Supplemental material for this article is available online.
References
Supplementary Material
Please find the following supplemental material available below.
For Open Access articles published under a Creative Commons License, all supplemental material carries the same license as the article it is associated with.
For non-Open Access articles published, all supplemental material carries a non-exclusive license, and permission requests for re-use of supplemental material or any part of supplemental material shall be sent directly to the copyright owner as specified in the copyright notice associated with the article.