
Abstract
Background
DNA methylation is a core factor in epigenetics and is indispensable for biological processes. In cytosine–guanine dinucleotides (CpGs), a carbon-5-positive cytosine base (5-methylcytosine; 5-mC) is supplied with an additional methyl group through the action of DNA methyltransferase (DNMT) enzymes.1,2 In humans, the DNMT family is an important enzymatic group comprising canonical (DNMT1, DNMT3A, and DNMT3B) and noncanonical (DNMT3L and TRDMT1) isoforms. 3 They are involved in DNA methylation in vitro, the regulation of gene expression, and maintenance of genomic stability.4,5 Numerous findings have shown that DNMTs play aberrant and dysregulated roles in diverse cancer cells.
DNMT1 primarily maintains the stability of genomic DNA methylation through recognizing and catalyzing the methylation of CpG sites.6,7 Aberrant DNMT1 expression can lead to the transcriptional silencing of tumor suppressor genes, thereby promoting tumor occurrence and development.8–10 For example, upregulated DNMT1 expression might inhibit TRAF6-mediated EZH2 ubiquitination by inhibiting TRAF6 transcriptional expression and thereby promoting abnormal tumor proliferation and metastasis in prostate cancer. 11 PAS1 might be activated by a DNMT1 inhibitor, which suppresses PH20 expression for breast cancer growth and migration. 12 Moreover, DNMT3A/DNMT3B principally accounts for de novo methylation, diverting the methyl type from S-adenosylmethionine to a cytosine residue for the establishment of methylation. 7 Heterozygous mutations of DNMT3A, as frequent genetic alterations in clonal hematopoiesis, correspond to the pathogenesis of colorectal carcinoma. 13 Additionally, FAM111B methylation is mediated by DNMT3B to enhance cancer cell growth, metastasis, and glycolysis in papillary thyroid cancer. 14
Moreover, TRDMT1 and DNMT3L have been regarded as having no catalytic DNA methylating activity. Recent studies have suggested that TRDMT1 is a 5-mC RNA methyltransferase that affects cellular stress responses.15,16 Maciej Wnuk et al 17 found that TRDMT1-KO glioblastoma cells might alter the cell cycle, DNA damage, total DNA 5-mC levels, and RNA methyltransferase NSUN family expression during chemotherapy. DNMT3L primarily mediates genomic methylation, supporting the function of DNMT3 de novo DNMTs. 18 However, studies investigating the role of DNMT3L in cancer are limited. Although numerous reports have focused on the tumorigenesis, diagnosis, and therapy of DNMTs, systematic studies on their biological functions in multiple human cancers remain lacking.
In the present study, we used various databases to comprehensively examine the expression profiles of DNMT family genes (DNMT1, DNMT3A, DNMT3B, TRDMT1, and DNMT3L) across TCGA cancer types (Supplemental Table 1). In addition, the potential relationship between DNMT expression and epithelial–mesenchymal transition (EMT) signatures, stemness, the tumor microenvironment (TME), immune cells, and immune markers across multiple cancers was investigated. Based on integrated bioinformatics analyses, we also validated the relationship between DNMT1 protein expression and cell proliferation and migration in vitro.
Methods
Expression of mRNA and Prognosis of DNMT Family Genes in Multiple Cancers
RNA-sequencing data, patients’ clinical features, prognostic information, and parallel normal organizations for cancers were retrieved from the TCGA, GTEx, and GEO databases (Supplemental Table 2). These gene expression profiles all contained tumor and normal samples, and the TCGA data were converted to the log2(fpkm + 1) format for further analysis. Four prognostic indicators were identified using univariate Cox regression analysis. 19 All expression information of DNMT family genes was extracted from the downloaded RNA-sequencing databases and integrated with prognostic information using RStudio software. The P-values and hazard ratios with 95% confidence intervals were computed via materially installing a series of R packages, including “ggplot2,” “ggpubr,” “plyr,” and “pheatmap.” The results are presented using box plots, heat maps, Kaplan–Meier curves with cut-offs, and forest plots. The Wilcoxon signed-rank test was used to compare DNMT expression between tumor and normal samples across different cancer types.
Correlation Analysis between DNMT and Ki67 Expression, EMT Signatures, and Stemness Scores
The EMT is a marker of the initiation of metastasis and enhances the migratory and invasive properties of cancer cells. 20 Lee et al reported that there were 15 defined EMT signature genes, consisting of several canonical mesenchymal (ITGB6, FN1, TWIST1, SNAI2, MMP3, VIM, GSC, MMP2, FOXC2, CDH2, SNAI1, and MMP9) and epithelial (OCLN, DSP, and CDH1) marker genes. 21 In this study, we calculated the correlation between EMT-related gene expression and that of DNMTs using Spearman's correlation analysis. Cell stemness scores comprising the two indices, mRNA expression-based stemness index (mRNAsi) and DNA methylation-based stemness index (mDNAsi), were used to assess cancer pathology and treatment outcomes. The relevance of previously published gene expression and stemness scores was assessed using Spearman's method for the TCGA tumor samples. 22 The correlation between Ki67 and DNMT expression, based on TCGA mRNA expression data, was tested to evaluate cell proliferation. The R packages, “ggplot2,” “psych,” “circlize,” and “pheatmap,” were applied for relevance analysis and visualization.
TME and Immune Relevance Analyses of the DNMTs
The complex TME comprises immune cells, stromal cells, and blood vessels. 23 We downloaded and exploited the ESTIMATE score from the MD Anderson Cancer Center website (https://bioinformatics.mdanderson.org/estimate/) to analyze its correlation with gene expression across all TCGA tumor samples.
The TIMER 2.0 database (http://timer.cistrome.org/) is a vital platform for detecting tumor-infiltrating immune cells (TIICs) that relies on transcriptional expression databases. This study obtained raw data from this platform and analyzed the relationship between DNMT1 expression and TIICs in various types of cancer tissues. Furthermore, Spearman's correlation analysis was used to unveil the relationship between DNMT1/DNMT3A/DNMT3B expression and the reported biomarkers of tumor immunotherapy, tumor mutation burden (TMB), and microsatellite instability (MSI) for TCGA cancer types. All indicators were visualized using the R packages, “ggplot2,” “psych,” and “pheatmap.”
Patients and Tissue Samples
The breast cancer (BrCa) and liver cancer samples used in our study were collected at Shanghai East Hospital, Tongji University School of Medicine (Shanghai City, China). This study was approved by the Ethics Committee of Shanghai East Hospital of Tongji University School of Medicine (No.2023110, Approval Date: January 25, 2023). All enrolled participants provided written informed consents.
Cell Culture
The MCF-7 and HepG2-C3A cell lines were cultivated in DMEM medium (319-005-CL; WISENT, Saint-Jean-Baptiste, QC, Canada) supplemented with 10% FBS (FSD500; ExCell, Shanghai, China) and 1% penicillin/streptomycin at 37°C with 5% CO2.
Immunohistochemistry
Pathological sections of BrCa and liver cancer samples underwent a meticulous procedure, including washing with xylene and rehydration with graded ethanol. Antigen retrieval was then performed under high-temperature conditions. A 2% BSA solution was applied to mitigate nonspecific antigen binding after endogenous peroxidase activity was quenched. The tissue sections were incubated overnight at 4 °C with a primary anti-DNMT1 antibody (dilution 1:50, A1020; Santa Cruz Biotechnology, Dallas, TX, USA). Subsequently, a secondary antibody was applied for 1 h at 37 °C. Visualization of the indicated protein expression was achieved using 3,3′-diaminobenzidine and hematoxylin staining. DNMT1 expression was assessed using an immunoreactivity score. 24 All micrographs were captured using an Olympus microscope (Tokyo, Japan).
Construction of a Gene Knockdown Cell Line
A previously reported shRNA sequence targeting DNMT1 was used for gene knockdown. 25 The corresponding plasmids were transfected into HEK293T cells along with the packaging plasmids, PSPAX2 and PMD.2G, maintaining a ratio of 5:3:2 to generate specific lentiviral particles. Subsequently, lentiviral infection was performed on the MCF-7 and HepG2-C3A cell lines, and selection was carried out via fluorescence detection. The specific shRNA sequence for DNMT1 knockdown used in this study was as follows: 5′-CCCAATGAGACTGACATCAA-3′.
Western Blotting
The cell lines were washed with cold phosphate-buffered saline (PBS) and then lysed with 2× protein loading buffer at 4 °C. The resulting lysates were collected, and the proteins were separated on an 8%-10% SDS-PAGE gel. Primary antibodies, including anti-DNMT1 (dilution 1:1000, 5032; Cell Signaling Technology, Danvers, MA, USA), anti-β-actin (dilution 1:1000, 20536-1-AP; Proteintech, Rosemont, IL, USA), and anti-GAPDH (dilution 1:1000, 10494-1-AP; Proteintech), were employed for protein detection. Following primary antibody incubation, the protein bands were visualized using secondary antibodies and captured with a ChemiScope 6200 Chemiluminescence imaging system (Clinx, Shanghai, China).
Clone Formation Assay
A total of 3000-5000 cells that had been stably infected with lentiviruses were seeded into six-well plates and cultured for 10 days. The colonies were thereafter stained with crystal violet.
Cell Viability Assay
A total of 2000 cells were evenly distributed into each well of 96-well plates, with at least three wells for each condition, and incubated for 24, 48, and 72 h. Cell viability was thereafter assessed using a microplate reader.
Wound Healing Assay
MCF-7 cells were seeded into 96-well plates and grown to confluence. Thereafter, a controlled artificial scratch was introduced onto the cell monolayer using a plastic pipette tip. Following the scratch, cellular residues were removed by washing with PBS, and the wounded monolayer allowed to heal for 30 h in the growth medium.
Boyden Chamber Assay
Cells were cultured in 24-well Boyden chamber plates with an 8.0-µM pore diameter (14311; LabSelect, Anhui, China). Single-cell suspensions (2 × 10⁴) were seeded into the upper chamber in serum-free DMEM. Cells were then migrated for 48 h at 37 °C, fixed, and stained with 0.5% crystal violet. The number of cells that traversed the lower membrane were counted using an Olympus microscope.
Statistical Analysis
Data for the bioinformatics analyses were analyzed using RStudio software, whereas the experimental data were analyzed using GraphPad Prim 9.0 (GraphPad Software, La Jolla, CA, USA). Statistical analysis was mainly conducted via t-tests or Wilcoxon tests and presented as the mean ± standard deviation. Statistical significance was considered significant if P-values were <.05, <.01, <.001, or <.0001, denoted as “*,” “**,” “***,” and “****,” respectively.
Results
Expression Level Analysis of DNMT Family Genes in Different Cancers
To explore the expression of DNMT family genes in different cancers, we first examined their transcriptional expression using TCGA and GETx databases. Figure 1 shows that DNMT1/DNMT3A/DNMT3B were highly expressed, whereas TRDMT1 and DNMT3L were expressed at low levels in the 23 selected cancers (Figure 1A and B). The Wilcoxon test was employed for statistical analysis to assess the differences in DNMT family gene expression between normal and tumor samples, as depicted in Figure 1C-F and Supplemental Figure 1. Our findings revealed a substantial upregulation of DNMT1 expression across various cancer types, including BLCA, BRCA, CHOL, COAD, HNSC, LIHC, READ, and STAD, among others (Figure 1C; Supplemental Figure 1B). DNMT3A and DNMT3B were also highly expressed in BLCA, BRCA, HNSC, LIHC, LUAD, LUSC, STAD, and UCEC (Figure 1D and E; Supplemental Figure 1C and D). In contrast, BRCA, KICH, KIRP, LUAD, LUSC, and THCA showed low TRDMT1 and DNMT3L expression levels (Figure 1F; Supplemental Figure 1A, E, and F). A similar analysis of the GEO database revealed that DNMT1/DNMT3A/DNMT3B were highly expressed in BRCA, CHOL, COAD, GBM, HNSC, LIHC, LUAD, and LUSC compared to the normal group (Supplemental Figure 2A-C). However, TRDMT1 was expressed at low levels in BRCA, HNSC, LUAD, and LUSC, and DNMT3L was expressed at low levels in CHOL, LIHC, and KIRC (Supplemental Figure 2D and E).

Expression patterns of DNMTs in distinct cancer types. (A) Gene expression in diverse cancers. (B) DNMT family gene expression levels among 23 different cancer types from the TCGA database. The gradation of color indicates high or low expression based on the log2 fold change (FC) value. (C-F) Differential expression of DNMT1, DNMT3A, DNMT3B, and TRDMT1 between tumor and normal tissues in diverse cancers. The red box represents the expression level of tumor tissues and the blue box represents that of normal tissues. (G and H) Protein expression of DNMT1 in BrCa and liver cancer tissues compared to that in paracancerous tissues via IHC staining. *P < .05; **P < .01; ***P < .001.
We then conducted a detailed investigation of the correlation between DNMT1 expression and lymph node metastasis, tumor size, clinical stage, tumor differentiation, and subclasses of BrCa and liver cancer (Supplemental Figure 3). The results showed that upregulated DNMT1/DNMT3B expression had a noticeable positive association with metastatic lymph node and increased tumor size (Supplemental Figure 3A). In contrast to low-grade malignant luminal A/B and HER2+, DNMT1 expression of triple-negative BrCa was dramatically elevated in BRCA (Supplemental Figure 3B). In contrast to patients’ early stages and highly differentiated tumors, DNMT1/DNMT3B showed increased expression in the late stage and in poorly differentiated tumors (Supplemental Figure 3C and D). Moreover, immunohistochemistry (IHC) staining showed a significant upregulation of DNMT1 expression in BrCa and liver cancer tissues when compared with that in paracancerous lesions (Figure 1G and H).
General Prognosis of DNMT Family Genes in Diverse Cancers
To gain a more complete picture of the prognosis of DNMTs across diverse cancer types, we examined the four key prognostic indicators: OS, PFS, DFS, and DSS, using a regression model. Figure 2 shows that DNMT1 is a prognostic risk factor for ACC, KICH, KIRP, LGG, LIHC, PCPG, and PRAD, especially for the four prognostic indicators of KIRP (Figure 2A and E). DNMT3A was found to correlate with poor prognoses in several cancers, including ACC, CESC, COAD, KIRC, KIRP, LGG, LIHC, LUSC, PRAD, READ, SARC, TGCT, and UCEC, particularly for the four prognostic indicators of ACC and UCEC (Figure 2B and F). DNMT3B was identified as an unfavorable factor for poor prognosis in several cancers, including ACC, CESC, KICH, KIRC, KIRP, LGG, LIHC, LUSC, PRAD, SARC, THCA, and UCEC. Its heightened risk was particularly observed in LGG across all four prognostic indicators (Figure 2C and G). TRDMT1 was identified as an adverse prognostic factor for ACC, BLCA, CESC, HNSC, KICH, LIHC, and SARC (Figure 2D and H). Moreover, DNMT3L exhibited a high-risk association with BLCA, DLBC, KIRC, LGG, SARC, STAD, THYM, and UCEC (Supplemental Figure 4A and B). Collectively, these findings suggest that DNMT family genes hold promise as potential targets for both diagnostic and prognostic purposes in patients with cancer.
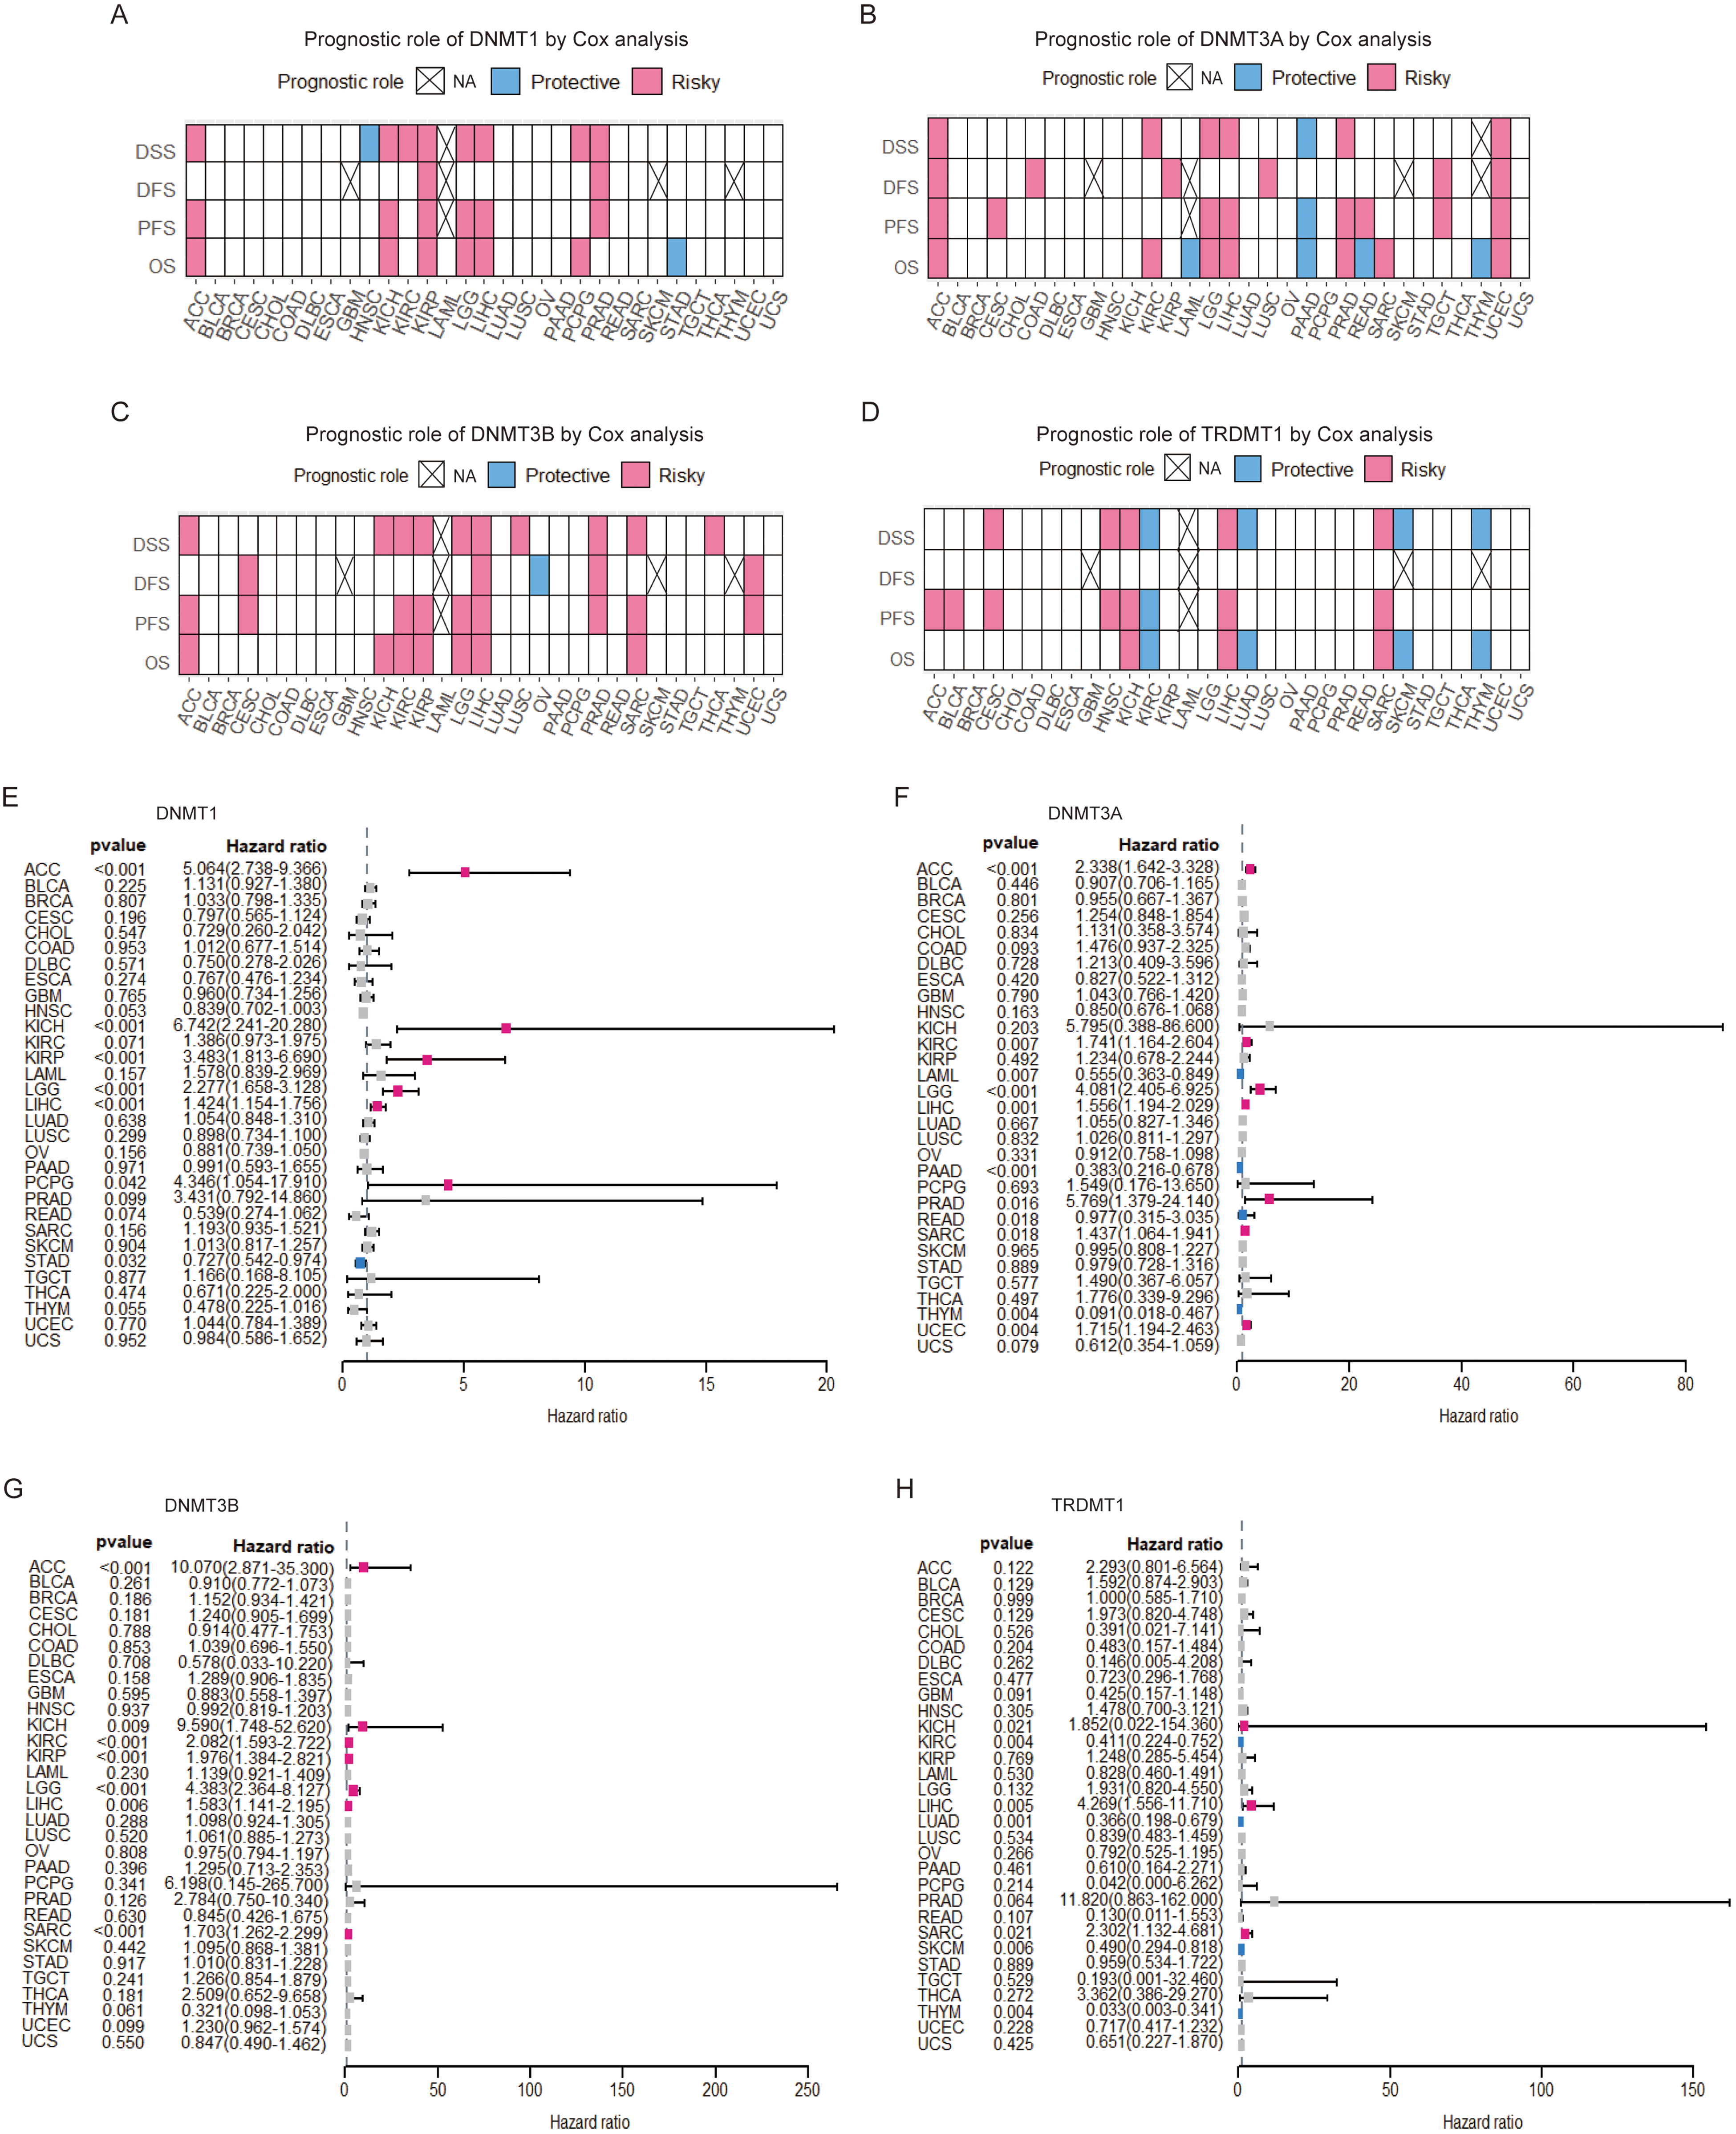
Univariate Cox regression model for the prognostic role of DNMTs in various cancers. (A-D) Correlations between DNMT1, DNMT3A, DNMT3B, and TRDMT1 expression in OS, PFS, DFS, and DSS are summarized in the heat map by Cox regression analysis of multiple cancers. (E-H) Forest maps showing the prognostic value of DNMTs for OS in TCGA cancers via the univariate Cox proportional hazard regression model. A hazard ratio greater than 1 (HR > 1) is marked in red and implies a risk factors for patient prognosis. Hazard ratios below 1 (HR < 1) are marked in blue and implies a protective factor for patient prognosis. White color is considered statistically significant. OS, overall survival; PFS, progression-free survival time; DFS, disease-free survival time; DSS, disease-specific survival time.
Relevance of DNMT Family Genes to Proliferation, EMT Signatures, and Stemness Scores Across Cancers
To understand the impact of DNMTs on cancer phenotypes, we examined their correlation with Ki67 expression, a specific proliferation marker, 26 EMT signatures, and cell stemness. Notably, Ki67 mRNA expression was positively associated with DNMT1 (R = 0.84, P = 5.9e-07), DNMT3A (R = 0.36, P = .046), and DNMT3B (R = 0.63, P = 2e-04), but not with TRDMT1 (R = 0.061, P = .74) and DNMT3L (R = 0.26, P = .16) in all TCGA cancers (Figure 3A-D; Supplemental Figure 5A). Spearman's correlation analysis revealed a significant positive association between DNMT1, DNMT3A, DNMT3B, and TRDMT1 expression and EMT signatures across various cancer types (Figure 3E-H). When considering all marker genes longitudinally in each cancer type, the most notable positive correlation with EMT signatures was found for DNMT1 expression in ACC, KIRC, KIRP, LIHC, LUAD, TGCT, and THCA (Figure 3E). The positive correlation between DNMT3A expression and EMT signatures was most prominent in KIRC, LIHC, TGCT, and THCA (Figure 3F). DNMT3B expression showed the most notable positive association with EMT signatures in LIHC and SARC (Figure 3G). Additionally, the most significant positive relationship between TRDMT1 expression and EMT signatures was observed in BRCA, HNSC, KICH, KIRC, KIRP, LIHC, PAAD, THYM, and UCEC (Figure 3H). Conversely, DNMT3L expression and EMT signatures had a predominantly negative impact on most cancers, particularly BRCA, HNSC, LIHC, and UCEC (Supplemental Figure 5B).

Association of DNMTs expression with proliferation and the epithelial–mesenchymal transition phenotypes among diverse cancer types. (A-D) Spearman's correlation analysis was employed to analyze the relationship of DNMT1, DNMT3A, DNMT3B, and TRDMT1 with Ki67 expression across different TCGA cancer types. FDR_level and rho_level denotes significant differences and the Spearman's rank correlation coefficient, respectively. (E-H) The heat map shows the relationship between DNMT1, DNMT3A, DNMT3B, and TRDMT1 expression and the EMT score in 31 cancer types. Orange color represents a positive correlation and blue color represents a negative correlation. *P < .05; **P < .01.
Two stemness indicators were used to analyze the association between DNMT expression and cell stemness. For mRNAsi, the expression of DNMT1/DNMT3B/TRDMT1 showed a strong negative correlation in multiple cancers, particularly in LGG and CESC, whereas DNMT3A and DNMT3L showed an opposite trend (Figure 4A). For mDNAsi, the expression of DNMT1/DNMT3A/DNMT3B exhibited a positive correlation with various cancer types, including LIHC, STAD, ACC, TGCT, SKCM, THYM, LUSC, and BLCA. However, in cancers such as THCA, PAAD, LIHC, PRAD, STAD, and SARC, the expression of DNMT3B/TRDMT1/DNMT3L exhibited a negative correlation (Figure 4B). In summary, these findings indicate that DNMTs are closely associated with tumor proliferation, the EMT, and cell stemness.

Correlation of DNMT family genes expression with cell stemness. (A, B) Relationship between DNMT expression and stemness indices, including the mRNA expression-based stemness index (mRNAsi) and DNA methylation-based stemness index (mDNAsi), in 31 TCGA cancers. Red squares indicate a positive correlation and blue squares a negative correlation. *P < .05; **P < .01.
Correlation Analysis Based on DNMTs and the TME Among Various Types of Cancer
To further investigate the relationships between DNMT family genes and the TME, relevant indices were systematically evaluated among several types of cancers based on the transcriptional profiles (Figure 1C-F, Supplemental Figure 1). Figure 5A shows that DNMT1 expression positively correlated with immune, stromal, and ESTIMATE scores in KIRC, PRAD, and THCA, whereas a negative association was observed in CESC, GBM, LUSC, and UCEC. Similarly, in Figure 5B, the association of DNMT3A expression was negatively associated with BLCA, LUAD, LUSC, and UCEC. As shown in Figure 5C, DNMT3B expression was negatively associated with numerous types of cancers, including BLCA, CESC, GBM, HNSC, KIRP, and LIHC, among others. In addition, BRCA and LUSC exhibited a positive relationship whereas THCA exhibited a negative relationship between TRDMT1 expression and immune, stromal, and ESTIMATE scores (Figure 5D). Three cancers (KIRC, STAD, and UCEC) with a negative correlation were observed between DNMT3L expression and immune, stromal, and ESTIMATE scores (Figure 5E). Nevertheless, the correlation trend observed between DNMT expression and tumor purity was opposite to that of the immune, stromal, and ESTIMATE scores of various cancers (Figure 5A-E). In short, these data imply that DNMTs play an important role in the TME.
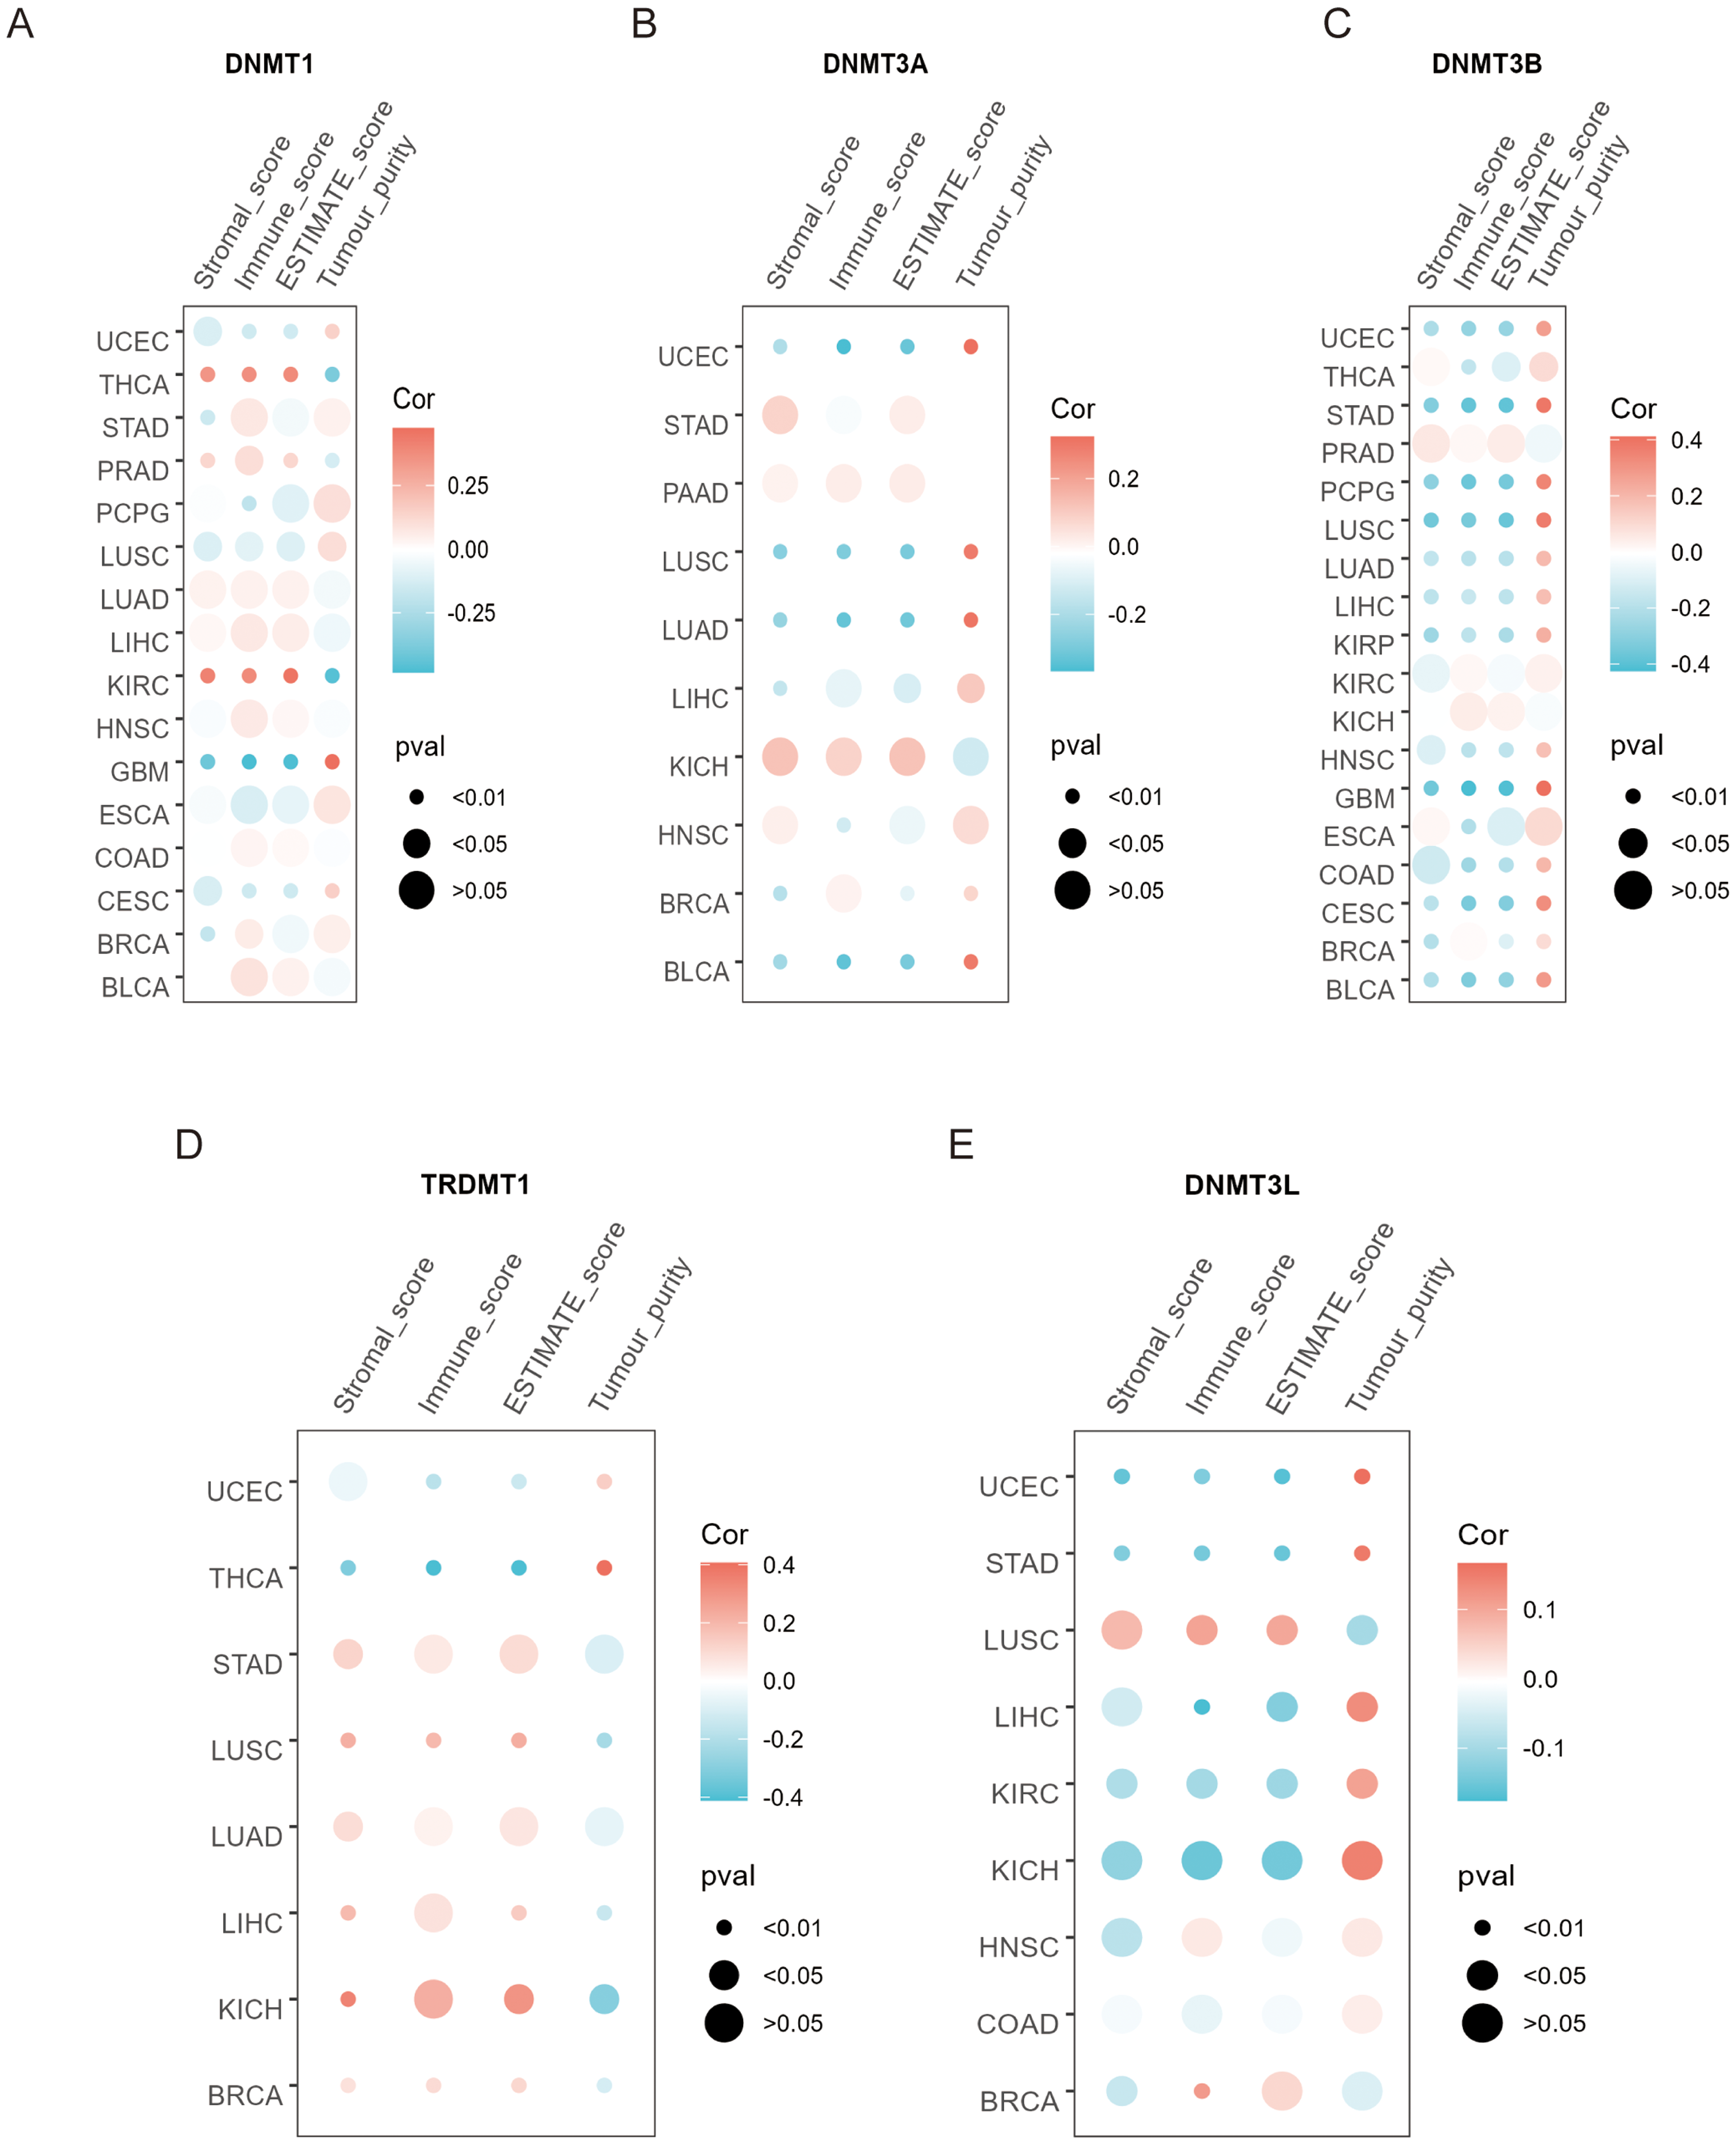
Association analysis between DNMT family genes expression and immune, stromal, and ESTIMATE scores, as well as with tumor purity, in different cancers.
Immune Cell Infiltration Analysis of DNMT Family Genes in Various Cancers
To investigate the influence of DNMT family genes on TIICs, we assessed the association between DNMT1 and DNMT3A expression with different immune cells in various types of cancer. The results showed that DNMT1 was positively associated with the immune infiltration levels of B cells, T cells (CD4+ and CD8+), dendritic cells (DCs), endothelial (Endo) cells, cancer-associated fibroblasts (CAFs), macrophages, monocytes, neutrophils, natural killer (NK) and Tfh cells, regulatory T cells (Tregs), and MDSC cells in different cancers. However, eosinophil (Eos) cells, hematopoietic stem cells (HSCs), progenitor and mast cells, natural killer T cells (NKTs), and γδT cells presented a negative relationship with DNMT1 expression (Figure 6). Moreover, DNMT3A expression was positively correlated with the infiltration levels of B and T cells, DCs, Endo cells, CAFs, HSCs, monocytes, neutrophils, NK and Tfh cells, Tregs, and MDSCs, but negatively associated with Eos and progenitor cells, macrophages, mast cells, NKTs, and γδTs in multiple cancers (Supplemental Figure 6).

Relationship analysis of DNMT1 expression with the tumor-infiltrating levels of immune cells in various cancer types. Tumor-infiltrating immune cells: B cells, T cells (CD4+ and CD8+), dendritic cells (DCs), endothelial (Endo) and eosinophil (Eos) cells, cancer-associated fibroblasts (CAFs), hematopoietic stem cells (HSCs), progenitors of lymphoid/myeloid/monocyte (progenitor) cells, macrophages, mast cells, monocytes, neutrophils, natural killer (NK) and T cell follicular helper (Tfh) cells, natural killer T cells (NKTs), regulatory T cells (Tregs), gamma delta T cells (γδTs), and myeloid-derived suppressor cells (MDSCs). A positive correlation is represented in red and a negative correlation represented in blue.
Association Analysis of DNMT Expression with Immunomodulators, TMB, and MSI
To gain familiarity with the immunological markers, various immunomodulators comprising MHC, immunoinhibitors, immunostimulators, and immunocheckpoints have been identified for their association with DNMT1/DNMT3A/DNMT3B expression across different types of cancer. For MHC, DNMT1/DNMT3A/DNMT3B expression was significantly and favorably associated with MHC, particularly in PAAD, STAD, HNSC, BRCA, LGG, PRAD, KIRC, LIHC, CHOL, and KICH (Figure 7A). DNMT1/DNMT3A/DNMT3B expression was positively associated with immunoinhibitors in DLBC, KICH, CHOL, KIRP, THCA, KIRC, and BRCA, including IL10, PDCD1, CILA4, CD96, IDO1, LGALS9, and IL10RB (Figure 7B). Figure 7C shows that DNMT1/DNMT3A/DNMT3B expression was favorably associated with immunostimulators (CD48, IL6R, CD28, CXCR4, LUBP1, MICB, LTA, CD40LG, CXCL12, CD70, and TMIGD2) in THYM, DLBC, KICH, KIRC, CHOL, LIHC, BRCA, and PRAD. As shown in Figure 7D, immunocheckpoints (PDCD1, CILA4, CD200, BTLA, CD276, PVR, and LAIR1) were positively correlated with DNMT1/DNMT3A/DNMT3B expression in DLBC, CHOL, KIRP, LIHC, PRAD, and BRCA. In addition, TGCT, LUSC, THYM, and GBM presented the most significant negative correlations between MHC and DNMT1/DNMT3A/DNMT3B expression (Figure 7A). The most notable negative association between immunoinhibitors and DNMT1/DNMT3A/DNMT3B was observed in TGCT (Figure 7B).
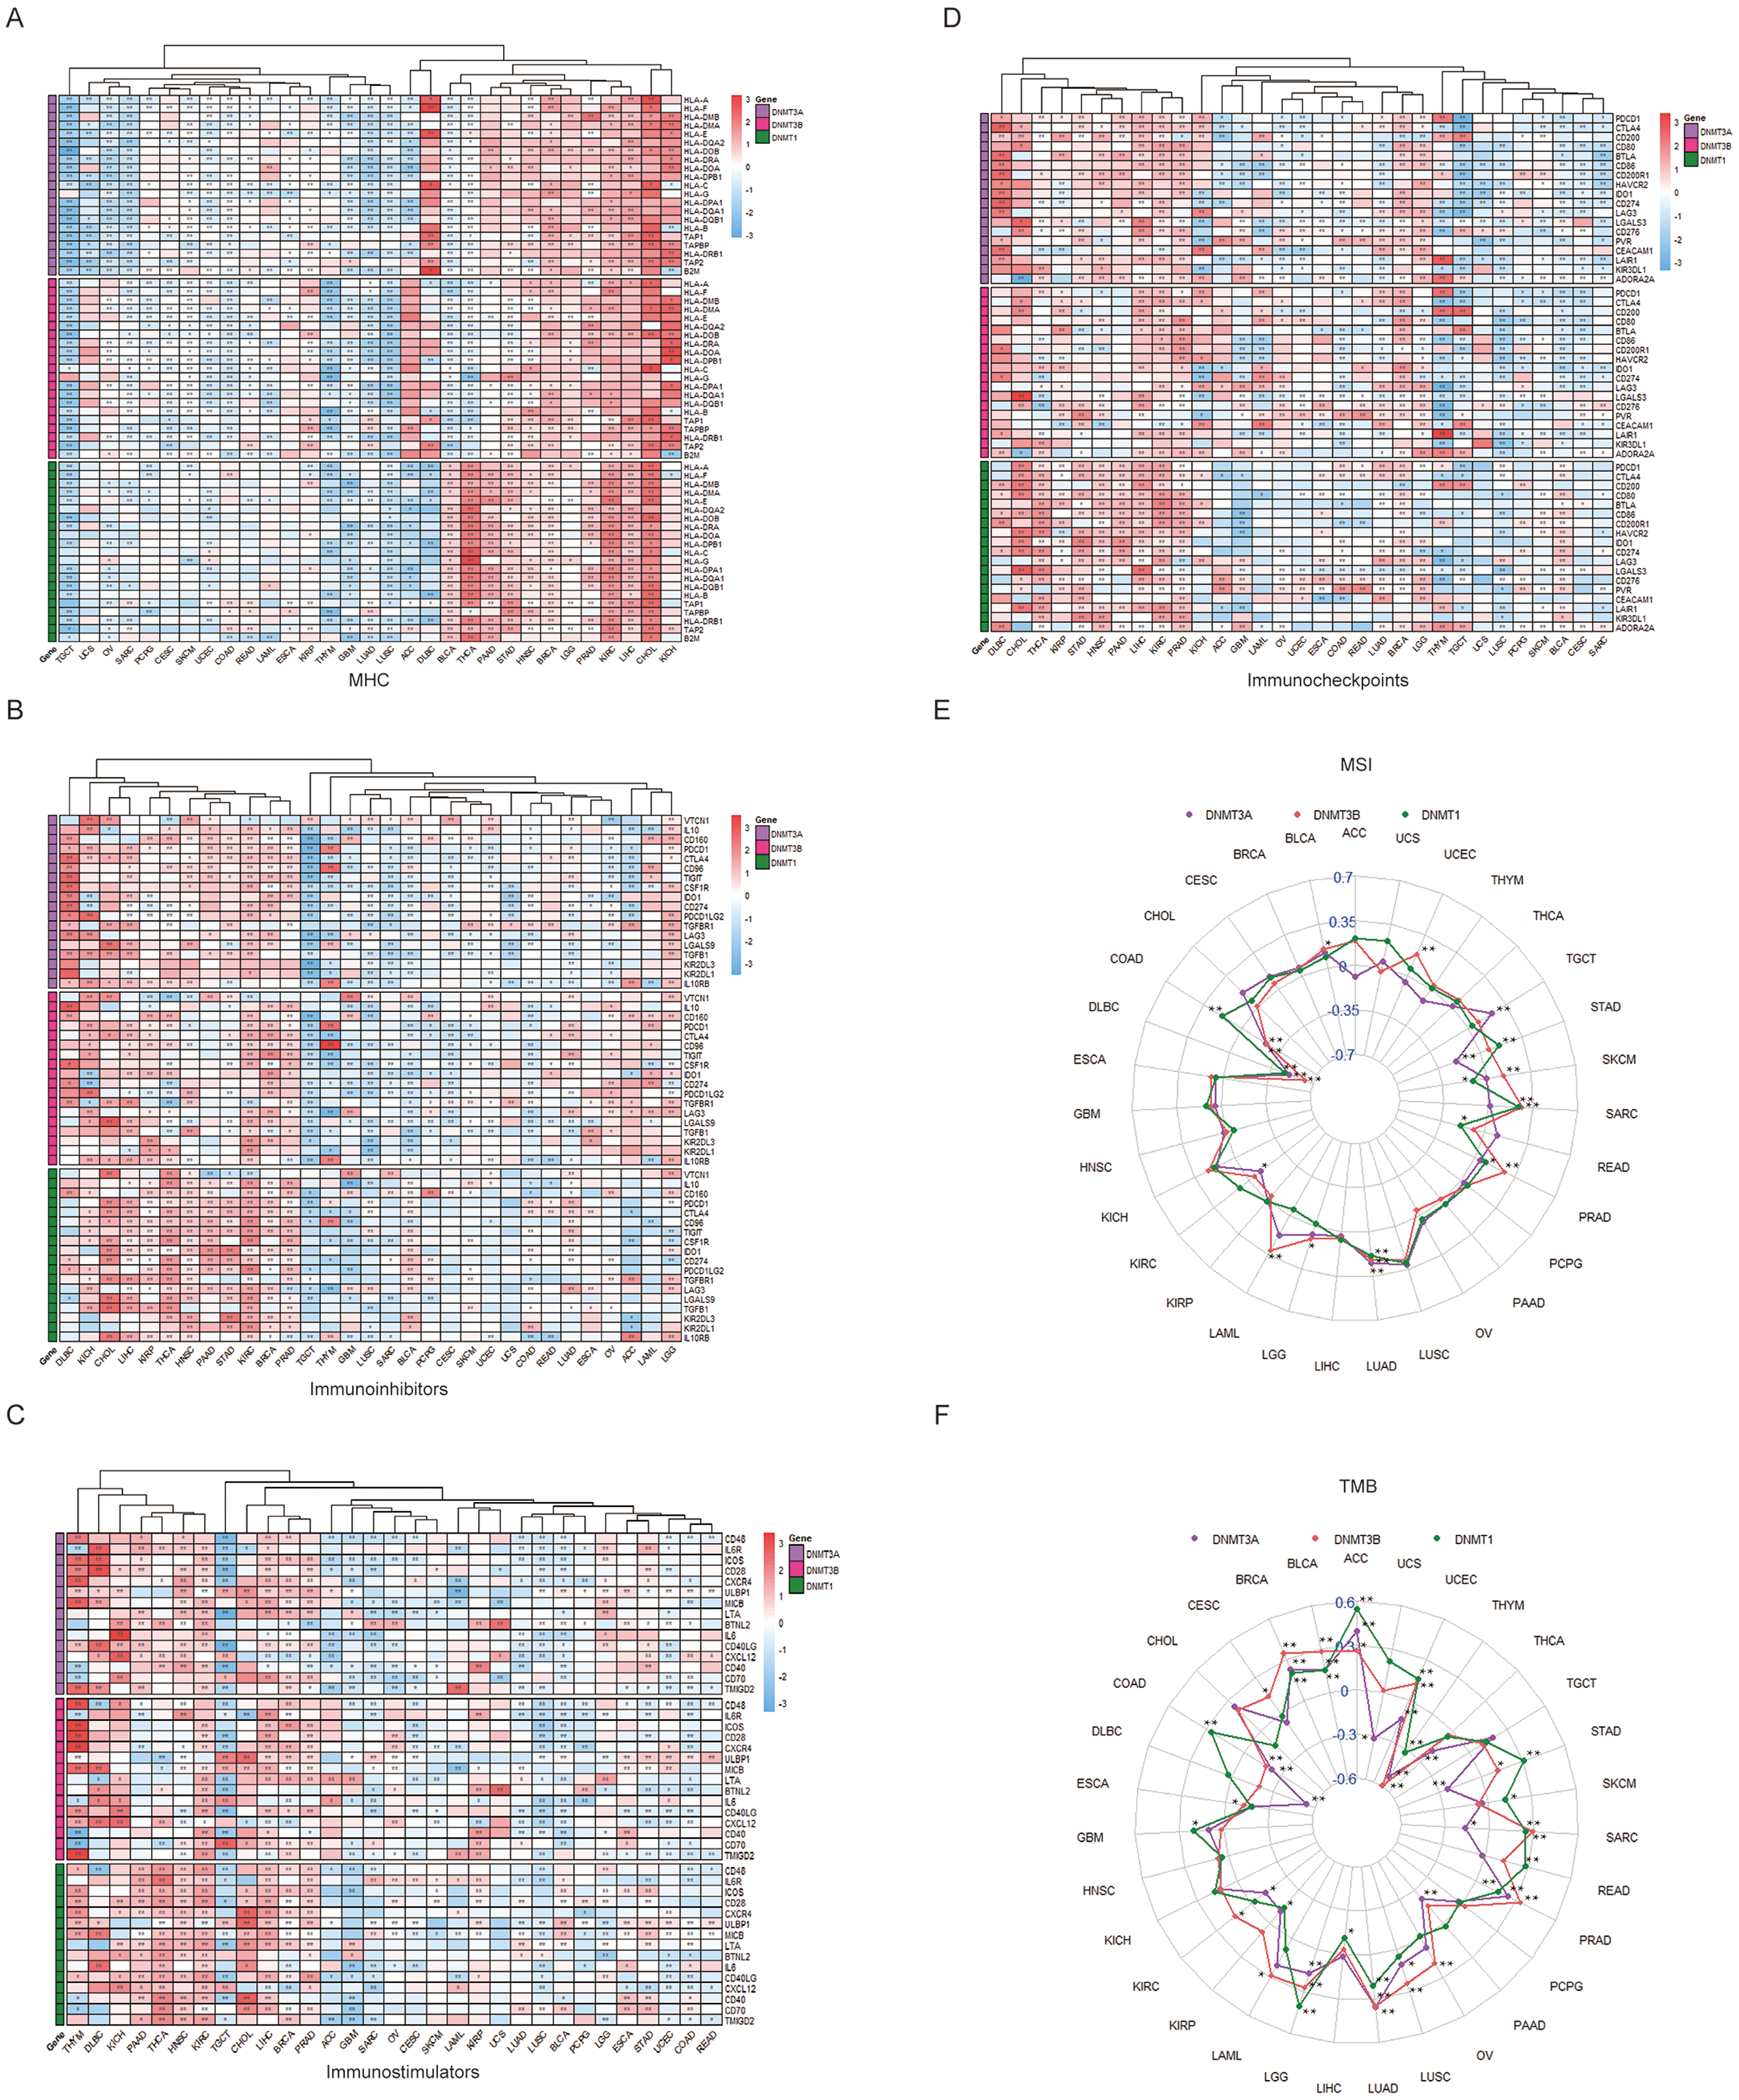
Relationship of DNMT1/DNMT3A/DNMT3B expression to immune-related modulators, MSI, and TMB in pan-cancer. (A-D) Relationships between DNMT1/DNMT3A/DNMT3B expression and MHC (A), immunoinhibitors (B), immunostimulators (C), and immunocheckpoints (D) based the TCGA database. Red color represents a positive correlation and blue a negative correlation. (E-F) Correlation analysis of DNMT1/DNMT3A/DNMT3B expression with MSI and TMB in distinct cancers. MSI, microsatellite instability; TMB, tumor mutation burden. *P < .05; **P < .01.
To predict the potential efficacy of immunomodulators, we employed a relevance analysis to estimate the relationship between DNMT1/DNMT3A/DNMT3B expression with MSI and TMB. The expression of DNMT1 in COAD, LUAD, PRAD, SARC, and STAD was positively associated with the MSI value, but negatively associated with it in DLBC, READ, and SKCM. The expression of DNMT3A in LUAD and TGCT positively correlated with the MSI value, but negatively correlated with it in COAD, DLBC, KIRC, and STAD. The expression of DNMT3B in BLCA, LAML, LGG, LUAD, PRAD, SARC, SKCM, and UCEC was positively correlated with the MSI value, but negatively correlated with it in COAD and DLBC (Figure 7E). Figure 7F shows that DNMT1/DNMT3A/DNMT3B expression was positively correlated with the TMB value in ACC, BLCA, BRCA, LUAD, LUSC, PRAD, STAD, and UCEC. However, COAD and THYM showed a negative relationship between DNMT1/DNMT3A/DNMT3B expression and the TMB value. These results indicate that the DNMT1/DNMT3A/DNMT3B expression levels are associated with tumor immunotherapy.
Dysregulated DNMT1 Expression Suppresses Cell Proliferation and Behavior in Tumors
According to the bioinformatics analyses of DNMTs, DNMT1 exhibited significant prognostic value and a remarkable correlation with Ki67 expression and EMT signatures. To further elucidate the role of DNMT1 in MCF-7 and HepG2-C3A cell lines, we conducted western blotting analyses, along with clone formation, cell viability, wound healing, and Boyden chamber assays. After knockdown of DNMT1 expression (Figure 8A), we observed a sharp reduction in cell growth (Figure 8B). In Figure 8E and F, it can be observed that DNMT1 knockdown reduced cell viability in MCF-7 and HepG2-C3A cells compared to that of the vector. To assess cell migration capabilities, wound closure areas were estimated, where shDNMT1 MCF-7 cells showed a slower migration than that of the control group (Figure 8C). MCF-7 and HepG2-C3A cells infected with the shDNMT1 lentivirus were allowed to migrate for 48 h on Boyden chamber membranes. The results showed a clear reduction in the number of migratory cells compared to that of the control group (Figure 8D). In brief, these results suggest that DNMT1 regulates the proliferation and migration of BRCA and LIHC cells in vitro.

Proliferative and behavioral roles of DNMT1 in cancer cells. (A) Knockdown efficiency of virus-infected shDNMT1 measured in MCF-7 and HepG2-C3A cells via western blotting. (B) Colony formation ability of MCF-7 and HepG2-C3A was determined after knocking down DNMT1 expression, and the colony numbers thereafter counted. (C) MCF-7 cells infected with shDNMT1-virus were permitted to migrate for 30 h, and the wound healing area thereafter measured and counted. Bar = 10 μm. Objective lens magnification = ×20. (D) A Boyden chamber assay was used to analyze the effect of knocking down DNMT1 expression on cell migration for 48 h, and the number of migratory cells per field microscopically counted. Bar = 10 μm. Objective lens magnification = ×20. (E, F) A cell viability assay was applied to analyze the effect of knocking down DNMT1 expression on cell proliferation. *P < .05; **P < .01, ****P < .0001.
Discussion
The objective of our study was to analyze the expression patterns of key DNMT family genes in the primary tumor and paracancerous tissues of 23 different cancer types based on the TCGA database. Our results revealed that DNMT1, DNMT3A, and DNMT3B were remarkably upregulated, whereas TRDMT1 and DNMT3L were downregulated in multiple cancers. In general, DNMT expression was considered a prognostic risk factor for OS, PFS, DFS, and DSS indicators in various cancers. Although many studies have focused on DNMT1, DNMT3A, and DNMT3B, the correlation between DNMT family genes with the TME and antitumor immunity in various cancers remains unclear. Therefore, this is the first systematic investigation of EMT signatures, stemness scores, the TME, and immunotherapy biomarkers of DNMT family genes combined with multiple databases for various cancers.
DNMT1 is responsible for sustaining DNA methylation, whereas DNMT3A and DNMT3B are recognized for their proficiency to orchestrate de novo DNA methylation.27,28 Previous studies have suggested that high levels of DNMT1 mRNA and activity are associated with a poor prognosis in patients with hepatocellular carcinoma. 29 Patients with late-stage metastatic melanoma had prominently increased DNMT1 protein expression levels compared to those observed in normal tissues. 8 Jin et al found that overexpressed Linc00942 enhanced DNMT3A expression and was related to hypermethylation in gastric cancer. 30 DNMT3B is aberrantly overexpressed in several human cancers, such as BrCa, colorectal cancer, and ovarian cancer.31–33 In our expression profile analyses, discernible increases in DNMT1, DNMT3A, and DNMT3B transcription levels were observed in BRCA, COAD, SKCM, and OV, and DNMT1 showed high protein expression levels in BRCA and LIHC pathological sections, which is consistent with previous studies. Although other cancers also showed remarkable differences in DNMT1, DNMT3A, and DNMT3B expression compared with that in paracancerous tissues, reliable experimental evidence is needed.
It is generally assumed that cancer cells possess high EMT characteristics, which drive the metastatic potential and proliferation into new tumor tissues.34,35 Our results showed that DNMT1, DNMT3A, DNMT3B, and TRDMT1 expression were positively associated with EMT signatures in most TCGA cancer types, including ACC, KIRP, LIHC, TGCT, SARC, CHOL, and THYM. In contrast, DNMT3L was negatively correlated with EMT signatures in multiple cancers, except for LAML, LGG, PCPG, READ, and SARC. Furthermore, the expression of DNMT1/DNMT3A/DNMT3B was notably positively correlated with Ki67 expression. However, no significant differences were observed in the association between DNMT3L and TRDMT1 with Ki67 expression. In addition, DNMT expression was highly linked to the TME. The TME is a heterogeneous and dynamic space that has a considerable impact on tumor occurrence, progression, metastasis, and immunosuppression. 36 Our findings revealed a positive correlation between DNMT1 expression and the infiltration levels of various T cell subsets, including CD4+ and CD8+ T cells, DCs, Endo cells, CAFs, macrophages, monocytes, neutrophils, Tfh cells, Tregs, and MDSCs. However, a negative correlation was observed with Eos cells, HSCs, progenitor and mast cells, NKTs, and γδTs. Another important outcome of this study was that DNMT1/DNMT3A/DNMT3B expression was related to MHC, immunoinhibitors, immunostimulators, immunocheckpoints, TMB, and MSI across various cancers. These results suggest that DNMT1/DNMT3A/DNMT3B may play a significant role in modulating the immune response in tumor cells. Therefore, these findings suggest the potential of DNMTs as crucial targets for therapeutic interventions in tumor immunotherapy.
Finally, our primary focus was to elucidate the biological role of DNMT1, specifically its effect on cell proliferation and migration. These investigations were conducted in the context of BRCA and LIHC, using experimental designs and analyses. Through systematic analysis, this study revealed the pivotal roles played by DNMT family genes in various facets of the cancer phenotype, including prognosis, proliferation, metastasis, cell stemness, and the intricate dynamics of the TME across diverse cancer types. Correlations established between the expression of DNMTs and immunomodulators offer potential novel targets for antitumor immunotherapy. Future endeavors could include extensive studies on DNMT family genes as potential immunotherapeutic targets across diverse cancers. However, it is crucial to acknowledge some of the current limitations: the notable reliance on online databases for exploration, as well as the lack of experimental validation of our findings in vivo and in vitro.
Conclusion
In summary, we performed a comprehensive analysis of the relationship between DNMTs and the prognosis, EMT signatures, cell stemness, the TME, TIICs, immunological markers, MSI, and TMB. These outcomes suggest that DNMT family genes could serve as prognostic markers for patients with cancer and may modulate the immune response, providing new perspectives for further studies on DNMTs as potential immunotherapeutic targets in diverse cancer types.
Supplemental Material
sj-docx-1-tct-10.1177_15330338241260658 - Supplemental material for Systematic Characterization of DNA Methyltransferases Family in Tumor Progression and Antitumor Immunity
Supplemental material, sj-docx-1-tct-10.1177_15330338241260658 for Systematic Characterization of DNA Methyltransferases Family in Tumor Progression and Antitumor Immunity by Fengru Huang, Xinyi Wu, Qiong Du, Jianghua Lin, Wencong Ma and Jiyong Liu in Technology in Cancer Research & Treatment
Footnotes
Abbreviations
Author Contribution
Conceptualization was done by J. Liu and W. Ma; methodology by X. Wu and J. Lin; software by F. Huang; validation by F. Huang; formal analysis by X. Wu and F. Huang; investigation by J. Lin; data curation by X. Wu and Q. Du; writing-original draft preparation by Q. Du and F. Huang; writing-review and editing by J. Liu and W. Ma; supervision by W. Ma; project administration by J. Liu. All co-authors understood and agreed with the final manuscript.
Data Availability
The original databases exhibited in this research are included in the article/supplementary material. For further inquiries regarding the contributions, please contact the corresponding author.
Declaration of Conflicting Interests
The authors declared no potential conflicts of interest with respect to the research, authorship, and/or publication of this article.
Ethical Approval
Studies involving human participants have been reviewed and endorsed by the Ethics Committee of Shanghai East Hospital of Tongji University School of Medicine (No.2023110). Patients and participants have given their written informed consent for their participation in this study.
Funding
The authors disclosed receipt of the following financial support for the research, authorship, and/or publication of this article: This work was supported by the Key Discipline Construction Project of Pudong Health Bureau of Shanghai (Grant No. PWRd2022-05).
Supplemental Material
Supplemental material for this article is available online.
References
Supplementary Material
Please find the following supplemental material available below.
For Open Access articles published under a Creative Commons License, all supplemental material carries the same license as the article it is associated with.
For non-Open Access articles published, all supplemental material carries a non-exclusive license, and permission requests for re-use of supplemental material or any part of supplemental material shall be sent directly to the copyright owner as specified in the copyright notice associated with the article.