
Abstract
Introduction
Liver cancer is the sixth most deadly malignant tumor and the third leading cause of cancer death around the world, with an estimated 906 000 new cases and 830 000 deaths in 2020. 1 Hepatocellular carcinoma (HCC) is the most common (>80%) type of liver cancer, and the incidence of HCC is expected to increase further with the growth of an aging population.2,3 The immune microenvironment of HCC is complicated due to its related factors including various cell lines, such as hepatocytes, endothelial cells, fibroblasts, epithelial cells, and immune cells. HCC is caused by multiple pathogenic factors, one of the main risk factors is hepatitis B virus (HBV) infection. Chronic HBV infection is present in up to 54% of cases of HCC. 4
Single-cell RNA sequencing (ScRNA-seq) has led to important discoveries in mammalian systems, leading to a great appreciation of the transcriptional heterogeneity of cell states and cell types. 5 Further in-depth research has found that tumorigenesis and progression of HCC are accompanied by extensive immune infiltration. 6 In this scenario, Single-cell technologies could also demonstrate the role of genes in tumors with high heterogeneity, and these studies yield great value in HCC cellular and molecular diagnosis and targeted immunotherapy.
Members of the S100 protein family (S100s) are a class of low-molecular-weight proteins with calcium-binding properties that are widely involved in various physiological and pathological processes. S100 proteins in the family bind to each other to form multimeric complexes and also bind to metal ions that affect oligomerization and protein function. 7 However, reports on the specific and intercellular roles exhibited by S100s in HCC are limited.
The scRNA-seq technology has the ability to decipher the mRNA expression of specific clusters of cells and thus has brought new insights into such studies. Therefore, we intercepted HBV-associated HCC and non-HBV-associated HCC data to construct a liver tissue cell atlas and performed a comparative analysis. Our results revealed that S100A6/S100A11 were differentially expressed in tumor T cells. By establishing developmental pathways for the T-cell subpopulations, we identified the possible effects of the nuclear factor (NF) κB pathway involved in S100s on T-cell proliferation and differentiation, providing a new concept of the effect of single genes on tumors. We also analyzed the proposed temporal expression of the programed death receptor (PD-1) in T-cell subpopulations. This study may be able to provide new potential precise therapeutic targets for patients of HCC.
Materials and Methods
Data Sources and Quality Control
We downloaded the GSE110345 8 and GSE189175 9 datasets from the GEO database (https://www.ncbi.nlm.nih.gov/geo/). Two samples from the HBV-infected, and 2 samples from non-HBV-infected HCC samples. After filtering, a total of 28 800 cells were obtained and 31 295 genes were measured for expression. This included 13 800 cells from HBV-associated samples and 15 000 cells from non-HBV-associated HCC samples. The Scater package was used for quality control of cells, 10 and the DoubletFinder package was used to filter out Doublet cells. 11 The TCGA database (https://www.cancer.gov) containing count values of gene expression levels of S100A6/S100A11 in tumor tissues of 372 HCC was selected with clinical information corresponding to their samples, and 248 samples with differential expression were further selected, the sample sizes of S100A6 patients and S100A11 patients whose TNM stage were stage I-II were 168 and 173, and the sample sizes of stage III-IV were 80 and 75.
Cell Filtration, Clustering and Cell Type Annotation
Seurat v4 in R was used to perform dimensionality reduction, clustering, and visualization for the scRNA-Seq data. 12 Principal component analysis was used for a reduction in the dimensionality of the integrated data. Reduced dimensional clustering was performed using UMAP, and subsequently, the cell type annotation was performed by combining SingleR 13 and scCATCH 14 packages and Marker genes. 15 According to the annotation, the 28 000 filtered cells were annotated as 11 cell types including macrophages, fibroblasts, T cell, B cell, dendritic cells, cancer stem cell, hepatocyte, kupffer cell, lymphoblast cell, monocyte, NK cell.
Downstream Analysis
We used the R package “clusterProfiler” to perform Kyoto Encyclopedia of Genes and Genomes (KEGG) analyses. 15 We performed KEGG pathway analysis and identified subpopulation involved in a binding site for S100s. To further validate these findings, the FindMarker function was used to obtain differential genes. The immune cell annotation method of celltypist was used to visualize the differential expression of S100s after immune cell sorting of immune cells.
Functional Enrichment Analysis
After we got subpopulation and proceeded to divide it into smaller clusters using the UMAP method, and KEGG and GO enrichment analyses were performed on each cluster. 16 The most significant enrichment pathways and significantly different genes were used to name them. Gene set variation analysis (GSVA) was implemented via the ‘gsva’ Bioconductor package. Gene set enrichment analysis (GSEA) analysis was performed on the differential genes obtained for the subpopulations. The analysis based on a nonparametric unsupervised approach, which transformed a classic gene matrix (gene-by-sample) into a gene set by the sample matrix resulting in an enrichment score for each sample and pathway.
Pseudotime
The single-cell pseudotime trajectories were generated with the Monocle 17 package in R. The newCellDataSet(), estimateSizeFactors(), and estimateDispersions() were used to perform these analyses. The detectGenes() was used to filter low-quality cells with “min_expr = 0.1,” as well as the potential trajectories of the S100s according to pseudotime, and extract pesudotime key genes for visual analysis using heat maps.
GEPIA Dataset and TIMER Database
GEPIA was used to analyze differential expression analysis, survival analysis between S100s tumor and normal tissues in HCC. 18 TIMER was used for the complete analysis of S100s immune infiltration in HCC. 19
Histology Staining
Patients diagnosed with HCC were selected by clinicopathological diagnosis and their corresponding paracancerous tissues were also selected as normal controls. The median age of the 20 patients was 62.6 years, the majority (65%) of patients were male. Among them, 14 patients were AFP-positive and 6 were AFP-negative. The Barcelona Clinic of Liver Cancer stage of A, B, and C were 8, 6, and 6, respectively. HBV infection (100%) was the dominant etiology of 20 patients enrolled in the study, and none of them had co-infection with hepatitis C virus. Overall baseline demographic and clinical characteristics are summarized in Table 1. After paraffin embedding, the paraffin blocks were cut into 2-μm-thick sections. Subsequently, the sections were rehydrated in a series of ethanol solutions (100%, 95%, and 75%). Antigen retrieval was performed in EDTA solution (pH 8.0) for 10 min in a water bath. Endogenous peroxidase activity was blocked with 3% hydrogen peroxide, and the PBS solution was removed. Primary antibodies (S100A6 at 1:500 and S100A11 at 1:1000 dilution) were applied dropwise, followed by goat anti-mouse secondary antibody and visualization with DAB staining, counterstained with hematoxylin. Immunofluorescent labeling was used to detect the classical signaling protein RELA/p65, a downstream target of NF-κB in T cells of tumor tissues.
Baseline Demographic and Clinical Characteristics of the Study Population.

Statistical Analysis
The χ2 test and Fisher's exact probability method were used to compare the 2 sample rates. Correlation analysis was performed using Spearman's rank correlation analysis. Differential genes were tested by the Wilcox rank sum test. Kaplan–Meier analysis was used to compare survival between significantly different expressions of high HCC and low HCC. Cox proportional risk regression models were used for univariate and multivariate survival analyses. Differences were considered statistically significant at P < .05.
Specific Reporting Guidelines
This study received approval from the Ethics Committee of Affiliated Renhe Hospital of China Three Gorges University (No.2022KY12). All patients provided written informed consent prior to enrollment in the study. The reporting of this study conforms to STARD guidelines. 20
Results
scRNA-seq Annotation Suggested 21 Distinct Cell Clusters in HCC
HCC single cells were divided into 21 groups using the UMAP package and cellular annotation was performed using cellmarker genes (shown in Figure 1C) and others. We obtained 11 classes of cells after dividing them into 21 clusters using UMAP. Our annotation revealed that the HCC tumors contained abundant immune cell infiltration, although there were more tumor parenchymal cells, and most cells are in S phase and G2 phase (shown in Figure 1B).

(A) Scater quality control results; (B) cell cycle score; (C) expression of various marker genes obtained according to cellmarker; (D) cells were divided into 21 groups using UMAP with a factor of 0.8; (E) atlas of liver tissue cells.
S100A6/S100A11 of S100 Protein Family are Differentially Expressed in HCC
We first obtained the differential gene sets for each celltype using FindMarkers (log2FC > 0.25) and then subjected them each to KEGG analysis, whereupon we found that the T-cell subpopulation was enriched for the S100s-associated RAGE signaling pathway (as shown in Figure 3B). We examined the source of the T-cell subpopulations and found a high proportion of HBV-associated cells and visualized the expression of S100A6/S100A11 in all subpopulations for the T-cell subpopulations (shown in Figure 2B).

(A) Percentage of cell; (B) general expression of S100A6 and S100A11; (C) differential expression of S100A6/S100A11 in immune cells; (D) differential gene # of T-cell subpopulations P < .05, log2FoldChange > 0.25; (E) S100A6 (# P < .05, log2FC = 0.79) and S100A11 (P < .05,log2FC = 0.57) are differentially expressed genes in the T-cell subpopulation.

(A) Expression of the gene with the largest differential fold in each cluster in 4 clusters; (B) the KEGG of T-cell subclusters with the downstream target RAGE receptor signal was enriched; (C) secondary UMAP downscaled into 4 clusters; (D) KEGG pathway analysis of 4 clusters. All 4 had chemokine signal enrichment and subcluster 3 had NF-κB pathway enrichment. Abbreviations: KEGG, Kyoto Encyclopedia of Genes and Genomes; NF, nuclear factor.
KEGG Reveals Activation of the NF-κB Signaling Pathway in T Subpopulations
The T-cell subpopulation was further clustered using UMAP and 4 clusters were obtained before differential gene analysis was performed. Each group was found to be enriched for the chemokine signaling pathway and antiviral response. Meanwhile, we found that T-cell subpopulation 3 was enriched in these 2 pathways, but also in the NF-κB signaling pathway, a downstream pathway of S100s (shown in Figure 3D KEGG-3) and the genes with the maximum differential expression fold were selected to represent each group (as shown in Figure 3C).
Pseudotime and GSEA/GSVA Show NF-κB Enrichment at a Crucial Stage in T-Cell Development
The developmental trajectory of the T-cell subpopulation was constructed and the subcluster 3, which was significantly enriched in NF-κB pathway, was in the tumor-mimetic hub by the proposed temporal changes (as shown in Figure 4A). GSVA analysis and GSEA analysis of the 4 groups of T-cell subpopulations revealed that there was significant up-regulation of activation of NF-κB pathway and apoptotic signaling, while there was down-regulation of KRAS signaling pathway was suppressed (shown in Figure 4B). GSVA analysis revealed that the 4 clusters were consistent in DNA repair, P53 signaling pathway and cellular levels of oxidative phosphorylation levels (shown in Figure 4D). In previous studies, the HCC microenvironment has been reported to promote the transition of infiltrating CD8+ T cells to a state of failure and even occasionally inhibit their function.

A: classification by cluster and proposed chronological order by pseudo-time. The cell trajectory is from right to left, as judged by pseudo-time and gene expression. The NF-B-enriched subcluster 3 cells were found to be basically in the hub by monocle per proposed chronological order. (B) GSEA exhibits statistically different signaling pathways, P < .05; (C) Pseudotime hub gene extraction; (D) GSVA of the 4 subclusters. Abbreviations: GSVA, gene set variation analysis; GSEA, gene set enrichment analysis; NF, nuclear factor.
S100A6/S100A11 is Correlated with the Prognosis of HCC
Comparison of survival rates between high and low S100A6/S100A11 expression in HCC samples from TCGA data was conducted using the GEPIA online tool, as depicted in Figure 5B. The group with high S100A6/S100A11 expression exhibited a poorer prognosis than the group with low expression (P < .05). COX regression models were developed for each clinical factor, and the forest plot showed that the risk ratio of S100A6/S100A11 was >1, indicating it as an independent risk factor, as illustrated in Figure 5A.

(A) Forest plot using each clinical factor and S100A6/S100A11. (B) S100A6K-M survival curve# p < .05 and S100A11K-M survival curve# p < .05, with a lower survival ratio of highly expressed S100A6/S100A11. (C) columnar plots based on clinical prognostic factors of tumors. (D) The expression of S100A6/S100A11 in different stages of hepatocellular carcinoma (HCC), and median expression of S100A6/S100A11 was positively correlated with stage.
To further investigate the impact of S100A6/S100A11 on survival outcomes, each S100A6/S100A11 was categorized into high and low groups based on the median expression value. The correlation between expression levels and clinicopathological factors was then assessed using the chi-square (χ2) test. The findings indicated a significant association between S100A6 and tumor stage (P < .05), with a higher proportion of patients in the S100A6 low expression group having an early stage. Similarly, a correlation was observed between S100A11 and tumor grade (P < .05), with the majority of patients in the S100A11 low expression group having a low grade.
Histology Staining
Histology staining revealed that S100A6/S100A11 was differentially expressed in tumor and paraneoplastic tissues. Generally, its expression in the cytoplasm of HCC samples was significantly obviously than in the paraneoplastic tissues (as shown in Figure 6B). Meanwhile, a small amount of S100A6/S100A11 was also weakly expressed in paraneoplastic tissues of HCC samples associated with HBV infection. In addition, we also performed tissue analysis from liver abscess samples and also found that S100A6/S100A11 was expressed in the cytoplasm, suggesting that S100A6/S100A11 was also associated with viral infection and inflammation (shown in Supplemental Figure 1). Using the red immunofluorescence labeling of the RELA/p65 protein, NF-κB was found to be translocated in the nucleus of tumor cells. The addition of CD8/p65/S100A6 and CD8/p65/S100A11 triple immunofluorescence labeling revealed the expression of the S100 protein in the cytoplasm of T cells, the entry of the cytosolic NF-κB signaling product p65 into the nucleus, and the presence of nuclear factor receptor translocation (as shown in Figure 6D).

(A) Differential expression of S100A6/S100A11 in TCGA in hepatocellular carcinoma (HCC) and normal tissues. (B) Immunohistochemistry of S100A6/S100A11 in HCC and normal tissues. (C) Immunohistochemical staining of 20 samples was recorded according to the intensity of tissue staining. Tan, 3 points (strong positive); brow, 2 points (positive); light yellow, 1 point (weakly positive); and without staining, 0 points (negative). Histogram of the intensity score of S100A6/S100A11 staining in HCC cells. (D) CD8/p65/S100A6 and CD8/p65/S100A11 triple-labeled immunofluorescence labeling. (E) S100A6/S100A11 protein network interaction profiles, both of which interact with RAGE proteins.
Discussion
Applications of single-cell sequencing in cancer research have revolutionized our understanding of the dynamics and biological characteristics within cancer lesions. 21 Single-cell sequencing could provide new promising strategies for cancer diagnosis, targeted therapy, and prognosis prediction.22–24 We used scRNA-seq to investigate the role of S100s in the immune microenvironment. By completing the hepatocyte atlas and KEGG analysis of each subpopulation, we found that the T-cell subpopulation was enriched for the RAGE receptor signaling pathway. It was reported that S100s can bind to RAGE receptors by forming heterodimers and exert promotive or inhibitory effects on downstream intracellular targets such as MAPK, NF-κB, PI3 K, and JAK/STAT.25–27 Therefore, we speculated that S100s may function in T-cell subsets after binding to RAGE receptors and found that S100A6/S100A11 was differentially expressed in T-cell subsets. S100A11 secreted by HCC tumor cells was reported to promote HCC proliferation and migration, while S100A6 could be involved in migration, cytoskeleton dynamics, signaling pathways, and cell cycle as well as metabolism of HCC cells, and high expression of S100A6 could contribute to metastasis of HCC cells.28–31 The low percentage of cells found in NHBV samples by sourcing T-cell subpopulation cell samples may also be associated with a weaker response to immunotherapy in nonviral HCC, especially NASH-HCC. 32 Thus, it is conceivable that immunotargeted therapy may be more effective for HCC with HBV infection in the future.
To explore the downstream targets of S100s, we proceeded to divide the T-cell subpopulation into 4 groups and found that its associated target NF-κB was significantly enriched in subgroup 3. We then conjectured that S100s act on the NF-κB pathway after binding to the RAGE receptor. In previous reports, NF-κB is able to participate in the regulation of immune checkpoints on the surface of tumor cells.33,34 After persistent activation of NF-κB, NF-κB dimers containing p65 can make cancer cells immunosuppressed.35,36 NF-κB can interact with S100s while bind to the calmodulin promoter to accelerate viral transcription. At the same time, S100s can promote HCC metastasis by activating the expression of NF-κB-dependent MMP-9 expression.37,38 This could be a possible mechanism of immunotargeted therapy is more effective for HCC with HBV infection.
Since the immune microenvironment of HCC is a complex environment formed by a mixture of different immune cells, S100s are important mediators for tumor cells to exert their invasive effects in the study of the tumor immune microenvironment.39,40 To this end, we constructed developmental pathways for the T-cell subpopulation and found that subgroup 3, which is significantly enriched in NF-κB, is in the mimetic hub and may have an impact on T cells. Furthermore, we found significant activation of NF-κB in the T-cell subpopulation by GSEA/GSVA, while the entire T-cell subpopulation is in a depleted state with reduced DNA repair capacity and inactivation of P53. We then hypothesized that activation of NF-κB pathway mediated by S100A6/S100A11 in the proposed pivotal stage could affect the activity and differentiation of T-cell subpopulations and modulate T-cell antitumor activity.
Subsequently, we confirmed the temporal and spatial concordance of S100A6/S100A11 and NF-κB by immunofluorescence. Combining the TCGA database and various other methods, we found that S100A6/S100A11 was differentially expressed in tumor and normal tissues, and correlated with prognosis. Intercellular communication inference revealed that liver cancer cells are more closely associated with T and B cells (as shown in Figure 7A), which are also the most abundant population in the tumor microenvironment of solid tumors. 41 S100s may play an anti-inflammatory role in immune cells of normal tissues, while in tumor tissues they are involved in the activation of NF-κB pathway which leading the antitumor response impaired. The upregulation of PD-1 activation was found to occur in some cells at the tail of the mimetic trajectory (as shown in Figure 7B). One of the main effects on PD-1 upregulation is inhibition of T-cell activity.42,43 which directly regulates TCR signaling to attenuate T-cell activity and subsequently participates in tumor immunosuppression, and its inhibitors are now widely used in the clinic.44–46 Sorafenib was the first TKI to show efficacy in patients with advanced HCC and it was the first-line treatment for many patients with advanced HCC for a period of time. 47 Intra-arterial therapies, radiotherapy and metronomic capecitabine are alternative regimens for HCC patients who discontinued sorafenib for tumor progression or toxicity.48,49 However, these treatment regimens often had short durations of response or significant side effects, until the advent of immunotherapy changed the landscape of HCC treatment. With anti-cancer immunotherapy becoming established across all stages of HCC, combination strategies have been highly successful in the setting of advanced or relapsed HCC. 50 Stefanini et al believed that the combination of ICIs and TKIs may offer a promising new paradigm in the systemic treatment of advanced HCC, with the potential to improve overall survival and response rates. 51 In a previous report, S100A9 as a member of S100s has been investigated. Duan et al revealed that Silencing S100A9 expression partially blocked HBx-induced growth and metastasis of HepG2 cells both in vitro and in vivo in NF-κB dependent manner. 52 Thus, reducing S100s involvement in T-cell NF-κB activation by inhibitors and affecting the trajectory of T-cell differentiation, together with treatment of PD-1 inhibitors, may provide new ideas for tumor immunotherapy towards individualization.
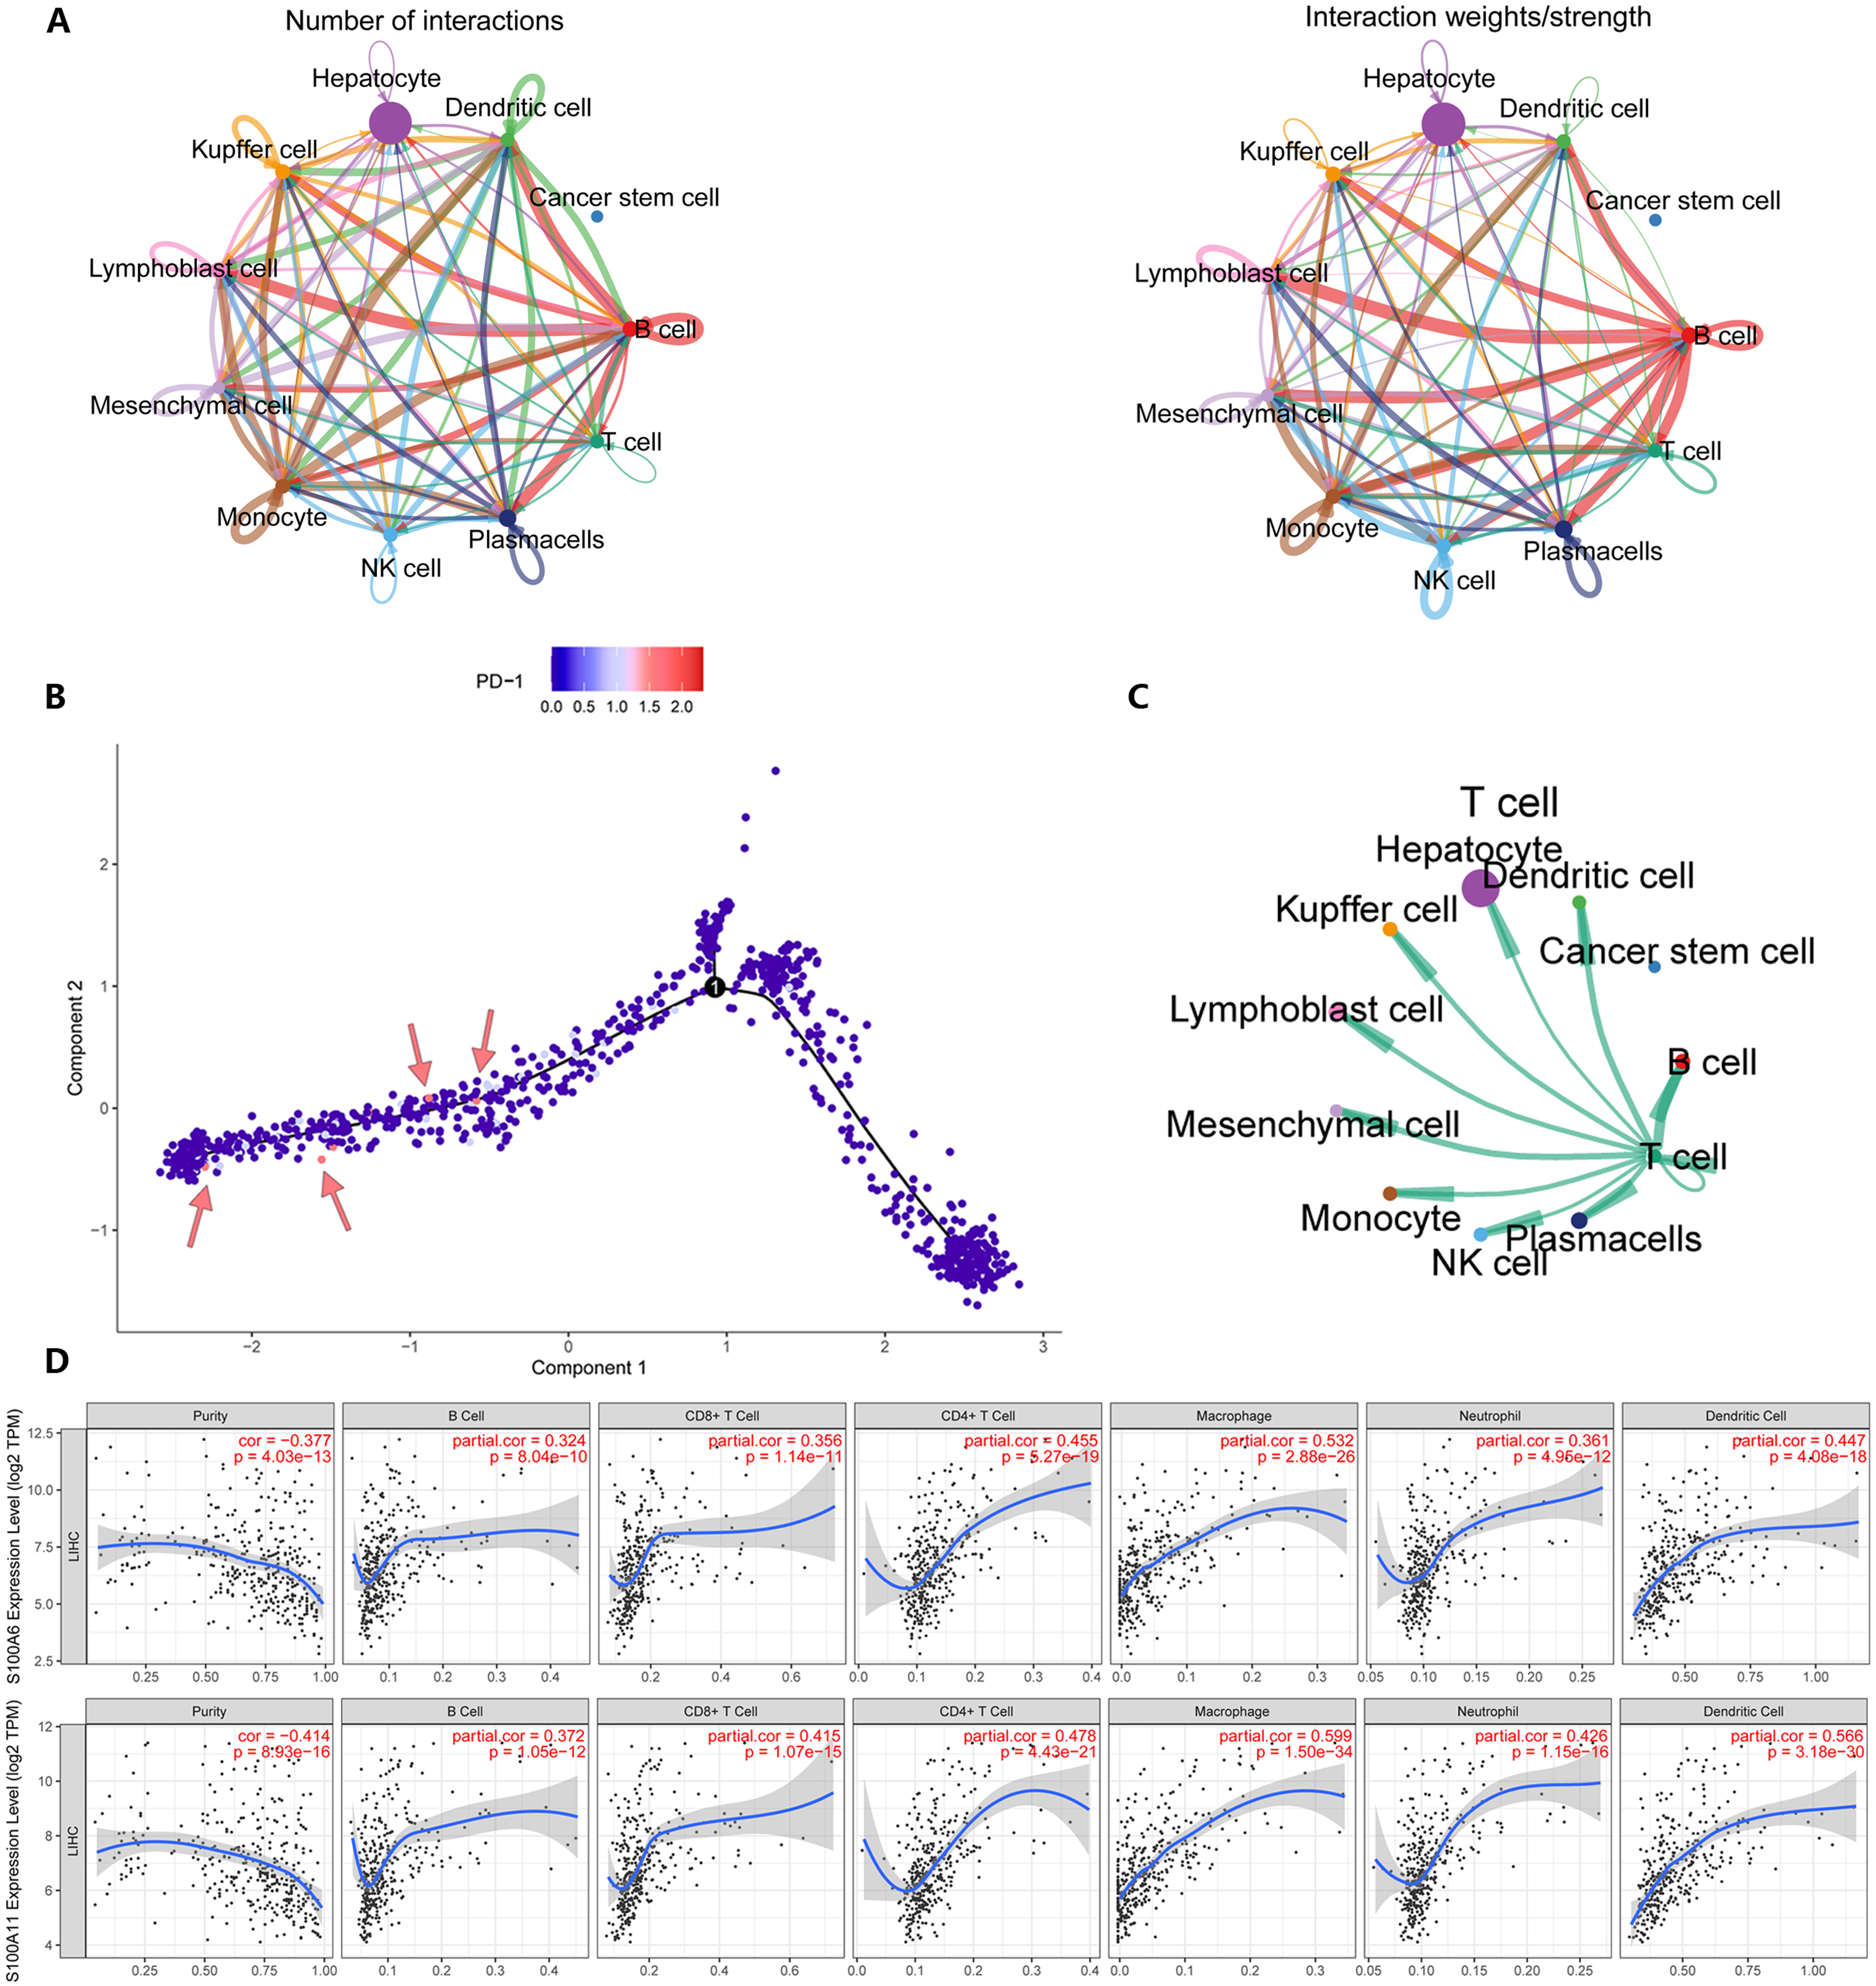
(A) Cell-to-cell communication inference using CellChat reveals that liver tumor cells are more closely related to B cells. (B) programed death receptor (PD-1) activation was observed in some cells in the late stage of Pseudotime. (C) Interactions between T cells and other cells. (D) Immune infiltration using TIMER pairs revealed that S100A6/S100A11 was positively correlated with the degree of tumor T-cell infiltration and negatively correlated with the purity of the tumor.
The present study has the limitation that S100s have not been studied in tumor parenchymal cells and the classification of different subtypes of T cells has not been explored. Furthermore, due to the high proportion of HBV-associated HCC cells in the T-cell subpopulation, it remains to be verified whether such a situation also occurs for non-HBV-infected T cells. Collectively, we have provided a valuable framework for studying HCC by using scRNA-seq to reveal the role of individual genes in tumors.
Conclusion
We investigated the role of S100s in the immune microenvironment by using scRNA-seq, and revealed that S100A6/S100A11 could be involved in regulating the differentiation and cellular activity of T-cell subpopulations in HCC, and its low expression was positively correlated with prognosis. Our research provides a new direction for immunotherapy of HCC and a theoretical basis for future clinical applications.
Supplemental Material
sj-jpg-1-tct-10.1177_15330338241252610 - Supplemental material for Involvement of S100A6/S100A11 in T-Cell Immune Regulatory in HCC Revealed by Single Cell RNA-seq
Supplemental material, sj-jpg-1-tct-10.1177_15330338241252610 for Involvement of S100A6/S100A11 in T-Cell Immune Regulatory in HCC Revealed by Single Cell RNA-seq by Rui Zhou, Bo Pei, Xinzhi Li and Xianlin Zhang in Technology in Cancer Research & Treatment
Footnotes
Abbreviations
Acknowledgments
Thanks to Cancer center, The Central Hospital of Enshi Tujia and Miao Autonomous Prefecture and Renhe Hospital Affiliated to Three Gorges University.
Declaration of Conflicting Interest
The authors declared no potential conflicts of interest with respect to the research, authorship, and/or publication of this article.
Ethical Statement
This study received approval from the Ethics Committee of Affiliated Renhe Hospital of China Three Gorges University (No.2022KY12).
Informed Consent
All patients provided written informed consent prior to enrollment in the study.
Ethics Statement
Ethics statement has been uploaded separately
Funding
The authors disclosed receipt of the following financial support for the research, authorship, and/or publication of this article: This work was supported by the Natural Science Foundation of Yichang Municipality, National Natural Science Foundation of China (grant number A23-1-057, No. 81871956).
Supplemental Material
Supplemental material for this article is available online.
References
Supplementary Material
Please find the following supplemental material available below.
For Open Access articles published under a Creative Commons License, all supplemental material carries the same license as the article it is associated with.
For non-Open Access articles published, all supplemental material carries a non-exclusive license, and permission requests for re-use of supplemental material or any part of supplemental material shall be sent directly to the copyright owner as specified in the copyright notice associated with the article.