
Abstract
Keywords
Introduction
Cervical cancer is a highly malignant tumor of the female genital system. It is the fourth most common malignancy in females globally. 1 The global incidence of cervical cancer is ∼500 000 cases annually. 2 Radiotherapy is a cornerstone of treatment in most stages of cervical cancer, and concurrent chemotherapy bestows an additional survival benefit. 3 In the process of designing a radiation treatment plan, a time-consuming, labor-intensive inverse optimization executed by an experienced dosimetrist in a trial-and-error manner is needed. The quality of the plan determines the efficacy of radiotherapy and even affects the safety of radiotherapy.
Currently, the research of artificial intelligence and deep learning (DL) has made astonishing progress, particularly in the field of computer vision and decision making. 4 In 2015, Ronneberger et al 5 proposed a DL convolutional neural network (CNN) architecture for semantic segmentation, known as U-Net, which was widely used in medical image segmentation and radiation dose prediction. Osman et al 6 proposed an attention-aware three-dimensional (3D) U-Net CNN for knowledge-based planning (KBP) 3D dose distribution prediction of head-and-neck (H&N) cancer based on the OpenKBP-Grand Challenge. 7 The proposed attention-gated 3D U-Net model showed high capability in accurately predicting 3D dose distributions that closely replicated the ground-truth dose distributions of 68 plans in the test set. Nguyen et al 8 researched the 3D radiotherapy dose prediction for 120 H&N patients based on the proposed U-Net variant (hierarchically densely connected U-Net, HD U-Net). As a U-Net variant, the new state-of-the-art model, U-Net transformers (UNETR), has acquired high dice coefficients in segmentation.9,10 UNETR utilizes a U-Net architecture and transformer as the encoder to extract important global information and has never been used in radiation dose prediction. The performance of these DL models for dose prediction strongly depends on the data set used for training. So it is difficult to compare the testing results of different models in different data pools. It is also necessary to make meaningful comparisons of these DL models using the same evaluation metrics in the same data sets.
Attention-gating mechanism highlights important anatomy features and suppresses redundant information propagation, and the advantage of the transformer-based networks is the self-attention mechanism and the capability of learning long-range dependencies, which could be compensated for the shortcomings of CNN. To our knowledge, there are no studies about the comparison of these diverse novel networks used for cervical cancer dose prediction. Which CNN is the optimal model, that can be used in cervical cancer radiotherapy is still unknown.
In this study, we aimed to use the same patients’ data sets and quantitative assessment metrics to evaluate the performance of various novel KBP 3D U-Net and its variants models for cervical cancer volumetric modulated arc therapy (VMAT) 3D dose predictions. The comprehensive comparative study facilitates the exploration of the performance of different models and provides a base for further innovations in algorithms.
Materials and Methods
Patient Materials
Data from 261 patients with cervical cancer in our center were collected as a retrospective study. Manual planning and treatment were performed for all patients with 2 coplanar VMAT full arcs with a photon energy of 6 MV beam. All the dose volumes were scaled to 95% of the PTV receiving 100% of the prescription dose with 50 Gy for 25 fractions. Data of 261 patients were randomly divided into 80%, and 20%, namely 209 patients for 5-fold cross-training-validation and 52 patients for testing.
All treatments were planned using the Varian Eclipse treatment planning system (TPS, version 13.6, Varian Oncology Systems, Palo Alto, CA, USA) with the Acuros External Beam Algorithm (AXB) and Trilogy linear accelerator (Varian Oncology Systems, Palo Alto, CA, USA). All these plans were designed by 3-year and 13-year experienced dosimetrists. The study protocol was approved by the Ethics Committee of the authors’ hospital (No. Ethics [M] 2024-015).
Dose Prediction Models
The network used was based on Pytorch 1.10.0 and Python 3.8. Figure 1 shows the dose prediction DL models for dose prediction, which consists of a down-sampling (encoding) path and an up-sampling (decoding) path. Four 3D U-Net-based variants architectures for KBP dose distribution predictions of cervical cancer were evaluated in our study. These architectures are, namely (A) 3D U-Net, (B) 3DAtten U-Net, (C) HD U-Net, and (D) UNETR.
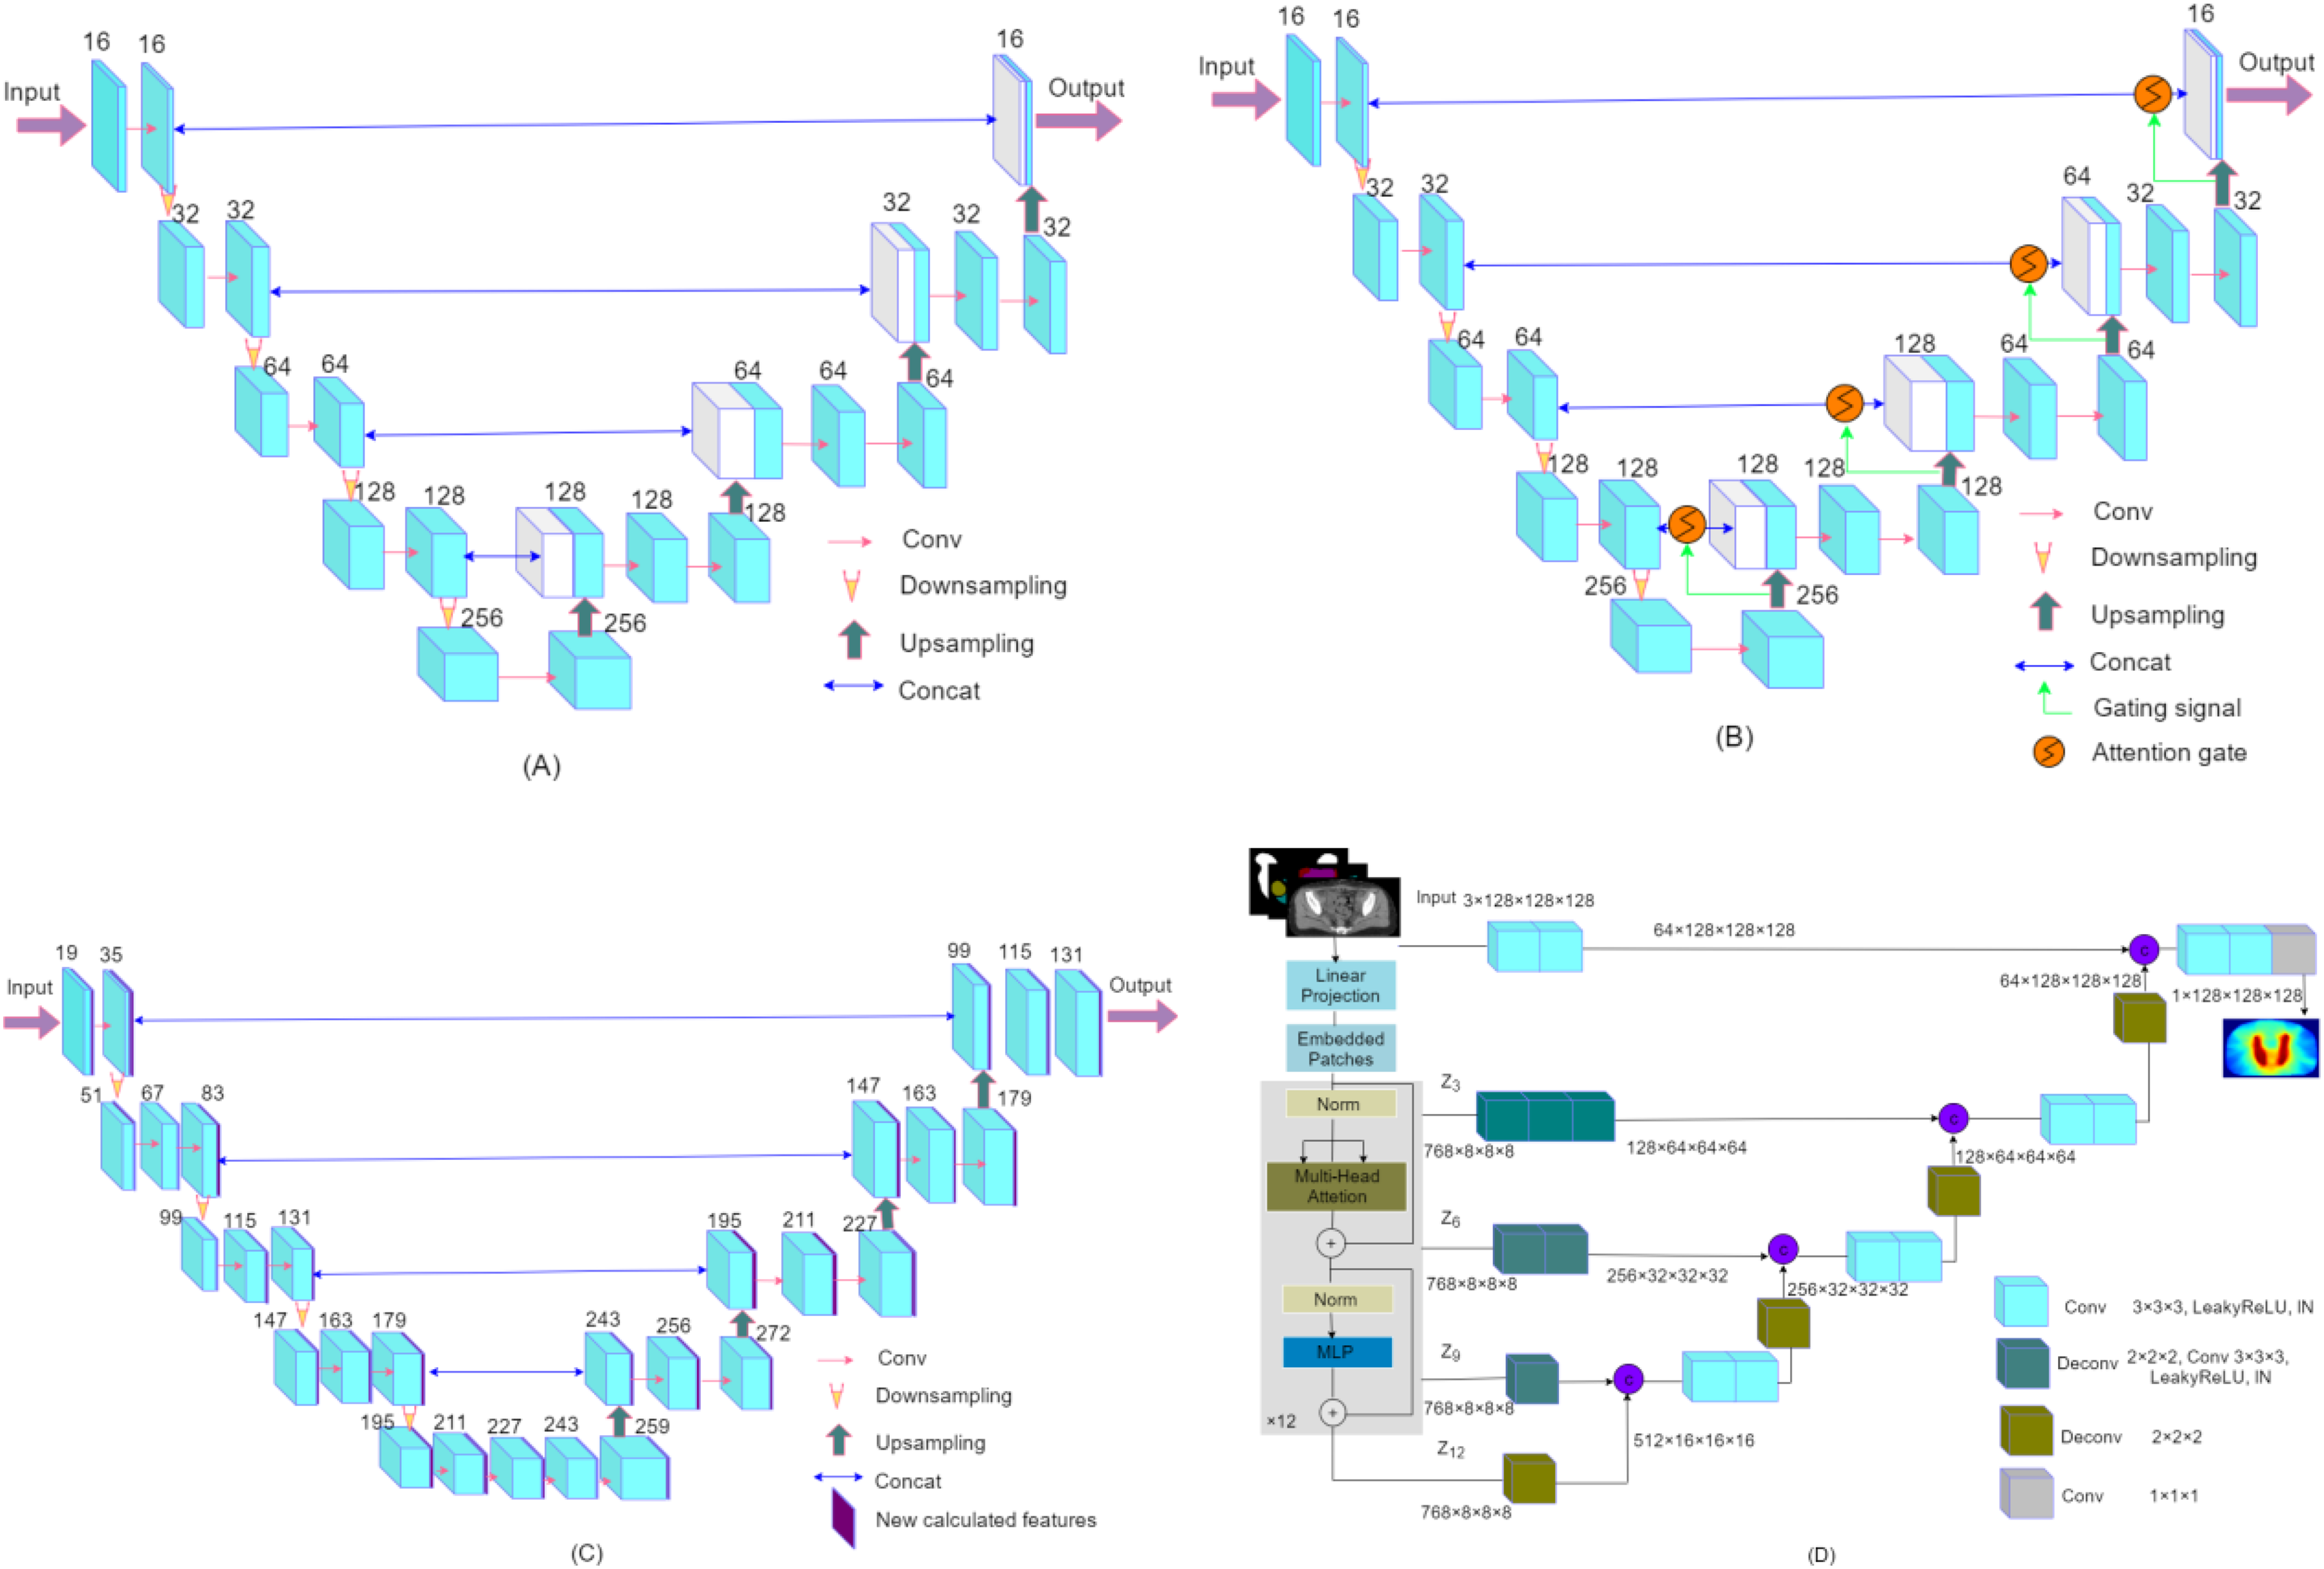
The 4 model architectures used in this study are (A) 3D U-Net, (B) 3DAtten U-Net, (C) HD U-Net, and (D) UNETR.
As shown in Figure 1(A), the 3D U-Net is made up of 5 multiscale-resolution hierarchical levels. The encoding part typically contains a convolutional block at each hierarchy level followed by a downsampling layer (3 × 3 × 3 kernel size; voxel stride = 2, and padding =1). The convolutional block is composed of one 3D convolutional layer (3 × 3 × 3 kernel size; voxel stride = 1, and padding = 1), and each convolutional operation is followed by an instance normalization (IN) and a rectified linear unit (ReLU) layer. In the decoding part, on the right side, each step consists of an upsampling of the feature map (transposed convolution), and two 3D convolutional layers, each convolutional operation is followed by an IN and a ReLU. The encoder output convolutional block is concatenated with the input in the decoder. The upsampling layer was operated in a reverse way.
The 3DAtten U-Net was designed based on the 3D U-Net mentioned above. The output at each hierarchy level in the encoder is concatenated to the corresponding one in the decoder through attention-gated connections. The attention-gating mechanism was utilized to enhance network concern to important regions in images, which is shown in Figure 1(B).
The HD U-Net utilizes 3 operations, dense convolve, dense encoder, and U-Net decoder. For each dense operation, a growth rate can be defined as the number of new features calculated during the convolution step. Specifically, we utilized a growth rate of 16 (16 new features added after each “dense” operation), 4 dense decoder operations, and 64 features returned during the encoder operation. The architecture is described in Figure 1(C).
The architecture of the UNETR is illustrated in Figure 1(D). The model utilizes a transformer as the encoder to learn sequence representations of the input and effectively capture the global multiscale information. The network design resembles U-Net for the encoder and decoder. The transformer encoder is directly connected to a decoder via skip connections at different resolutions to compute the final dose output.
In all these architectures, CT images, contoured PTV, and OAR masks were first fed into the DL models for training and verification. At last, a single-channel dose distribution tensor with a size of 1 × 128 × 128 × 128 dose file was produced.
Model 5-Fold Cross-Training-Validation
For all patients, 209 patients were trained with 5-fold cross-validation, and the remaining 52 patients were randomly used as testing sets. The loss function used in the optimization was a mean absolute error (MAE). Adam optimizer and cosine annealing scheduler were used (learning rate: 3 × 10⁻⁴ and weight decay: 10−4). The stopping criterion was 100 epochs. The batch size was set as 2. The networks were run on a workstation with an NVIDIA TITAN graphics card and 32 GB RAM. Once the model was well trained, the time for a dose-predicted map was produced in 1 s. The flowchart of the model’s training, validation, and testing is shown in Figure 2.

The flowchart of the model training, validation, and testing.
Quantitative Dose Prediction Evaluation
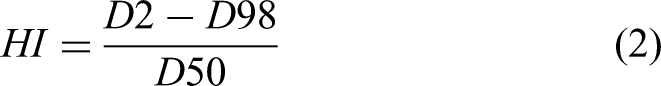
The performance of the 4 proposed models was evaluated based on dosimetric parameters, 3D dose distributions, and DVH parameters of OARs and PTV between the prediction and clinical truth (ground truth, GT). The predicted 3D dose distribution was evaluated by calculating the voxel-level MAE, which is defined as follows:


The dice similarity coefficients (DSCs) between the 3D isodose volumes of the predicted and clinical dose distribution images were defined in (5)

Results
Mean Absolute Error
We first quantified the MAE results of different structures in 4 models used in our study. The predicted 3D dose distribution was evaluated by calculating the voxel-level MAE, which is the dose error, averaged across all voxels of a structure (PTV, OARs, or entire body contour), and normalized to the prescription dose. The results of MAE on the testing set are listed in Table 1. The mean MAE of PTV and body contour are within 1.19%. The femoral head shows a relatively larger MAE than other OARs. The table shown in bold indicates the lowest predicted error.
The MAE of Different Structures in 5-Fold Cross-Validation (Mean ± Std).
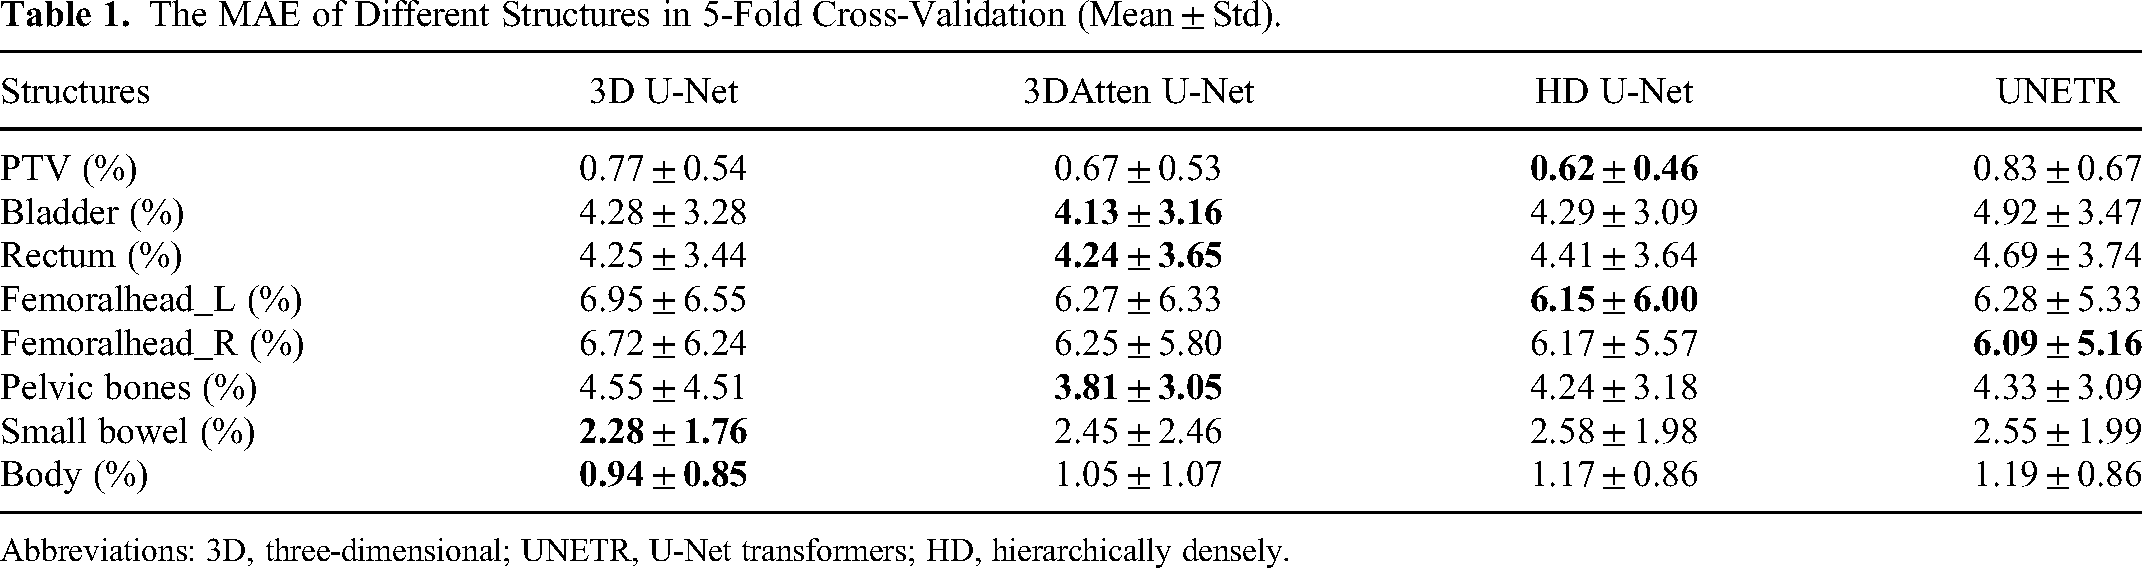
Abbreviations: 3D, three-dimensional; UNETR, U-Net transformers; HD, hierarchically densely.
Comparison of Dose Map
Figure 3 shows the dose map of the predicted dose distribution and clinical one, and their 3D spatial dose difference (GT–prediction) maps between the clinical and predicted dose distributions. It can be visually seen that 4 models generate results that are similar to the clinical dose. The prediction accuracy of the 40 to 50 Gy region is of high overlap, which may be due to the good consistency of the target and dose distribution in this region for different clinical plans. It is a remarkable fact that the dose difference between the clinical and predicted dose in the 4 models is minor.

Two examples of the GT and predicted dose maps (transaxial, coronal, and sagittal) with 4 models in the test set: (A) dose distribution map for an example; (B) dose difference for an example; (C) dose distribution map for additional examples, and (D) dose difference for additional examples.
Dosimetric Parameters and DVHs
The dosimetric parameters in the test set are shown in Table 2. Dmean is defined as the mean dose, D98 is defined as the minimum dose, and D2 is defined as the maximum dose. The dosimetric analysis for OARs included Vn, D2cc (2 cm3 receiving radiation n Gy). Details of other OAR results are listed in Table 2. The boxplot of dosimetric parameters differences |δD| (|GT−prediction|) of all structures within the body for the 52 testing patients is shown in Figure 4. The average error of the Dmean difference for different OARs is within 2.5 Gy. The average error of V40 difference for the bladder and rectum is about 5%.
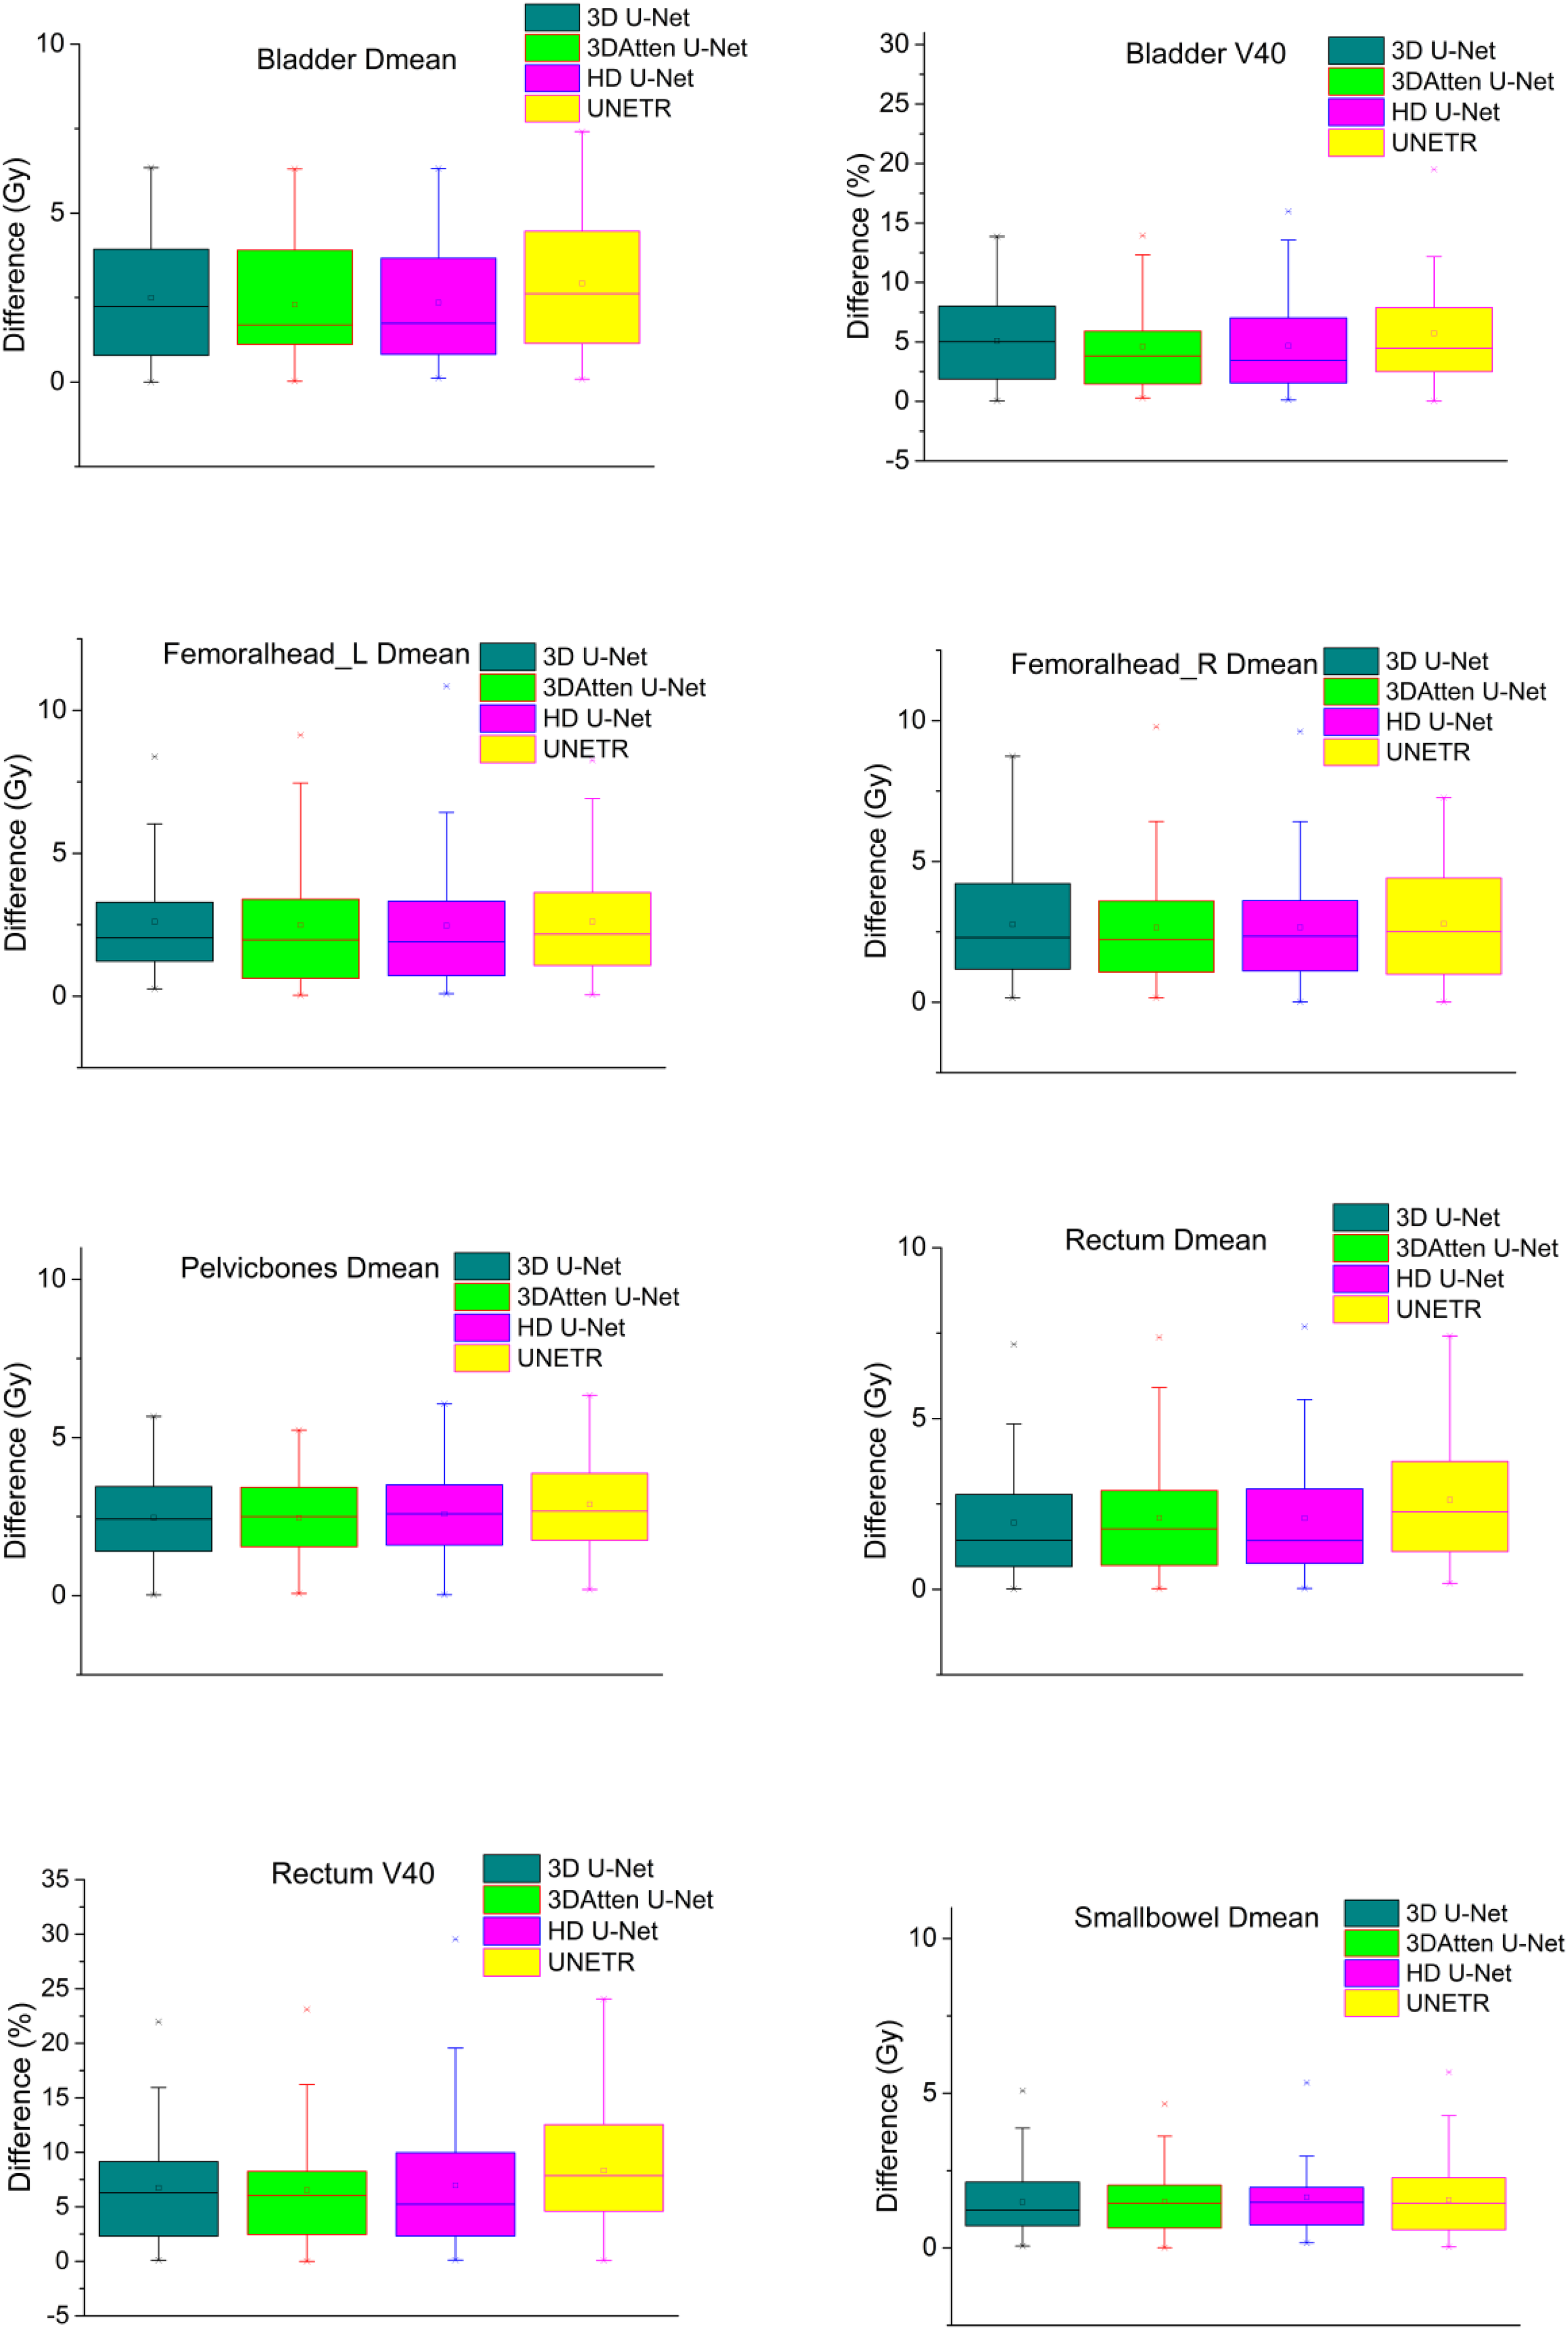
Dose difference boxplot for bladder, rectum, left and right femoral head, pelvic bone, and small bowel.
Dosimetric Parameters of GT and Predicted Dose for 52 Test Patients (Mean ± Std).

Abbreviations: 3D, three-dimensional; UNETR, U-Net transformers; HD, hyperdense; GT, ground truth; PTV, planning target volume.
Figure 5 shows the DVH parameters of OARs and PTV between the prediction and GT in a test example. Four models predicted an accurate dose curve to GT. Four DL models were able to predict the dose curves in this example.

DVH comparison between GT and predicted dose distribution.
We also compared the DSC results of the 52 testing sets for different models, which are illustrated in Figure 6. The 4 models exhibit similar DSC values, and the average value of DSC is above 90%.
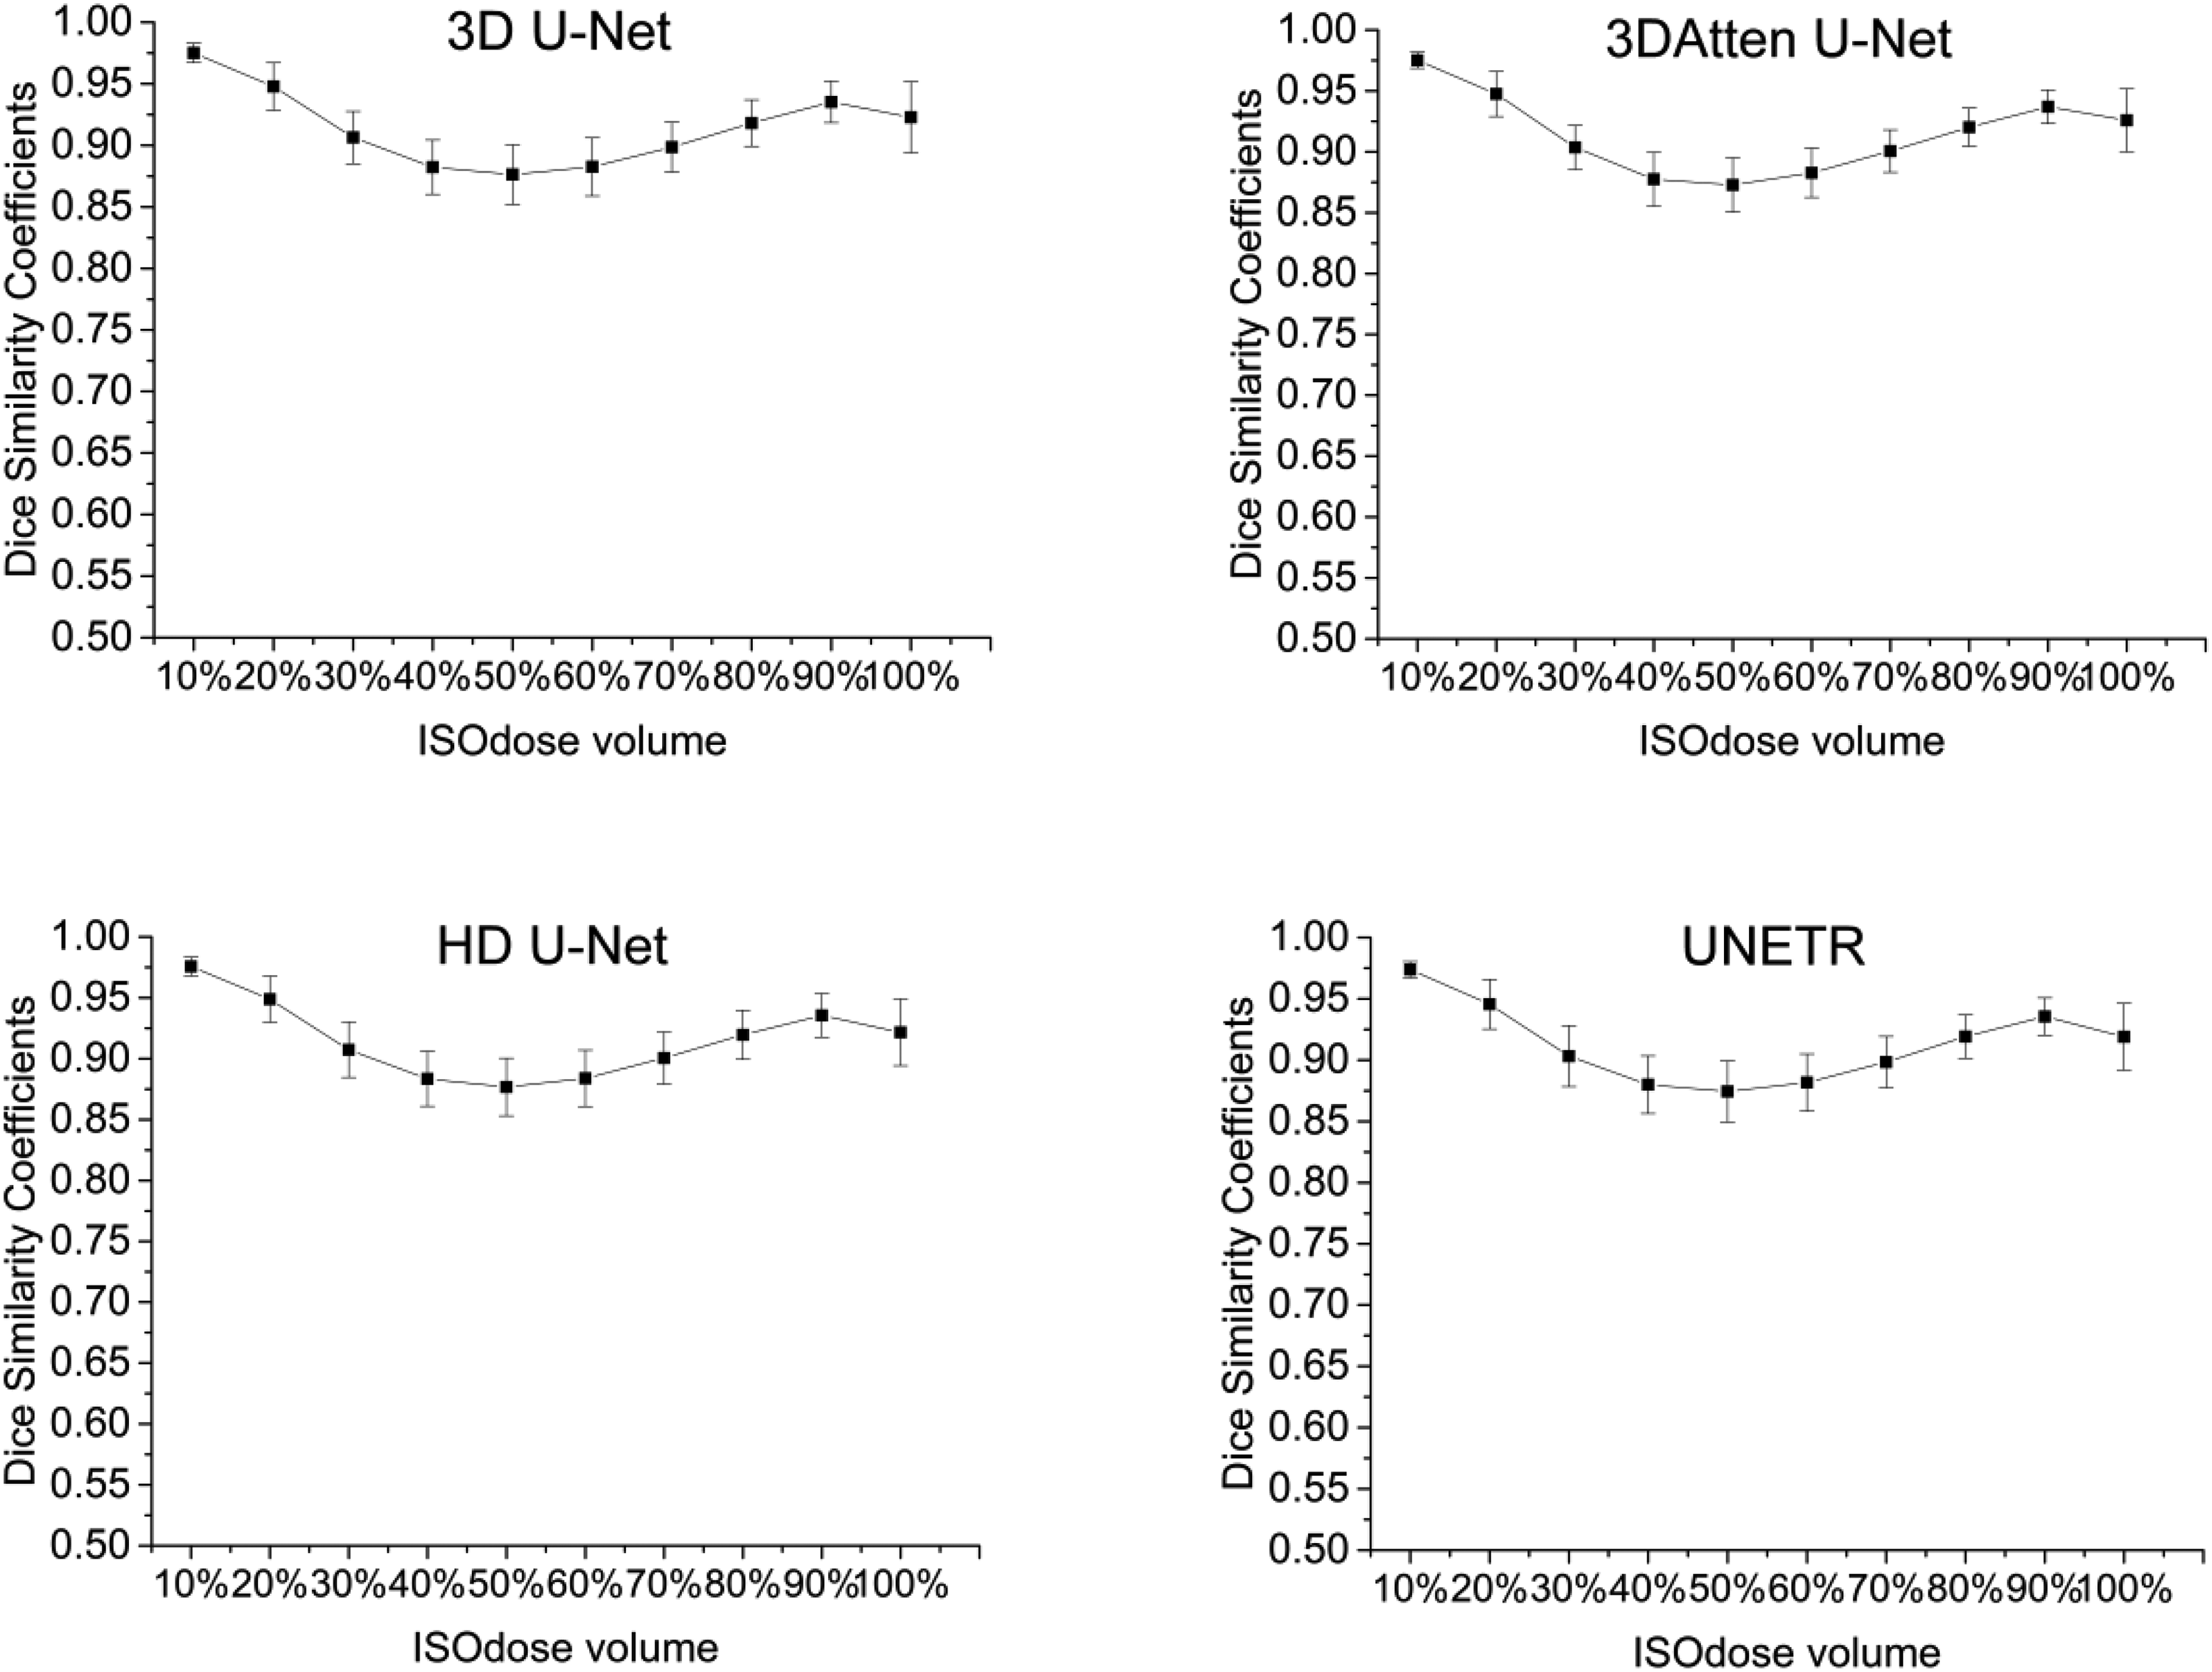
Dice similarity coefficients between ground truth (GT) and predicted isodose volumes for 52 test patients.
Discussion
This study aimed to compare the performance of 4 DL dose prediction models for cervical cancer on the same test set using the same evaluation criteria. It is challenging to make meaningful comparisons of the state-of-the-art DL models since previous studies were carried out using different patient databases and limited evaluation criteria.
In this study, the inputs of the model were binary PTV, OARs mask, and CT images, which are consistent with the majority of studies.12–14 The output was a spatial dose objective specifying 50 Gy per voxel, which eliminates the need to tune the complexity of inverse optimization. Although there were statistically significant differences in some dosimetric parameters, the predicted results are clinically acceptable. In our studies, the dosimetrists spend 40 min re-optimizing the dose distributions, but DL models take about one second to predict it. The dose distribution information-aid replan reduced the total planning time. The results were similar to Song et al's study. 15 Song et al predicted dose distribution for rectal cancer based on DeepLabv3+ and demonstrated that the DL model produced a clinically acceptable dose distribution with time savings. We expected no statistical differences in all predicted metrics. However, compared with clinical ground truth, not all dosimetric parameters were statistically different. This is consistent with the findings of many reports.16–20
The predicted dose map showed almost identical performance of the 4 models as they are almost similar to the clinical dose. The error in the PTV region is lower than that in the OARs, as seen in the dose difference map (Figure 3). In the OAR regions, due to the various dose constraint methods and trade-off balance principles by different dosimetrists, the dose distribution in the clinical plan was less consistent, which resulted in relatively lower OAR prediction accuracy. This phenomenon is common in most other reports6,16–19 that include dose prediction for cervical cancer.16–18 Due to the good consistency of the target and the relatively small span of dose values in this region. The various shapes and locations of OARs for different patients resulted in poor accuracy. Furthermore, the MAE results of PTV also confirmed the conclusion. The maximum MAE of PTV is only 0.83% ± 0.67%, but the maximum MAE among the OARs is the femoral head, which reached 6.95% ± 6.55%. More recently, the attention U-Net model based on the self-attention mechanism was widely used in semantic segmentation,21–23 as well as radiation dose prediction 6 and achieved high accuracy. Moreover, transformers, which have the advantage of a self-attention mechanism and the capability of learning long-range dependencies, 24 have made great progress in natural language processing. Transformers-based dose prediction models have been proposed in recent years.12,25,26 As a kind of typical transformers-based DL model, UNETR has never been used in dose prediction. 27 Research from Osman et al 28 showed that U-Net, attention U-Net, residual U-Net, and attention Res U-Net for H&N plans from OpenKBP-Grand Challenge data 7 had an almost comparable performance for voxel-wise dose prediction. Inspired by Osman et al's research, 28 we compared the 3D U-Net and its typical variants. Our results show that the 4 DL models have high capability in accurately predicting 3D dose distributions for cervical cancer VMAT plans.
The difference map between the predicted and clinical dose from a recent study on cervical cancer shows that the error range is from −10 to 10 Gy, 18 which is consistent with our results (Figure 3B to D). In Yu et al's 17 results, the maximum dose error of PTV was less than 1.64% ± 1.51% and 1.27% ± 1.67% for 3D U-Net and 3DRes U-Net, respectively, whereas our results showed the maximum mean error is 0.83%. Zhang et al 29 proposed a densely connected network to predict esophageal radiotherapy dose distribution. The MAE within the PTV, OARs, and body is 2.1%, 4.2% to 7%, and 3.4%, respectively. In Nguyen et al's 8 results for H&N dose prediction, the mean error for OARs is 5% to 10%. Although their esophageal or H&N results are not comparable to our results for cervical cancer, the values in our results still demonstrated the validity of the state-of-the-art model we studied. The mean absolute error results of the body for different groups in 7-fold cross-validation were from 0.9% to 2.3% in previous results of cervical cancer. 18 Our results are similar to the prediction accuracy of the above studies. The average error of the Dmean difference for different OARs is within 2.5 Gy. The average error of V40 difference for bladder and rectum is about 5%, which is similar to or better than previous studies. 18 Considering all voxels within the body, 3D U-Net showed the best performance or is at least one of the best. More complex models seem to have not yielded better results. This is mainly because the complex model is more likely to exhibit overfitting, which hinders the performance of DL. Furthermore, the average DSC of our results was above 90%, which indicates that the predicted values were close to the clinical actual values and the results (Figure 6) were similar to previous studies.16,18
There are several limitations in our study. The number of enrolled patients was not large enough, and it is single-center research, which lacks external validation. There is still room to further improve our dose prediction accuracy. The depth of the models cannot be increased due to the limited GPU capacity.
Conclusions
Four DL models that use 3D U-Net and its state-of-the-art variants were studied in this retrospective study on our institute's cervical cancer VMAT plans using various assessment metrics. The DL models proposed in this research all exhibited robustness and feasibility in the 3D VMAT dose prediction for cervical cancer. Considering all voxels within the body, 3D U-Net showed the best performance. Intelligent dose map distribution prediction of VMAT is of paramount importance for further clinical applications for cervical cancer plans.
Footnotes
Abbreviations
Acknowledgments
The authors thank Dr Shengxian Peng for his illuminating discussion.
Declaration of Conflicting Interests
The author(s) declared no potential conflicts of interest with respect to the research, authorship, and/or publication of this article.
Funding
The author(s) disclosed receipt of the following financial support for the research, authorship, and/or publication of this article: This work was supported by the General program of the National Natural Science Foundation of China (31971113); Chongqing Science and Technology Talent Project (CQYC201905037); and Chongqing key research and development program (CSTB2022TIAD-KPX0181).
Ethical Approval
The study protocol was approved by the Ethics Committee of Zigong First People's Hospital (No. Ethics [M] 2024-015). The requirement for patient consent was waived due to the retrospective nature of the study.