
Abstract
Keywords
Introduction
Breast cancer is one of the most common malignant tumors in women. The incidence of breast cancer is increasing year by year. 1 Radiotherapy has been playing an indispensable role in the management of breast cancer, and numerous clinical studies have shown that postoperative radiotherapy after breast-conserving surgery (BCS) can reduce the recurrence rate and improve the survival rate of patients. 2 However, it has been reported that the ionizing radiation from left breast radiotherapy is associated with the increasing incidence of heart disorders, especially coronary disease. Radiation-induced heart disease (RIHD) has become one of the major concerns related to nonneoplastic death in patients receiving left breast radiotherapy.1-5
Currently, three-dimensional conformal radiation therapy (3D CRT), intensity-modulated radiation therapy (IMRT), volumetric modulated arc therapy (VMAT), and Tomotherarpy are commonly used in the treatment planning of breast cancer radiotherapy.6-14 Comparative studies have shown that benefiting from the reverse optimization strategy IMRT and VMAT can achieve better dose distribution to the target and less dose exposure to the adjacent organs at risk than CRT. 12 Since the left breast is located in the vicinity of the heart, which makes the heart unavoidable to the radiation during the left breast radiotherapy. Studies have shown that for each 1 Gy increase in the average cardiac dose, the incidence of radiation-induced coronary artery-related events increases linearly by 7.4%without the apparent threshold. 5 Therefore, it is necessary to optimize the existing technologies or develop an advanced strategy to minimize the cardiac dose while maintaining the proper dose coverage in the target. Several techniques based on IMRT, VMAT, and tomotherapy have been developed with reported equivocal benefits in cardiac sparing.7-11
Based on the conventional VMAT model, we developed a novel two-stage optimization method, “Non-Uniform VMAT (NU-VMAT),” by removing unnecessary beams to reduce dose to OARs while maintaining sufficient dose coverage to targets. In this study, the performance of NU-VMAT was evaluated in comparison with conventional IMRT in terms of plan quality and delivery efficiency.
Materials and Methods
Non-Uniform VMAT Mathematic Model
All the sub-fields in a 360° arc are distributed uniformly in the conventional VMAT mathematical model, suggesting that radiation dose would exist in all sub-fields around the patient (Figure 1a). Current VMAT may over-modulate in certain directions since some sub-fields are insignificant for target dose and only contribute to extra dose to normal structure and increase whole-body low-dose radiation. Thus, the concept of NU-VMAT (Non-Uniform Volumetric Modulated Arc Therapy) is proposed and established in this study by eliminating insignificant segments while increasing the radiation intensity of the remaining significant fields. Unlike VMAT, the gantry rotation speed can be changeable appropriately by the NU-VMAT algorithm. Two clinical scenarios were taken into consideration in the NU-VMAT model to improve the intensity modulation and treatment quality. At the circumstance of low-speed gantry rotation matching fast MLC motion, multiple sub-fields radiations can be completed by the rapid MLC movement, or the modulation intensity can be increased by extending partial arc (Figure 1b, arrow ①). On the contrary, when high-speed gantry rotation matches static MLC, large-field radiation can be completed while creating multiple beam-off fields simultaneously (Figure 1b, arrow②).

Mathematical model of Homogeneous VMAT (a) and IGM based NU-VMAT (b). (The arc was evenly divided into numerous sub-fields [x0, x1 …] to obtain the fluence map. Adjacent sub-fields could be combined to reduce the total number of sub-fields [arrow ①] and to ensure the quality of optimization accuracy. After merging, some areas had no radiation distribution, forming “beam-off fields” [arrow ②] to reduce unnecessary radiation); IGM curve which had the complexity degree of MLC movements related to the VMAT modulation intensity in different gantry angles had peak and valley areas (b)).
Non-Uniform VMAT Algorithm
The complexity degree of MLC movements related to the VMAT modulation intensity in the different gantry angles, and can be optimized to improve the treatment quality.
13
Considering that the neighboring segments contribute unequally to the central segment, the affecting factor of the neighboring segment should decrease as the angle increases. We use a Gaussian function to simulate this decreasing effect. A Gantry MLC Movement coefficient Index, IGM, was defined to describe the VMAT modulation intensity
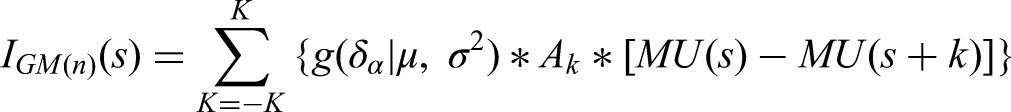

Since the IGM value varies as the beam's MU changes, we normalize the IGM value to get a relative percentage (%) of IGM value and this normalized IGM value is not affected by the beam MU. Hence, it is used to be a proper evaluation index to quantitatively describe the beam modulation index at each angle spot (Figure 1). For the evaluation of high and low modulation intensity, high modulation intensity (peak in the curve) is defined as IGM value larger than 150% of the average IGM (Figure 1, left, arrow①), while low modulation intensity (valley in the curve) is defined as the IGM value less than50% of the average IGM (Figure 2, left, arrow ②). High and low modulation intensity areas can be distinguished by comparing IGM value in the gantry range of 30° centers on the peak/valley (Avgpeak/valley) and average IGM for all the angles (Avg360°).
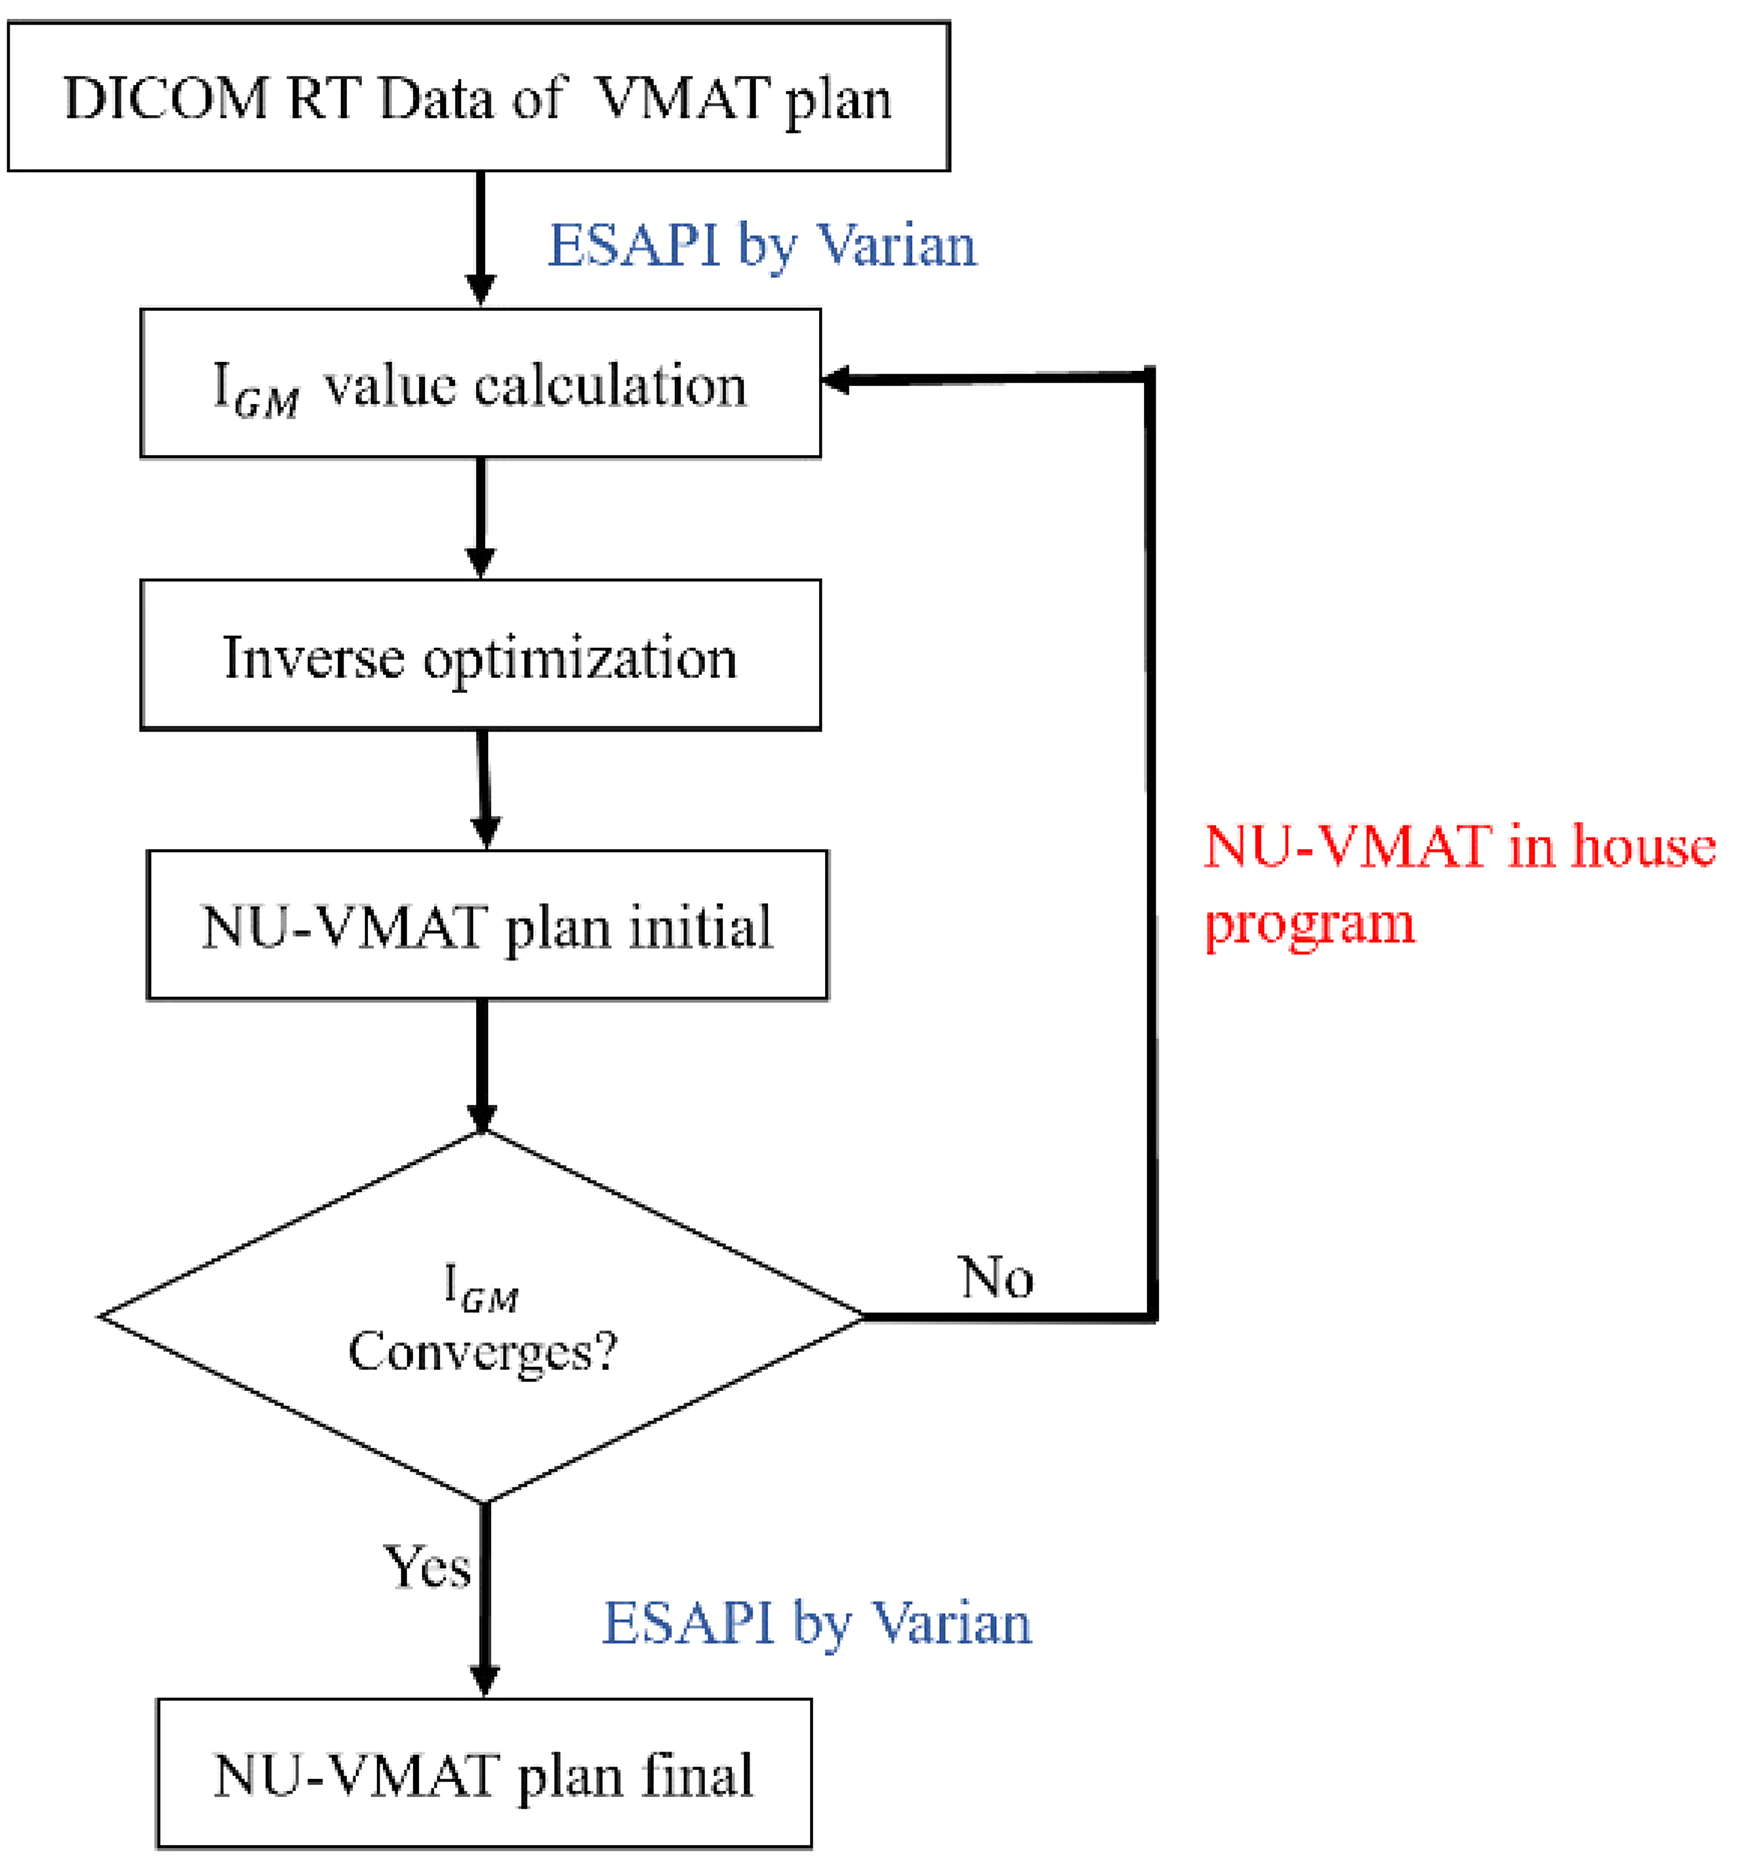
NU-VMAT technology flowchart (The optimization iteration had 2 stages: first, the conventional VMAT plan was optimized in Eclipse® according to dose constraints as usual; then the optimized plan data was exported and the arc range was optimized outside Eclipse by our in-house developed code, optimized arc range was then imported back to Eclipse® to start a new optimization iteration until we got out NU-VMAT plan automatically, which met all clinical requirements and the IGM curve converged obviously. The ESAPI by Varian was the communication interface between Eclipse and our independent program).
NU-VMAT Technology Flowchart
All the research data including DICOM images and DICOM RT files of selected patients were retrieved from the clinic database in Eclipse® 15.5 treatment planning system (Varian Medical System). The NU-VMAT program written in Python 3.7 is capable of inputting and outputting DICOM images and DICOM RT files via ESAPI software interface (which was embedded in Eclipse®, licensed by Varian Medical System) automatically. The work flowchart is shown in Figure 2.
Patient Data
Fourteen left-sided breast cancer patients treated with BCS and adjuvant whole-breast radiotherapy in the period of November 2019 through June 2020 were randomly selected for this treatment planning study. The average patient age at treatment was 47 (range from 38 to 56). In addition, enrolled patients should meet the following inclusion criteria: (a) pathological confirmation of breast cancer; (b) only left-sided breast cancer without contralateral tumor (ie, right-sided cancer); (c) the size of the primary tumor should be < 5 cm; (d) negative axillaries or neck lymph nodes; (e) lack of distant metastasis.
CT Simulation and Contouring
All patients were scanned in a large aperture CT simulator (SOMATOM Definition AS®, Siemens, Germany) in the supine position with upper arm abduction using the immobilization device (Q-fix® breast bracket). The simulation CT images were acquired at a slice thickness of 3 mm covering a range from above the mandible to several centimeters below the inframammary fold, including the entire chest. The attending radiation oncologist with expertise in breast cancer delineated the excision cavity represented by the architectural tissue distortion and surgical clips. The clinical target volume (CTV) included the glandular tissues of the ipsilateral breast but excluded the pectoralis major or the ribs. The PTV was generated by an extension of 10 mm of CTV but restricted to 5 mm below the skin and anterior to the lung-chest wall interface. The normal structures and OARs, including skin, contralateral breast, thyroid, lungs, and heart were contoured by dosimetry staff and confirmed by the attending radiation oncologist. For skin evaluation, the skin volume was defined as a 3-mm bandwidth from the surface of the breast inwards. The skin dose was defined as the mean maximum dose received by 1% of the skin volume.
3D Treatment Planning Designing
All the treatment plans were designed in Varian Eclipse® system (version 15.5) using an anisotropic analytical dose calculation algorithm (AAA) with a grid of 2.5 mm3 and the same constraints were used in the inverse optimization. The prescription dose was 50 Gy in 25 fractions with 100% prescription dose covering 90% PTV. Subsequently, treatment plans were simulated in VitalbeamTM Linear Accelerator, with an energy of 6 MV and a dose rate of 600 MU/min. Sliding window techniques with heterogeneity corrections (the minimum field size > 4 cm2) were used.
To protect the OARs, including heart, ipsilateral lung, contralateral lung, and breast, a dynamic sliding window with a fixed gantry angle was used in IMRT technology. Six opposed tangential fields were set with slight adjustment according to anatomical position (Figure 3a). 14 Since these patients have completed their IMRT treatment, the previous IMRT plans were used for comparison directly.

Representative irradiation field distribution from plans designed with indicated technique. (a) IMRT with 6 tangential fields; (b) VMAT with 2 uniform tangential arcs; (c) NU-VMAT with 2 non-uniform tangential arcs.
Two tangential arcs were used manually in the VMAT plan according to the tumor position and the normal tissue location (Figure 3b). These 2 tangential arcs should cut fewer lung tissue, with each arc in the range of 30° to 35°.
Based on the previous VMAT plans, NU-VMAT plans were generated automatically through an IGM curve analysis process. In this process, those segments with both lower IGM values and larger cardiac exposure areas in the MLC aperture were removed from the arc intelligently. Since these removed segments had a negligible contribution to the target, the target DVH remained the same while the cardiac DVH improved evidently (Figure 3).
These cases were optimized equally by the same constraints, using conventional IMRT, VMAT, and NU-VMAT technology to analyze the dosimetric differences between these 3 techniques in Eclipse®15. 5 treatment planning system.
Dosimetric Evaluation and Treatment Efficiency Parameters
For all treatment plans, dosimetric parameters calculated for the OARs and PTV were listed in Table 1. D1% was the maximum dose received by 1% of the evaluated OARs volume or PTV selected to avoid point dose influence. D99% was the minimum dose received by 99% of the evaluated OARs volume or the PTV volume (recommended by the latest International Commission on Radiation Units and Measurements Standards.
15
. For the ipsilateral breast, the V5, V10, and V20 described the percentage of breast volumes receiving 5%, 10%, and 20% of the prescribed dose, respectively. The conformity index (CI)is included to reflect the lower isodose line distribution, which was defined as
Primary Planning Objectives for the Critical Structures and Target Volumes.

DVH analysis for the normal structures such as the heart, ipsilateral lung, and skin was performed to assess dosimetric characteristics in all the plans. The constraints and acceptance of normal tissues were listed in Table 1. Most parameters are in accordance with the Radiation Therapy Oncology Group (RTOG) 1304 trial. For treatment efficiency assessment, treatment time (beam-on time plus gantry rotation time) and monitor units were recorded and compared.
Quality Assurance
All plans were validated with standard quality assurance (QA) procedures, including absolute doses and plane dose measurement verification. The point doses were measured with an ion chamber (d = 0.6 cm, TW30013; PTW Dosimetry, Freiburg, Germany) using a solid water phantom. The dose distributions on the 2D plane were assessed using Portal Dosimetry device (Varian Medical System). At least 95% of the pixels should pass the gamma criterion of 3%/3 mm diagnostic test accuracy with a 5% threshold used for NU-VMAT plane dose QA in our institution. 17
Statistical Analysis
The statistical significance of the difference between the groups was assessed using Wilcoxon signed-rank test by SPSS software, release 13.0, and the statistical significance was P < .05.
Results
IGM Optimization for VMAT and NU-VMAT
With the iterative optimization using the NU-VMAT model, the IGM-NUVMAT converged significantly in comparison with IGM-VMAT (P < .05, Figure 4). The average IGM-VMAT curve of all cases ranged from 0% to 297% and IGM-NU-VMAT from 50% to 147%. The optimized tangential arcs in NU-VMAT treatment plans distributed in the range of 120° to 140° and 285° to 335°, slightly different from the original VMAT plans (110°-150° and 285°-335°).

IGM curve of the VMAT (in blue) and NU-VMAT (in red) for 14 breast cancer cases (the blue and red thick solid line represent the average curve of all VMAT cases and NU-VMAT cases, respectively).
PTV Dose Evaluation
The average PTV volume was 694.51 ± 51.98 cm3 and the average PTV D1%, Dmean, and D99% from 3 techniques are shown in Table 2 and Figure 5. There was no significant difference among the VMAT, IMRT, and NU-VMAT techniques in terms of PTV parameters, except Dmean between the VMAT plan and NU-VMAT plan (P = .025). The CI values of NU-VMAT (CI = 1.21) were slightly lower than IMRT (CI = 1.22) and VMAT (CI = 1.24), indicating the favorable performance in conformity and homogeneity of PTV coverage (Table 2, Figures 5 and 6).
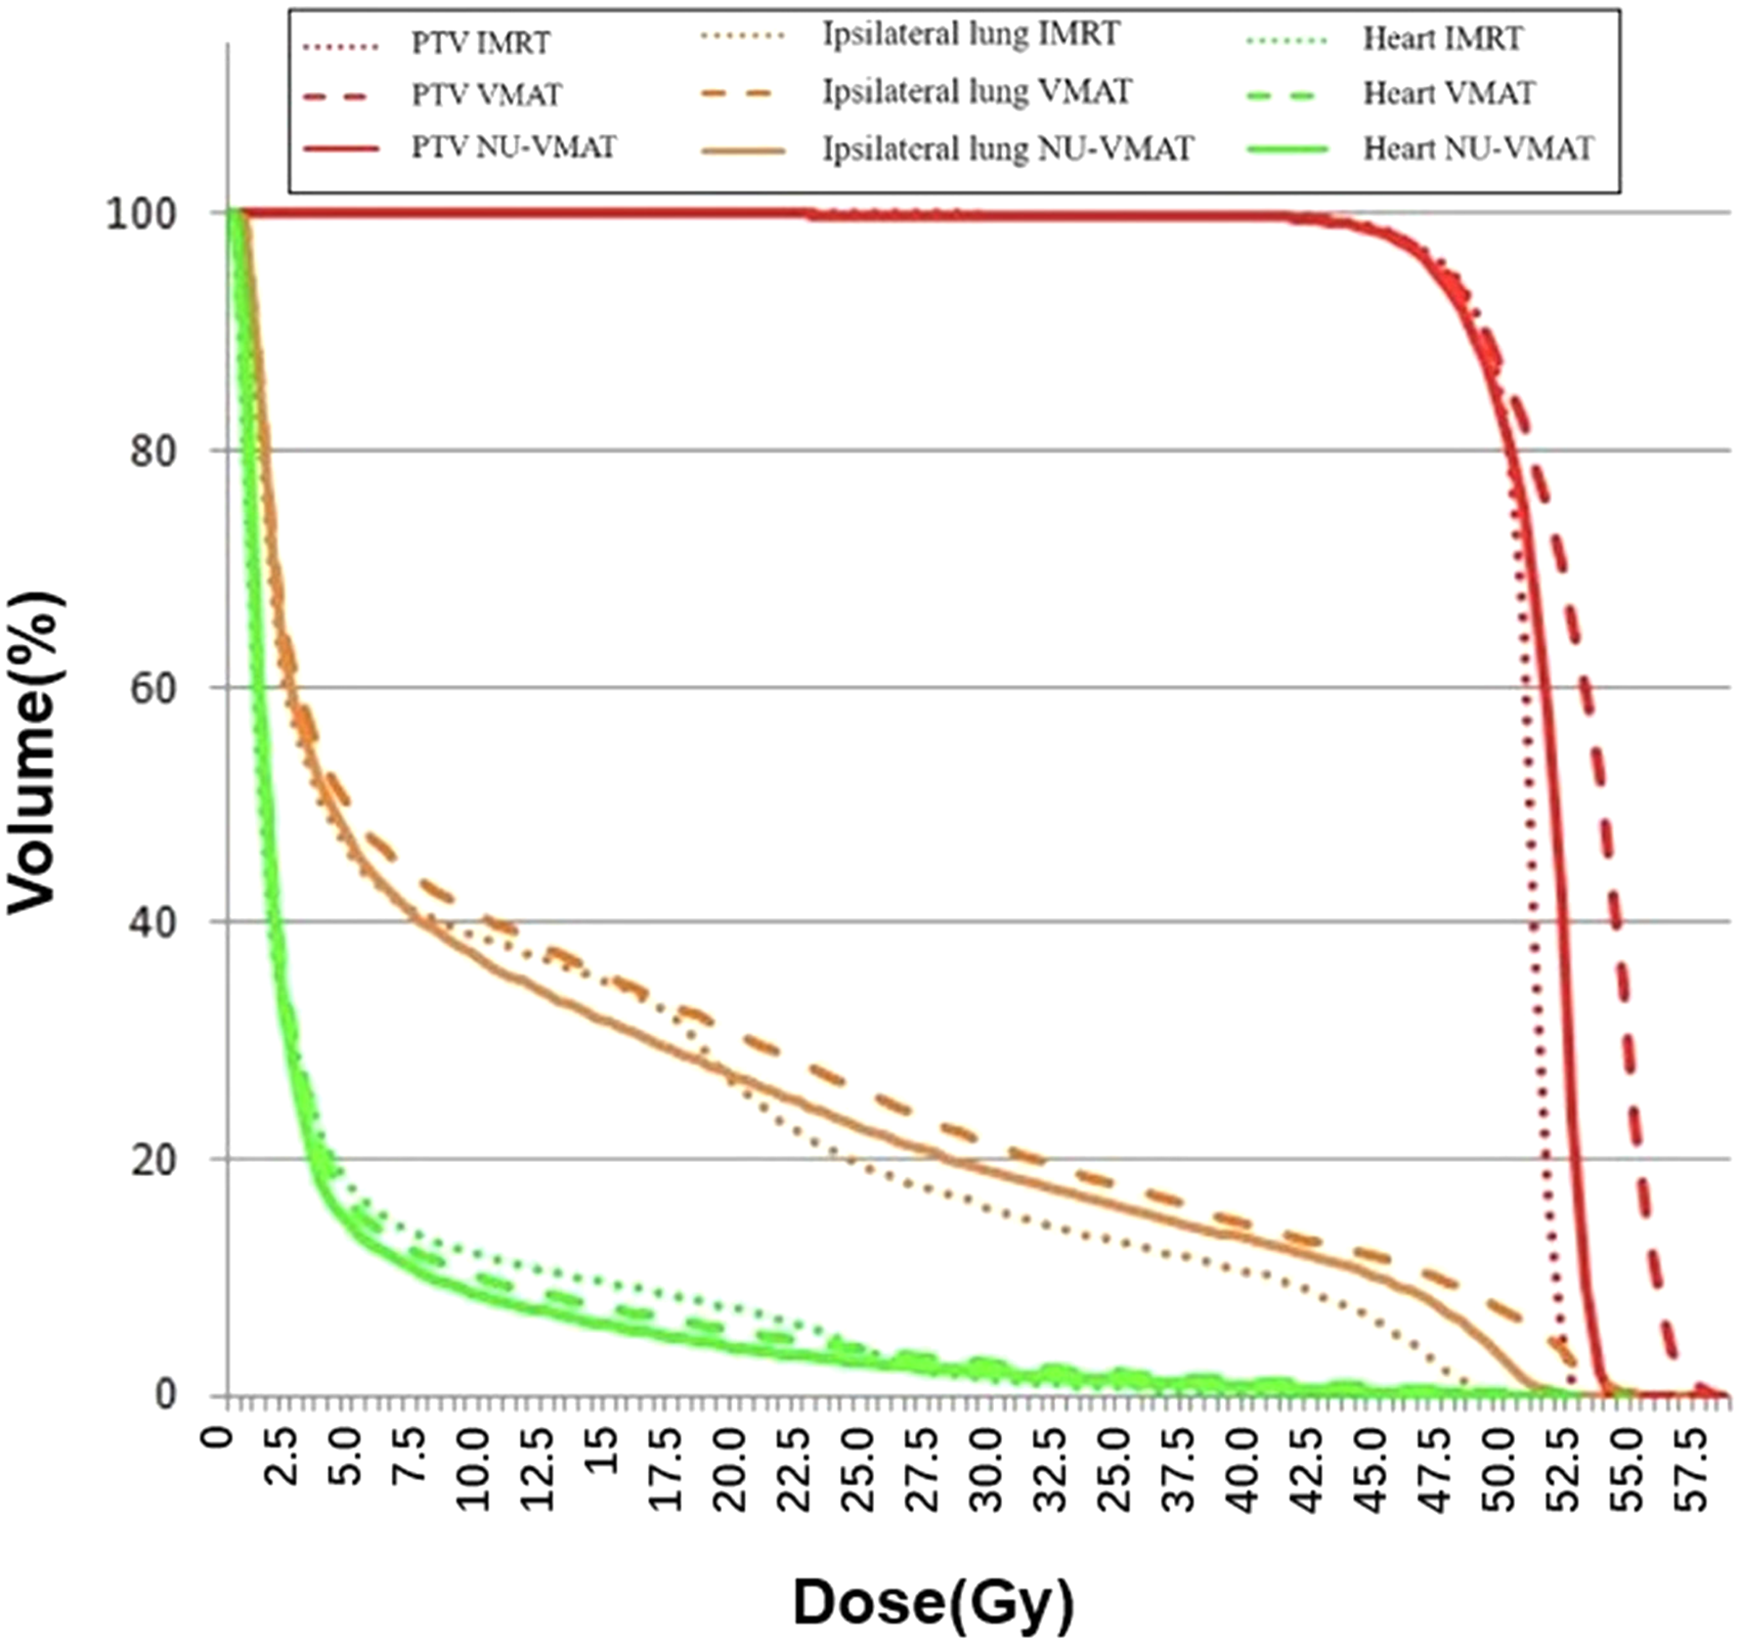
Comparison of the DVH of one case under the 3 techniques: VMAT (dashed thick line), NU-VMAT (solid line), and IMRT (dashed thin line).

Dose color wash map of 3 techniques: (the red circles represent different dose distributions in the 3 treatment plans).
The Dosimetric and Efficiency Parameters Comparison Among IMRT, VMAT, and NU-VMAT Plans.

Abbreviations: IMRT, intensity-modulated radiation therapy; NU-VMAT, Non-Uniform Volumetric Modulated Arc Therapy; VMAT, Volumetric Modulated Arc Therapy; MU, monitor unit; CI, Conformityindex; PTV, planning target volume.
*The significant difference existed (P < .05). SD: standard deviation.
OAR Dose Evaluation
The estimated dosimetric parameters in all plans met the criteria specified in the RTOG protocol. Significant differences were seen in the dose received by 30% volume of the heart (D30), with a decrease of 42.28% and 54.79%in NU-VMAT over IMRT and VMAT, respectively. Besides, the NU-VMAT technique resulted in a relatively low Dmean in the heart when compared with the VMAT (P = .982) and IMRT (P = .475) technique. It was evident that the NU-VMAT had better performance in OAR sparing than conventional VMAT and IMRT, except slight but insignificant dose increase in the left lung in comparison with the IMRT plans (Figures 5 and 6).
Treatment Efficiency
Statistically significant differences were found in the delivery time and machine monitor unit when comparing IMRT with VMAT and NU-VMAT (P < .05). MU and the delivery time decreased by 69.8% and 28.4%in NU-VMAT over IMRT (P < .05), respectively.
Dose Verification: QA of NU-VMAT
In the NU-VMAT plans, the average absolute dose difference for point dose measurement was 2.4% ± 0.19 (range from 2.2% to 2.7%). For plane dose verification, under the criterion of 3%/3 mm with a 5% threshold and 90% pass rate in the gamma analysis, the average pass rate was 96.5% ± 1.11 (range from 95.3% to 98.1%). And the results indicated that minimal pass rates of DTA > 97% were observed in the IMRT and V-MAT plans, respectively. And the average absolute dose difference for point dose measurement was < 3% in the IMRT and VMAT plans, respectively.
Discussion
In this study, we developed non-uniform VMAT to optimize the treatment of left breast cancer radiotherapy and assessed its effectiveness and feasibility using clinical patient data.
Radiotherapy Technology Optimization and Renovation
IMRT and VMAT are the current mainstay treatment planning techniques in radiotherapy. Many scholars conducted researches related to IMRT and VMAT treatment optimization and successfully verified their reliability.13,18-23 Craft et al 18 designed a VMERGE algorithm to make the VMAT planning faster and to explore the tradeoffs between planning objectives and delivery efficiency. Li and Xing 13 proposed a segmentally boosted VMAT technique in which achieved better OAR sparing and better target coverage. Mullins et al 20 tested a noncoplanar “baseball stitch” trajectory which shortened the SAD to optimized VMAT plans. Long et al 21 improved upon conventional leaf sequencing to incorporate continuous leaf positions explicitly into the treatment planning model. Lyu et al 22 developed a novel integrated optimization method for VMAT which decreased the limitation imposed by the square beamlet from the MLC leaf thickness and achieved higher modulation resolution. Papp and Unkelbach 23 also proposed a novel optimization model for VMAT planning that directly optimized leaf trajectory in the treatment plan. To quantitatively analyze the VMAT modulation intensity in this study, the IGM is introduced based on Xing's modulation index function. In the NU-VMAT model, the relationship between the gantry angle and contribution of neighboring segments to central segments was taken into consideration to better optimize the algorithm.
It is inevitable to radiate the heart during left breast cancer radiotherapy treatment due to the anatomical position of the heart and left breast.24-26 Cardiac toxicity was considered to be the most serious radiation-related complication in breast radiotherapy. According to the study from Mege et al, an increment of 1 Gy to the mean heart dose could increase the risk of coronary artery disease by 7.4%. 5 Karpf et al 10 used tangential-IMRT and tangential-VMAT to optimize the left breast irradiation plans, IMRT decreased the Dmean of heart with the reduction of 26.6% compared with VMAT. Wang et al 11 reported that IMRT based KBP optimization decreased heart Dmean by 1.3% to 2.2% in comparison with VMAT. Using control points optimization, NU-VMAT achieved better dose control and lower mean dose in the heart (5.38 ± 0.46 Gy) when compared with the VMAT (7.95 ± 0.52 Gy, P = .982), resulting in a 32.2% reduction over VMAT and 4.4% reduction over IMRT (5.63 ± 0.61 Gy, P = .475).
MU and Delivery Efficiency
NU-VMAT model was designed based on the VMAT technique by eliminating negligible segments of the fields while increasing the weights of significant segments. Hence, the NU-VMAT model keeps the advantages of VMAT while adding some other benefits including better delivery efficiency and machine output. The reduction in total MUs has the dual benefits of reduced treatment time and less total body scatter dose. 19 In our study, NU-VMAT substantially decreases the machine monitor unit to nearly 69.8% of IMRT. Moreover, the delivery time of NU-VMAT declined by 28.4% comparing to IMRT. Reduced treatment time and improved efficiency certainly favor the control of patients’ movement and compliance during radiotherapy.
Conclusion
This study successfully established a new technique (NU-VMAT) for radiotherapy planning which could improve the quality of treatment plan and the efficiency of radiation therapy, and offer better protection for the normal tissue. The preliminary results showed that this NU-VMAT had a dosimetric advantage in cardiac dose control and efficiency advantage in treatment delivery by reducing MU and delivery time in comparison with the conventional VMAT, which warrants further investigation and validation in more patients and multiple cancer centers.
Footnotes
Acknowledgments
The abstract has been accepted as an e-poster presentation at the 2020 AAPM/COMP Annual Meeting; This work was partially supported by the National Natural Science Foundation of China, Grant No.11505029, Natural Science Foundation of China (grant no. 81472794), Shanghai Municipal Commission of Health (grant nos. 2018BR23 and 20184Y0099), and Shanghai Municipal Commission of Science and Technology (grant no. 18441904400).
Ethical Approval
We have re-provided the ethical approval after review, the date is 2020/06/09. Please contact me if you have further questions. Thank you. I appreciate your time and patience in this matter.
Declaration of Conflicting Interests
The authors declared no potential conflicts of interest with respect to the research, authorship, and/or publication of this article.
Funding
The authors received no financial support for the research, authorship and/or publication of this article.