
Abstract
Introduction
Colon cancer is a common gastrointestinal tumor with high morbidity and mortality rates in China and is currently the main cause of cancer-related deaths. Colorectal adenocarcinoma (COAD) ranks third in the latest worldwide cancer statistics. 1 The main clinical features of COAD are changes in defecation shape, bloody stools, and emasculation. 2 The intestinal function is eventually completely disordered with the occurrence and development of tumors. Currently, the standard treatment for COAD is limited to the use of cytotoxic drugs, surgical resection, radiation, chemotherapy, and associated immunotherapy. 3 However, these treatments only achieve moderate efficacy and do not completely improve the prognosis of patients, particularly of patients with advanced COAD. Therefore, it is crucial to identify novel biomarkers and prognostic models for improving COAD treatment.
The endoplasmic reticulum (ER) plays an important role in protein folding. Abnormal protein folding directly induces the expression of ER stress genes. 4 Activation of ER stress has been extensively studied, particularly in breast cancer, 5 lung cancer,6,7 liver cancer, 8 and other tumors. Studies have shown that activating transcription factor 6 (ATF6), one of the 3 major ER stress transducers, could promote chemoresistance of patients with COAD from the TCGA cohorts with up-regulating CIP2A expression, which might be targeted regulating the survival rate of cancer cells. 9 Additionally, some researchers believe that ER stress plays a pro-apoptotic role in COAD. 10
Further, Yang et al 11 first reported the biological significance and prognostic role of ER stress-related genes (ERSGs) (which were obtained from the GSEA website) from the perspective of bioinformatics via GSE40967 and TCGA-COAD and investigated WFS1 expression in COAD tissues as well as the inhibitory effect of WFS1 knockdown in HCT116 and DLD-1 cells. On the other hand, the ER stress-related lncRNA signature was explored based on various bioinformatics methods, revealing that the differential genes in the high-risk group might be associated with extracellular matrix pathways. 12 These findings initially help us to explore the potential complex mechanisms of ERSGs in COAD.
Inspired by previous literature relevant to COAD,13,14 we aimed to establish a novel ERSG-related prognostic risk model within TCGA-COAD based on 1316 ERSGs which were further acquired from the GeneCards database, providing support for COAD cohorts with different risk score responses to immune checkpoint inhibitor therapies.
Materials and Methods
Our design was prospective, and the reporting of this study conformed to the STARD guidelines. 15 The workflow used in this study is illustrated in Supplemental Figure S1.
Data Source
We collected transcriptome data from 41 normal samples and 473 COAD samples from the TCGA database (https://portal.gdc.cancer.gov/), among which 424 COAD samples with survival information were selected for survival analysis. The GSE39582 cohort, which contains the expression profiles and survival information of 566 colon cancer samples, was downloaded from the GEO database (https://www.ncbi.nlm.nih.gov/geo/). We acquired 1316 ERSGs with a score of > 5 from the GeneCards database (https://www.genecards.org/).
Identification of Differentially Expressed ERSGs
The differentially expressed genes (DEGs) between COAD samples in the TCGA-COAD cohort and controls were determined using the “limma” R package. The |log2fold change (FC)| > 1 and P < .05 were used as the cut-off criteria. Differentially expressed (DE)-ERSGs were obtained by examining the intersection of DEGs and ERSGs.
Functional Enrichment Analysis
Analysis of the activated pathway and process associated with DEGs through Gene Ontology (GO) and Kyoto Encyclopedia of Genes and Genomes (KEGG) methods were conducted using the “clusterProfiler” R package. 16 The significance threshold for biological significance was set at adjusted (adj.) P < .05.
Construction and Verification of the Risk Score Model
We randomly divided the 424 patients with COAD with survival information from the TCGA cohort into a training cohort (296 cases) and a testing cohort (128 cases) at a ratio of 7:3. The univariate Cox analysis was used to identify genes that were significantly associated (P < .05) with the survival of patients with COAD in the training set. Subsequently, the candidate genes were incorporated into the multivariate regression analysis using a stepwise regression function to screen for prognostic genes. The underlying biological significance of prognostic genes was explored using gene set enrichment analysis (GSEA) with the clusterProfiler (V4.6.2) R package, where the relevance of prognostic genes and all genes in each sample was calculated, and genes were sorted according to the correlation coefficients. The org.Hs.egdb (V3.16.0) set was used as the reference gene set to perform a single-gene GSEA enrichment analysis on the sorted genes.
The risk score was calculated using the following formula: risk score = h0(t) × exp (piX1 + p2X2 + _ + PnXn), where P refers to the regression coefficient, X represents the gene expression level, and h0(t) denotes the baseline hazard function.
The median risk score was determined to stratify the patients into high- and low-risk groups. The Kaplan–Meier (K-M) survival curve analysis and log-rank test were performed to evaluate the overall survival (OS) between the high- and low-risk groups using the “survminer” R package. The area under the receiver operating characteristic (ROC) curve (AUC) was calculated using the “survival ROC” package in the R software. In addition, the risk plot was illustrated using the “pheatmap” package in the R software. The GSE39582 cohort was used as a validation cohort. This procedure was performed in the training, testing, and validation cohorts to construct and verify the risk score model.
Correlation Between the Prognostic Signature and Other Clinicopathological Characteristics
To explore the correlation between the risk score model and clinicopathological characteristics, clinical phenotype data in the TCGA cohort, including age (n = 424), sex (n = 424), pathological T stage (n = 423), N stage (n = 424), M stage (n = 373), and tumor stage (n = 413), were extracted and analyzed using the Wilcoxon test. The K-M survival analysis of the indicated subtypes with different clinicopathological characteristics was also performed.
Independent Prognostic Factors and Construction of a Nomogram
Univariate and multivariate Cox regression analyses were performed to identify independent predictors of OS in the TCGA cohort using the “survminer” R package. Then, a nomogram containing independent prognostic factors was constructed using the “rms” R package. We drew the corresponding calibration curves for 1, 3, and 5 years to further verify the accuracy of the nomogram.
Gene Set Variation Analysis for the Low- and High-Risk Groups
Based on the Hallmark gene downloaded from MsigDB (http://www.gsea-msigdb.org/gsea/msigdb/index.jsp), we analyzed the changes in enriched pathways in the high- and low-risk groups using the “GSVA” R package. The threshold for significantly enriched pathways in the Hallmark gene set was P < .05 and |t| ˃ 2. The scores for the significantly enriched pathways in the high- and low-risk groups were further calculated using the single-sample GSEA (ssGSEA) method, and the corresponding heatmap was plotted.
Estimation of Immune Cell Infiltration, Metagene Clusters, and Immune Checkpoint Inhibitor Response of the Low- and High-Risk Groups
The relative abundance of 28 immune cells in each sample was calculated using the ssGSEA algorithm. 17 A box plot was drawn to visualize the differences in the infiltration of 28 immune cells between the low- and high-risk groups. Meanwhile, the Pearson correlation of prognostic genes and differential immune cells was conducted. Correlations between 7 metagene clusters (HCK, IgG, interferon, LCK, MHC-I, MHC-II, and STAT1) and the risk scores were also calculated. The immune checkpoint inhibitor response was assessed using the tumor immune dysfunction and exclusion (TIDE) algorithm, according to a previous report. 18
Ethics Statements
All samples were collected from patients with colon cancer and confirmed via pathological examination at the First People's Hospital of Yunnan Province. This study was approved by the Ethics Committee of the Kunming University of Science and Technology in January 2022 (Ethics code: KMUST-MEC-094). All participants provided written informed consent before enrollment in the study. Written informed consent was obtained from legally authorized representatives (s) for anonymized patient information to be published in this article. The ethical standards followed in this study were in accordance with the Declaration of Helsinki of the World Medical Association.
RNA Extraction and Reverse Transcription-Quantitative Real-Time Polymerase Chain Reaction
We treated 10 pairs of COAD and adjacent normal tissue samples with TRIzol Reagent to isolate total RNA, according to the manufacturer's instructions (Ambion, USA). Simultaneously, total RNA was reverse-transcribed into cDNA for quantitative real-time polymerase chain reaction (qPCR), following the protocol of the SweScript-First-strand-cDNA-synthesis-kit (Servicebio, China). The 2xUniversal Blue SYBR Green qPCR Master Mix (Servicebio, China) was mixed with cDNA and analyzed according to the following thermocycling parameters: 95 °C for 60 s once, 20 s at 95 °C for 40 times, followed by 20 s at 55 °C, and 30 s at 72 °C. The sequences of the primers used in the current study for prognostic genes are shown in Table 1. Finally, the relative expression levels of these genes were estimated using the 2−△△Ct method. 15
The Sequences of the Primers for qPCR.

Abbreviations: qPCR, quantitative polymerase chain reaction; TIMP1, tumor-derived protein tissue inhibitor of metalloproteinases-1; SHH, sonic hedgehog; TRAP1, TNF receptor-associated protein 1; HSPA1A, heat-shock 70 kDa protein 1A; PTGIS, prostacyclin synthase; CPT2, carnitine palmitoyltransferase type II.
Statistical Analysis
All analyses were performed using the R programming language. For experimental data of reverse transcription (RT)-qPCR, the Student's t-test was performed to assess differences in the expression levels of prognostic genes between the COAD and control groups, and the data (n = 10) are presented as the mean ± standard deviation. From the perspective of the results of clinical correlation analysis as well as immune cell infiltration, metagene clusters, and immune checkpoint inhibitor response between the low- and high-risk groups, the function of “stat compare means” in ggplot2 R package (Version 3.3.2) was conducted to compare the difference between the groups through the Wilcoxon test. Moreover, K-M survival and risk stratification analyses were performed using the log-rank test. A two-sided P < .05 was considered statistically significant.
Result
DE-ERSGs in COAD
Compared with normal samples in the TCGA-COAD cohort, 2020 DEGs in COAD samples, including 871 and 1149 genes with upregulated and downregulated expression, respectively, were mined according to the threshold value (Supplemental Table S1 and Figure 1A). The TOP100 DEGs ranked according to P values are shown in Figure 1B. We obtained 1316 ERSGs from the GeneCards database. Hence, 147 DE-ERSGs between the COAD and normal samples were identified by intersecting the 2020 DEGs and 1316 ERSGs (Figure 1C and Supplemental Table S2). The expression of DE-ERSGs was plotted into a heatmap (Figure 1D). GO and KEGG functional enrichment analyses were performed to explore the functions and pathways of the DE-ERSGs. In total, 1267 GO terms, including 1149 biological process (BP) terms, 62 cellular component (CC) terms, and 56 molecular function terms, were enriched (Supplemental Table S3). The TOP10 terms in each category are shown in Figure 1E. In addition, 47 KEGG pathways were enriched (Supplemental Table S3). The TOP15 pathways are displayed in Figure 1F. We noted that the BPs “response to oxygen levels,” “response to oxidative stress,” “response to hypoxia,” “response to decreased oxygen levels,” “response to reactive oxygen species,” “cellular response to chemical stress,” “cellular response to oxygen levels,” “intrinsic apoptotic signaling pathway,” “response to ER stress,” and “cellular response to oxidative stress” were the most closely related to DE-ERSGs. The DE-ERSGs were mainly involved in the “p53 signaling pathway,” “PI3K-Akt signaling pathway,” “cell cycle,” “ECM-receptor interaction,” “AMPK signaling pathway,” and “colorectal cancer.”

Identification of DE-ERSGs. (A) The volcano map of COAD-related DEGs. (B) The heatmap of the TOP100 DEGs. (C) 147 DE-ERSGs were obtained by overlapping the DEGs and ERSGs. (D) The heatmap of DE-ERSGs. (E, F) TOP10 GO items in each category and TOP15 KEGG pathways for DE-ERSGs functional enrichment analysis.
Construction and Internal Validation of the Risk Score Model Based on DE-ERSGs
A total of 424 patients with COAD in the TCGA cohort were divided into 2 cohorts: a training cohort with 296 patients and a testing cohort with 128 patients. The univariate Cox regression analysis was performed to identify prognosis-related genes using the 147 DE-ERSGs from the training set. Fourteen of the 147 DE-ERSGs in the training set were closely related to the OS of patients (Figure 2A and Supplemental Table S4). Fourteen genes were subjected to a stepwise multivariate Cox regression analysis. Eight DE-ERSGs (HSPA1A, CPT2, SHH, KPNA2, CD36, TRAP1, PTGIS, and TIMP1) were identified as prognostic genes (Figure 2B) and their regression coefficients were determined (Supplemental Table S4). We then constructed a risk score model using the following formula: risk score = h0(t) × exp (0.22901687 × expression of HSPA1A + −0.65095395 × expression of CPT2 + −0.35558918 × expression of SHH + −0.53853982 × expression of KPNA2 + 0.43534479 × expression of CD36 + −0.49992833 × expression of TRAP1 + −0.36266191 × expression of PTGIS + 0.28357638 × expression of TIMP1). To assess the feasibility of the risk score model, patients were divided into high- and low-risk groups based on the median value of the risk score in the training and testing cohorts, respectively. The results of the K-M survival analysis indicated that patients with high-risk scores had remarkably worse survival rates than those with low-risk scores

Identification and evaluation of prognostic genes. (A) Forest map of univariate Cox analysis. (B) Forest map of multivariate Cox. (C, G) K-M survival curve for high- and low-risk groups in the training cohort (n = 296) and testing cohort (n = 128). Log-rank test was used to calculate P-values and detect differences. * P < .05, ns, not significant. (D) 1-, 3-, and 5-year ROC curve in the training cohort. (E, I) The distribution of graded risk scores and survival status of the training cohort and test cohort. (H) ROC curve for 1-, 3-, and 5-year in the testing cohort. (F, J) Expression of 8 prognostic genes in high- and low-risk groups of the training cohort and testing cohort.
Validation of the Risk Score Model via External Cohort
We used an independent cohort of 566 patients with colon cancer from the GSE39582 to externally verify the model accuracy. Consistent with the TCGA cohort, high-risk patients exhibited worse OS in the validation set (Figure 3A). Correspondingly, the 1-, 3-, and 5-year AUC values for predicting prognosis were 0.641, 0.639, and 0.612, respectively (Figure 3B). Figure 3C shows the survival status of patients with increased risk scores, and the heatmap results suggested that HSPA1A, TIMP1, CD36, and PTGIS were highly expressed in the high-risk group (Figure 3D). In contrast, CPT2, TRAP1, KPNA2, and SHH were highly expressed in the low-risk group (Figure 3D). These results further confirmed the validity of the ERSG-related risk model in predicting the 1-, 3-, and 5-year survival rates of patients with colon cancer.

Validation of the risk score model. (A) K-M curve of high- and low-risk groups in the GSE39582 cohort (n = 566). Log-rank test was used to calculate P-values and detect differences. * P < .05, ns, not significant. (B) 1-, 3-, and 5-year ROC curve of GSE39582 cohort. (C) The distribution of graded risk score and survival status of patients in the GSE39582 cohort. (D) Expression of 8 prognostic genes in high- and low-risk groups of GSE39582 cohort.
Correlation Between the ERSG-Related Gene Signature and Clinicopathological Characteristic
We investigated the correlation between the risk score and clinical characteristics to clarify the role of the gene signature in COAD progression. As shown in Figure 4A and B, the risk score did not correlate with age or sex. The risk score was higher in patients with advanced stage and high TNM stage, indicating that the risk score correlated with tumor malignancy (Figure 4C to F). Next, we used a stratified survival analysis to investigate whether the risk score could be applied to different clinicopathological characteristics. As shown in Figure 5, the risk score effectively predicted the OS for almost all subgroups with different clinical characteristics, except for the T12 and M1 stages.

The comparison of risk scores between subgroups under different clinical features, including age (<=68: 216, > 68: 208, P = .42) (A), gender (female: 196, male: 228, P = .5) (B), stage (EarlyStage: 238, LateStage: 175, P < .001) (C), T stage (T12: 84, T34: 339), (P = .01) (D), M stage (M0: 315, M1: 58), (P = .01) (E), and N stage (N0: 253, N12: 171), (P < .0001) (F). For (A) to (F), the Wilcoxon test was used to calculate P-values and detect differences. * P < .05, ** P < .01, *** P < .001, **** P < .0001.

Correlation of risk score and different clinical features. (A-H) Stratified survival analyses to investigate the application of risk scores to different clinicopathological features. Log-rank test was used to calculate P-values and detect differences. * P < .05, ns, not significant.
Independent Prognostic Factors of the Risk Score Model and Nomogram Construction
Subsequently, univariate and multivariate Cox regression analyses were performed to evaluate whether the risk score was independent of other clinical parameters (age, sex, tumor stage, T stage, N stage, and M stage) as prognostic factors in patients with COAD. The univariate analysis indicated that age, tumor stage, T stage, N stage, M stage, and risk score were associated with patient prognosis (Figure 6A). The multivariate Cox regression analysis demonstrated that the risk score could be used independently to predict patient prognosis (Figure 6B). Age and tumor stage were also independent prognostic factors in the multivariate analysis. Next, we constructed a nomogram to predict the 1-, 3-, and 5-year OS of patients using independent prognostic factors, including age, tumor stage, and risk score (Figure 6C). Calibration plots showed that the nomogram performed well in predicting the 1-, 3-, and 5-year survival probabilities in patients with COAD (Figure 6D to F).

Clinical utilization of the nomogram. (A, B) Univariate and multivariate Cox analyses to identify the independent prognostic factors in COAD. (C) The nomogram predicts patients’ OS of 1, 3, and 5 years. (D-F) The 1-, 3-, and 5-year calibration plots.
Gene Set Variation Analysis for the High- and Low-Risk Groups
To explore the possible mechanism underlying the difference in prognosis between the high- and low-risk groups, gene set variation analysis (GSVA) was used to analyze the dynamics of biological pathways and processes according to the risk score based on the hallmark gene sets. We found that 17 pathways were enriched in the high-risk group (t < −2), and 18 pathways were enriched in the low-risk group (t > 2) (Figure 7A and Supplemental Table S5). The GSVA and ssGSEA scores for each pathway were also calculated and plotted into the corresponding heatmap (Figure 7B and C). The correlation between the risk score and the pathways is shown in Figure 7D. We noted that immune-related pathways, such as “interferon gamma response,” “IL2 STAT5 signaling,” “TNFα signaling via NFκB,” “IL6 JAK STAT3 signaling,” and “inflammatory response” were enriched in the high-risk group.
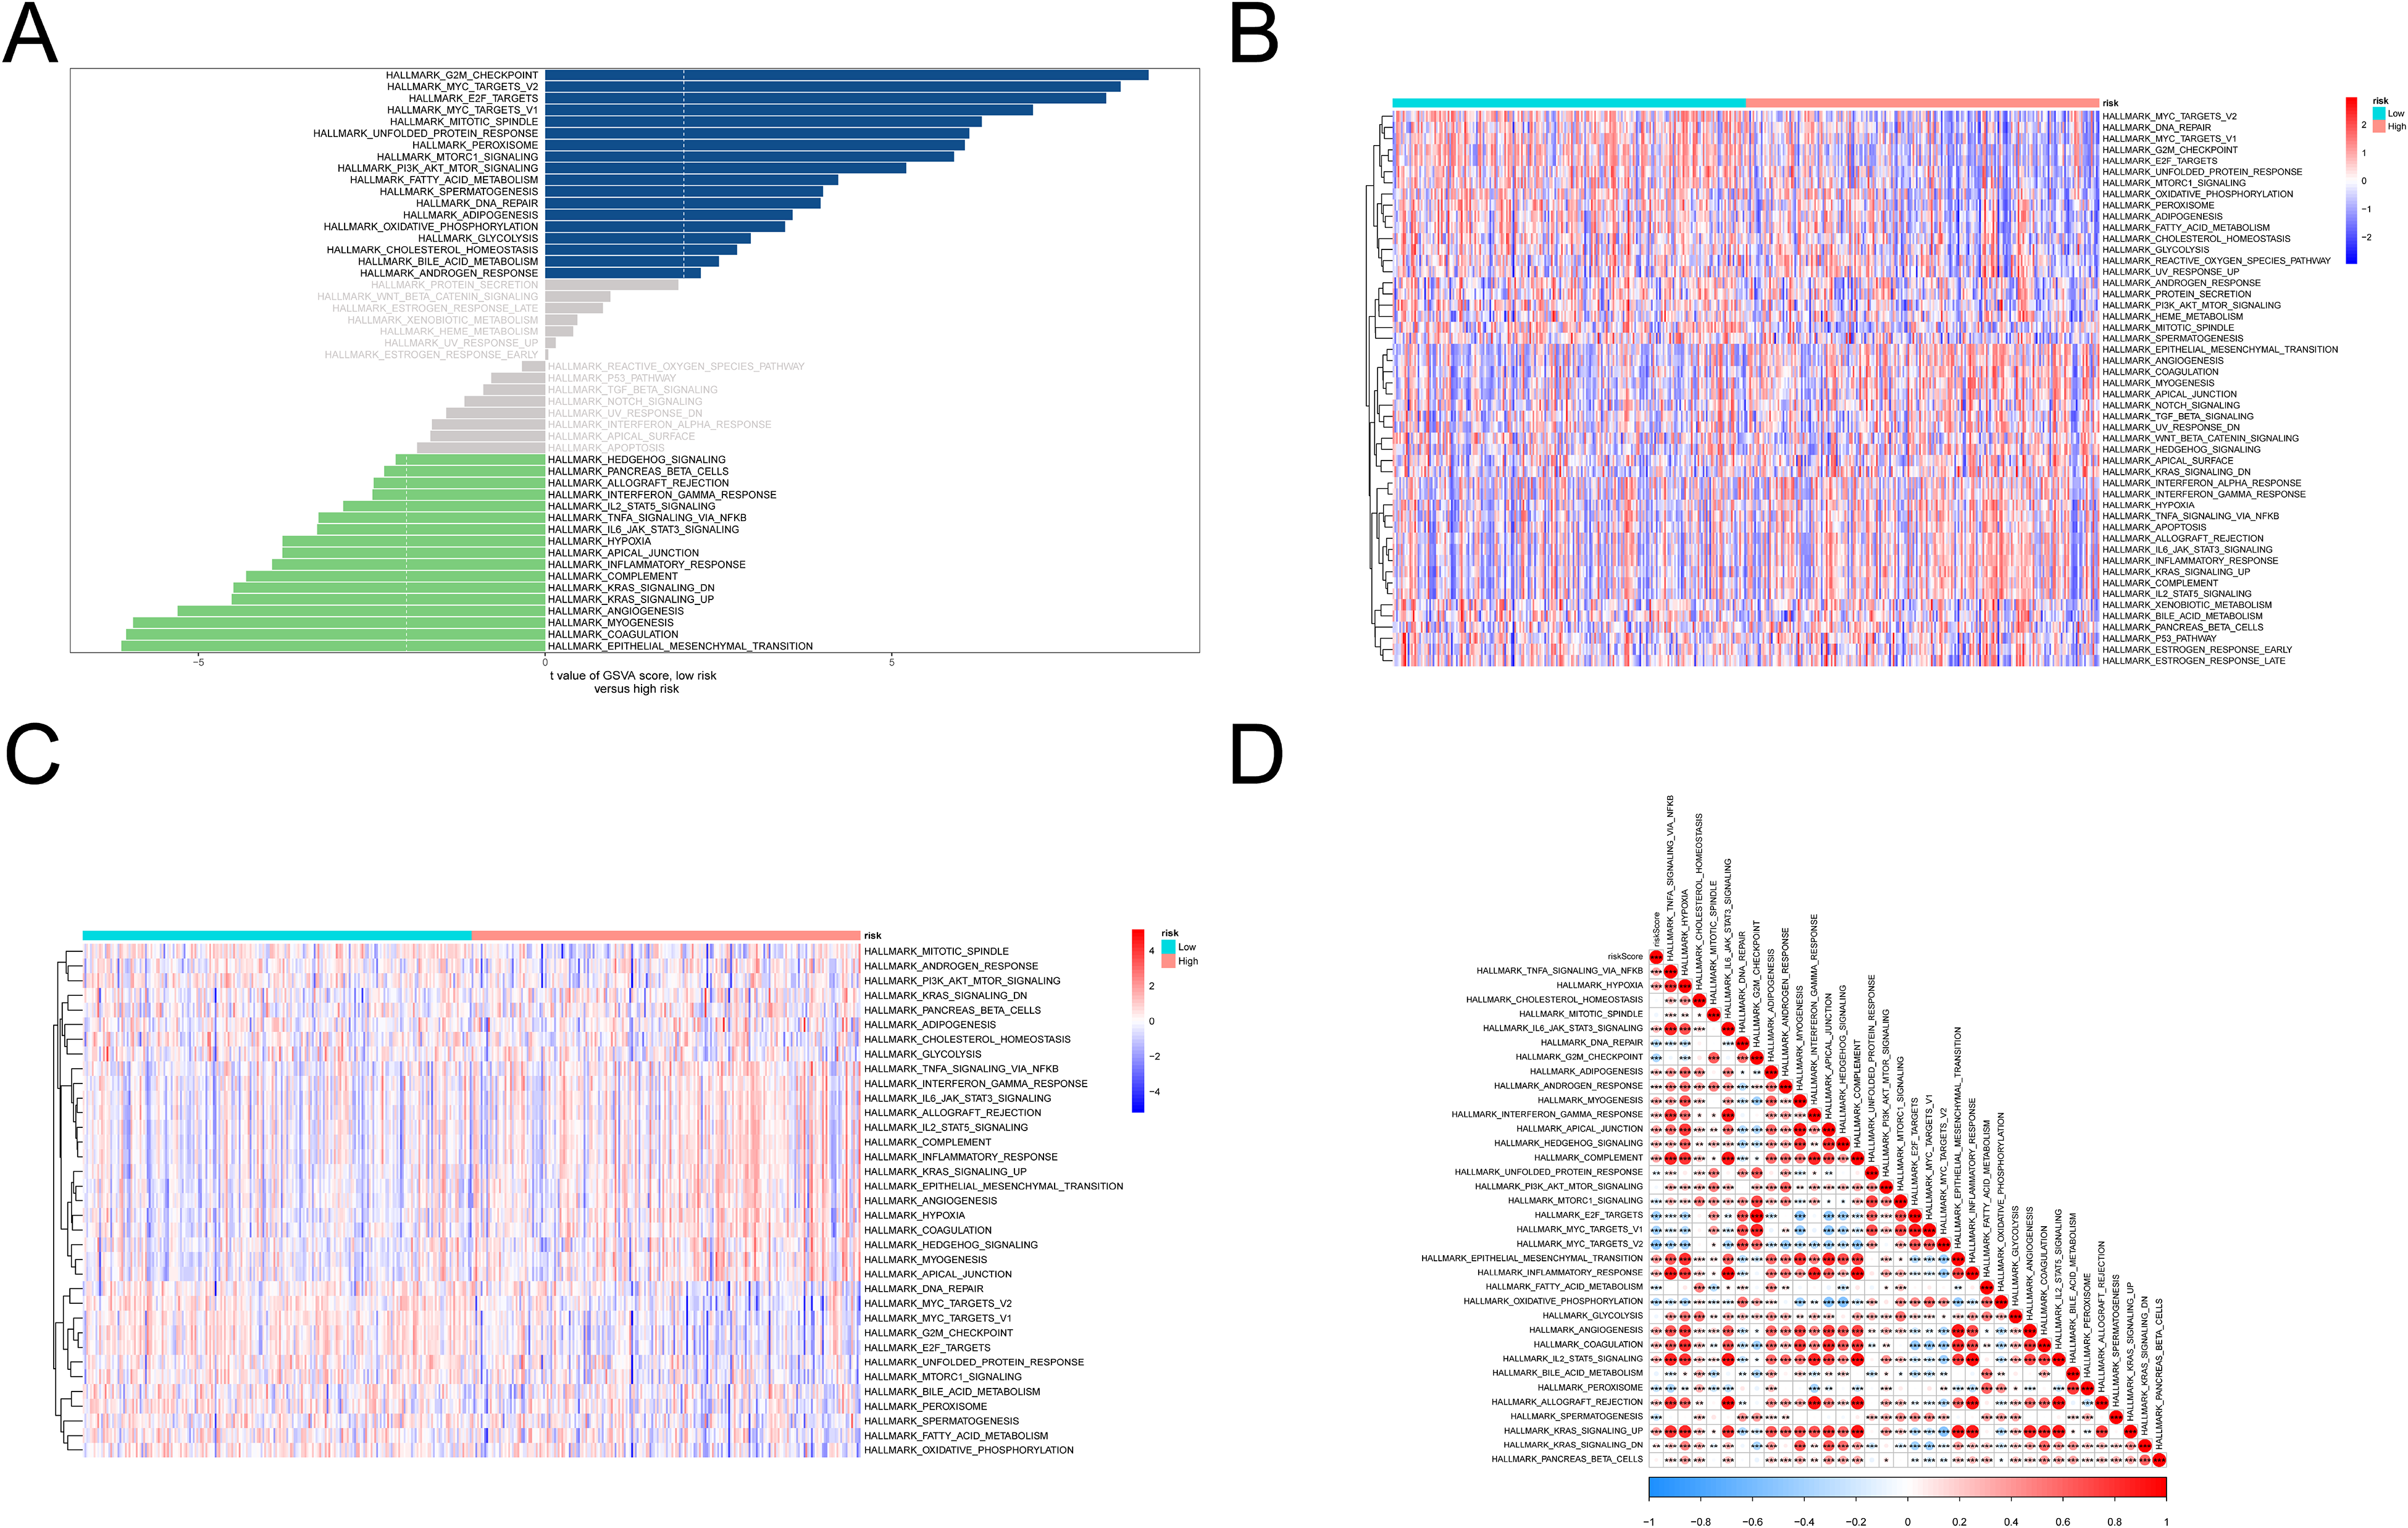
Gene set variation analysis. (A) Pathway enrichment in the high- and low-risk groups by GSVA. (B, C) The heatmap showed the GSVA (B), and ssGSEA (C) scores of each pathway. (D) The correlation between risk score and pathways.
Estimation of Immune Cell Infiltration and Immune Checkpoint Inhibitor Response of the Low- and High-Risk Groups
As immune-related pathways were enriched in the high-risk group, we performed a differential analysis of immune-infiltrating cells between the high- and low-risk groups. The results revealed that the relative abundance of activated dendritic cells, CD56bright natural killer cells, CD56dim natural killer cells, central memory CD4T cells, central memory CD8T cells, effector memory CD4T cells, effector memory CD8T cells, gamma delta T cells, immature B cells, immature dendritic cells, macrophages, mast cells, myeloid-derived suppressor cells, natural killer cells, natural killer T cells, plasmacytoid dendritic cells, regulatory T cells, T follicular helper cells, and type 1 T helper cells was significantly higher in the high-risk group than in the low-risk group (Figure 8A). Therefore, we speculated that there were significant differences in the immune microenvironment between the high- and low-risk groups. Subsequent correlation analysis indicated that the expression of CD36, TIMP1, and PTGIS, were significantly associated with various differential immune cells infiltration. TRAP1 expression might be relevant to Central memory CD4T cell (cor = −0.37, P < .001) and Effector memory CD4 T cell (cor = −0.34, P < .001), and SHH was most negatively related to Natural killer T cell (cor = −0.37, P < .001). While among CPT2, HSPA1A, and KPNA2 and these immune cells infiltration have low correlations (cor < −0.3) (Supplemental Figure S2).

(A) Differential analysis for immune infiltrating cells in the high- and low-risk groups. Wilcoxon test was used to calculate P-values and detect differences. (B) The heatmap shows the expression of 130 genes in the 7 metagenome clusters. (C) The correlation between the metagene clusters and risk score. The numbers in the circles represent the correlation coefficients. * p<0.05, ** p<0.01, *** p<0.001, **** p<0.0001.
Further, we analyzed the relationship between 7 metagene clusters and the risk score. First, we visualized the expression of 130 genes in the 7 metagene clusters in the TCGA cohort, which were plotted into a heatmap
Next, we used the TIDE algorithm to assess the ability of ERSG signatures to predict immunotherapy responses. The results showed that the number of responders in low-risk patients was significantly higher (108/212) than that in high-risk patients (72/212), and the two-tailed P-value of Fisher's exact test was < .001 (Figure 9A). The risk score of responders (n = 180) was significantly lower than that of nonresponders (n = 244) (Wilcoxon test, P < .0001) (Figure 9B). The AUC value of the ROC curve was 0.621, indicating that the risk score had a certain predictive ability for patient response to immunotherapy

Immune-related analyses. (A) The distribution of immunotherapeutic responses in low- and high-risk groups based on the TIDE algorithm (Fisher’s exact test, P < .001). (B) Comparison of risk scores for responders (n = 180) and nonresponders (n = 244) (Wilcoxon test, P < .0001). (C) ROC curve for risk score predicting effectiveness of immunotherapy response (D-G) The expression levels of PD-L1 (P = .01), TIDE score (P < .001), T cell dysfunction score (P < .0001), and T cell exclusion score (P = .01) in the high- and low-risk groups. For D to G, the Wilcoxon test was used to calculate P-values and detect differences. * P < .05, ** P < .01, *** P < .001, **** P < .0001.
Expression Validation and Functional Enrichment Analysis of Prognostic Genes
As shown in Supplemental Table S1, SHH, KPNA2, TRAP1, and TIMP1 levels were upregulated in COAD samples compared with normal samples, according to data from the TCGA database. Meanwhile, HSPA1A, CPT2, CD36, and PTGIS levels were downregulated in COAD samples compared with normal samples, according to data from the TCGA database. To further validate the expression of the prognostic genes, we extracted RNA from 10 COAD and adjacent normal tissue samples and performed RT-qPCR. As shown in Figure 10, KPNA2, SHH, TRAP1, and TIMP1 were expressed at high levels in COAD samples, whereas CPT2, CD36, HSPA1A, and PTGIS were expressed at low levels. The statistical results of RT-qPCR are shown in Table 2. The mRNA expression patterns of the 8 prognostic genes are presented in Table 3. The above experimental results demonstrated that the expression trends of prognostic genes in clinical samples were consistent with the results from the public database.

The expression of 8 endoplasmic reticulum stress-related genes in clinical COAD and adjacent normal samples was confirmed by RT-qPCR (n = 10). (A) KPNA2 (P = .0151, t = 2.685), (B) SHH (P = .04, t = 2.235), (C) TRAP1 (P = .01, t = 3.182), (D) TIMP1 (P = .02, t = 2.685), (E) CPT2 (P < .0001, t = 8.273), (F) CD36 (P = .02, t = 2.471), (G) HSPA1A (P < .0001, t = 6.895), and (H) PTGIS (P = .01, t = 2.856). For A to H, Student’s t-test was used to calculate P-values and detect differences, the bars represent mean ±SD.* P < .05, ** P < .01, *** P < .001, **** P < .0001.
The Statistical Results of the RT-qPCR Experiments in the Current Study.
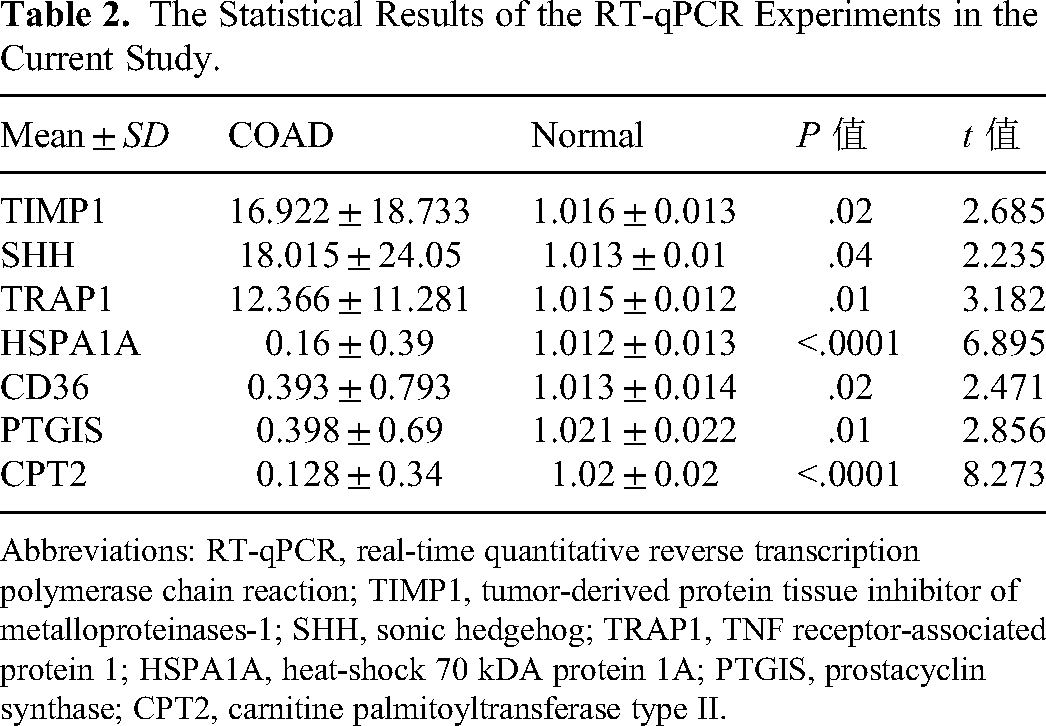
Abbreviations: RT-qPCR, real-time quantitative reverse transcription polymerase chain reaction; TIMP1, tumor-derived protein tissue inhibitor of metalloproteinases-1; SHH, sonic hedgehog; TRAP1, TNF receptor-associated protein 1; HSPA1A, heat-shock 70 kDA protein 1A; PTGIS, prostacyclin synthase; CPT2, carnitine palmitoyltransferase type II.
The mRNA Expression Patterns of the 8 Prognostic Genes.

The enrichment results from GSEA indicated that HSPA1A was mainly related to the CC of the ER lumen and the BP of the release of sequestered calcium ions into the cytosol by ER. CPT2, KPNA2, and TRAP1 were mainly involved in various ER stress-related BPs, such as “regulation of response to ER stress” and “response to ER stress.” In contrast, CPT2 and SHH were closely related to many ER subcellular structures, including the “integral and intrinsic components of ER membrane.” CD36 was associated with “a rough ER membrane”; TIMP1 and PTGIS were common to the CCs of “the lumenal side of the ER membrane” and “ER lumen.” Regarding the KEGG results, only TRAP1, CPT2, SHH, and KPNA2 commonly targeted the ER-related signal pathway of “protein processing in ER”
Discussion
Accurate treatment of colon cancer and prolonged survival remain significant challenges, particularly for patients in the advanced stages. It is crucial to establish a prognostic risk model for patients with colon cancer and provide support for their prognosis and clinical treatment. Previous studies have been limited to gene phenotypes and RNA and have been helpful in the treatment of colon cancer. However, these studies have provided limited support. Furthermore, broader analyses are needed to identify genetic signatures associated with colon cancer. Studies have shown that ERSGs are involved in the occurrence and development of various human diseases, including lung, breast, and liver cancers. 7 Inspired by the study of Yang et al, 11 we aimed to further provide support for COAD cohorts with different risk score responses to immune checkpoint inhibitor therapies based on a novel ERSG-related prognostic risk model that was generated within TCGA-COAD and validated in GSE39582, where 1316 ERSGs were further acquired from the GeneCards database.
Following the identification of 147 differentially expressed ERSGs between patients with COAD and controls, the results of the functional enrichment analysis suggested that DE-ERSGs were involved in the occurrence and development of COAD-related pathways. Further, 8 DE-ERSGs (HSPA1A, CPT2, SHH, KPNA2, CD36, TRAP1, PTGIS, and TIMP1) were identified as ER-related prognostic genes using univariate and multivariate Cox regression analyses, the RT-qPCR experimental results demonstrated that the expression trends of prognostic genes in clinical samples were consistent with the results from public databases. Importantly, gene set variation analysis indicated that differential functionality in high–low-risk groups was related to immune-related pathways. Corresponding to this, CD36, TIMP1, and PTGIS, were significantly associated with various differential immune cells infiltration. The risk score was considered effective for predicting the clinical response to immunotherapy, and the immune checkpoint inhibitor treatment was less effective in the high-risk group.
HSPA1A is a member of the HSP70 family. The HSP70 family is considered a stress-induced survival protein, which is significantly correlated with the improvement in the survival rate of a variety of stressed cells 20 and can promote the cell or organelle transport of proteins and reduce toxic protein aggregates. 21 Some researchers have confirmed that HSP70 is significantly expressed in COAD tissues. 22 In our study, univariate and multivariate Cox proportional hazards analyses exhibited an OR value > 1 of HSPA1A, and meanwhile, the higher expression of HSPA1A was related to a worse prognosis of patients with COAD. The expression of HSPA1A was downregulated in COAD tissues compared with that in normal tissues, indicating the complex mechanism of inhibiting the progression of COAD by decreasing the expression of HSPA1A in the early stage.
CPT2 is a ubiquitous protein located at the 1p32 site in the human mitochondria. 23 A lack of CPT2 often causes a series of lipid diseases, such as obesity and diabetes. In recent years, researchers have confirmed that CPT2 plays an important role in the development of hepatocellular carcinoma. 24 Guo et al 25 suggested that the high expression of distance-related genes related to fatty acid metabolism was associated with the prognosis of patients with COAD, and CPT2 was proven to be an independent prognostic factor for predicting the OS of patients with colorectal cancer. A small number of studies have confirmed that CPT2 is a potential biomarker for colon cancer. 26 In this study, we found that CPT2 exhibited an OR value < 1 and a decreasing tendency in COAD tissues compared with that in normal tissues. It is suggested that down-regulation of CPT2 in the case group might promote COAD progression, echoing the reduction of CPT2 in the high-risk group. These findings complement the previous view.
TIMP1 is a natural glycoprotein that inhibits matrix metalloproteinases (MMPs). Owing to the presence of TIMPs, the human body is in a state of dynamic balance, and increased activity of MMPs or decreased activity of TIMP1 can lead to the occurrence, invasion, and metastasis of tumors. 27 Researchers have revealed that TIMP1 promotes tumor proliferation and metastasis through the FAK-PI3K/AKT and MAPK pathways.
TIMP1 can also increase the anti-apoptotic effect in colon cancer via the Bad protein-mediated phosphorylation pathway. 28 In the present study, the expression of TIMP1 was higher in COAD tissues compared with that in normal tissues, and a well-constructed risk score model indicated that the survival of patients with high TIMP1 expression was significantly lower than that of patients with low TIMP1 expression, showing that up-regulation of TIMP1 in the case group might be positively related to COAD progression. These results further illustrate the potential value of TIMP1 as a novel biological therapeutic target in colon cancer. Besides, the strong correlation between TIMP1 and immune cells infiltration in COAD was explored in previous literature.29,30 However, further studies are required to confirm this finding.
SHH is relatively static in adult mammalian tissues, and abnormal activation of SHH signaling is associated with the occurrence and development of a variety of tumors, such as skin, 31 liver, 32 breast, 33 and lung cancer. 34 The involvement of SHH signaling in the occurrence of colon cancer may be related to the high expression of ALKAL1, which is indirectly involved in the invasion and metastasis of colon cancer. 35 In contrast, some researchers believe that because of the negative regulation of the Wnt signaling pathway, SHH signaling is rarely activated in the tissues of patients with colon cancer, 36 which remains controversial. In our study, it was observed that the expression of SHH was higher in COAD tissues compared with that in normal tissues, while, the SHH expression of patients with a high score was significantly lower than that of patients with a low-risk score, indicating that the increased of SHH expression in the case group might inhibit COAD progression and improve the survival rate of case patients.
KPNA2 is an oncogene and a cohesion protein of the nuclear protein α family, 37 which is involved in the metabolic process of many tumors. Studies have confirmed that KPNA2 is expressed at higher levels in cancer tissues than in normal tissues and is a poor prognostic marker for breast, 38 lung, 39 liver, 40 and gastric cancer. 41 Liang et al 42 suggested that the activation of KPNA2, induced by related genes, would increase the growth of colon cancer tissues and cells and further promote the progression of colon cancer. In this study, TCGA database data and relevant clinical samples also confirmed that KPNA2 was significantly highly expressed in COAD tissues compared with that in normal samples, which is consistent with the results of previous studies. Whereas, just as in SHH, the KPNA2 expression in the high-risk groups was significantly lower than that of patients with a low-risk score, echoing the OR value < 1 of KPNA2. On the other hand, the significant effect of KPNA2 on immune infiltration for cancer progression has been reported, 43 while KPNA2 and differential immune cells infiltration have low correlations in our study. Further studies are required to explain these complex mechanisms of KPNA2 in colon cancer development.
CD36 is a fatty acid receptor that is responsible for fatty acid recognition and transmembrane transport. A study showed that CD36 is a key factor that affects cancer cells. CD36 has been confirmed to accelerate tumor metastasis in oral, 44 liver, 45 breast, 46 and other related cancers. Only a few researchers have concluded through public database analyses that CD36 affects the prognosis of colon cancer. 47 Our study showed that CD36 is down-regulated in COAD samples and is highly expressed in high-risk groups in the constructed prognostic model, which may be a risk factor for patient prognosis. We speculate that CD36 may be involved in the progression of COAD and is associated with poor prognosis of patients, but it is not a major factor in the pathogenesis of COAD. Furthermore, the significant correlation between CD36 and various immune cells in COAD was investigated in the current study. However, its mechanism of action in colon cancer needs to be determined.
TRAP1 is a member of the HSP90 family. Its main role is to resist apoptosis induced by oxidative stress and maintain mitochondrial integrity and cell homeostasis. High TRAP1 expression inhibits apoptosis of tumor cells and promotes drug resistance in tumor cells. The Wnt/β-catenin signaling pathway is largely regulated by TRAP1 expression, and TRAP1 participates in the occurrence and development of tumor cells. 48 Condelli et al suggested that targeting TRAP1 may be a new strategy for improving the activity of pro-apoptotic drugs in colon cancer cells. Wu et al 49 further reported that TRAP1 was considered as an oxidative stress-related biomarker for colon cancer diagnosis and indicator for immunotherapy. In this study, the up-regulation of TRAP1 may be a protective factor for COAD patient prognosis, and the expression of TRAP1 in high-risk cohorts was lower compared with the low-risk individuals.
Prognostic genes that exhibited significant association with immune cells also include PTGIS. COX-2 plays an important role in the development of COAD and is involved in the conversion of arachidonic acid to prostaglandin H2 and the conversion of PTGIS to prostaglandin H2. 50 PTGIS has been studied to promote colon cancer development via tumor angiogenesis. 51 In recent years, there have been a few studies on PTGIS, and there is no clear evidence that PTGIS is associated with colon cancer prognosis. This study is the first to show that PTGIS is associated with colon cancer prognosis.
In addition, we studied the correlation between the risk score and clinical characteristics, and the results showed that the risk score was strongly correlated with the degree of tumor malignancy. Stratified survival analysis showed that the risk score effectively predicted the OS of almost all subgroups with different clinical characteristics, except for patients with T12 and M1 stages. To assess whether the risk score was independent of other clinical parameters in predicting the OS of patients with COAD, we conducted the Cox regression analysis. The results showed that the risk score was an independent predictor of survival in patients with COAD. The reliability and application of the risk score for the prognostic prediction of patients with COAD need to be verified using clinical sample data. Takada et al 52 reported that high KPNA2 expression is associated with poor prognosis of colon cancer. Increased expression of CD36, a fatty acid invertase, promotes COAD metastasis by increasing MMP28 expression and decreasing E-cadherin expression. 53 In this study, we found that the risk score was associated with both the KPNA2 and CD36 genes, indicating that the risk score was reliable in predicting the prognosis of patients with COAD.
Functional enrichment of GSVA in the high- and low-risk groups showed that immune-related pathways were enriched in the high-risk group. Immunity and tumors are closely related, and this has been demonstrated in multiple tumors.54–56 Immunological differences may, to some extent, determine the differences in outcomes of patients with COAD. Based on this, we speculated that there were differences in the immune microenvironment between the high- and low-risk groups by analyzing immune-infiltrating cells. The abundance of plasma dendritic cells, macrophages, natural killer cells, and other related immune cells was significantly higher in the high-risk group than in the low-risk group. Previous studies have shown that immune cell infiltration is essential for the treatment and prognosis of colon cancer. 57 Plasmacytoid dendritic cells play a central role in immune function and play an important role in the establishment, development, and progression of tumors. The prognosis of colon cancer is related to the level of immune infiltration by dendritic cells. 58 Tumor-associated macrophages produce pro-inflammatory cytokines that enhance the transcriptional activity of tumor cells, thereby promoting the growth of colon cancer cells. Tumor-related microenvironments also play key roles in tumor progression and metastasis. 59
The TIDE algorithm was used to evaluate the predictive ability of the ERSG signature for immunotherapy response. The AUC was 0.621, which further demonstrated that the risk score had a certain predictive ability for the immunotherapy response. The high-risk group had a lower response to immunotherapy than the low-risk group, which may have been caused by tumor-infiltrating lymphocyte dysfunction. Related studies have found that the pH of tumors promotes the maturation of the corresponding lymphocytes to accelerate tumor progression, 16 which is consistent with the results of this study and provides support for further research on the correlation between tumor-infiltrating lymphocytes and the prognosis of patients with colon cancer.
Our study identified 8 ERSGs and established a new risk score and prognostic model. Risk scores can effectively predict the prognosis of patients with COAD and provide theoretical support for their clinical treatment. This study had several advantages. First, we constructed a prognostic risk model based on a large number of ERSGs and explored the clinical correlations between the prognostic model and the nomogram using multiple statistical methods. Second, the relevant risk score and prognostic model exhibited excellent predictive performance for the OS of COAD cohorts in internal and external datasets and were considered effective for the prediction of the clinical response to immunotherapy, showing an effective potential for COAD survival prediction. However, this study had some limitations. The established prognostic model was generated based on a public database; thus, more verification experiments, such as immunohistochemical staining and potential biological function analysis targeting key genes supporting the pathway findings in the occurrence and development of colon cancer, are required. Moreover, predictive performance needs to be verified both in vitro and in vivo. Meanwhile, the expression of these prognostic ERSGs in correlated differential immune cells was distinct, and further single-cell expression profiling should be conducted to determine their association with immune infiltration.
Conclusion
This study primarily targeted DE-ERSGs for the prognosis of colon cancer. Eight key genes were selected and used to establish a risk signature with the potential for predicting the prognosis of patients with COAD. Nomograms constructed based on 8 key ERSGs seem to be effective for clinical use and may provide theoretical support for the clinical treatment of COAD patients as well as possible new related gene targets.
Supplemental Material
sj-pdf-1-tct-10.1177_15330338231212073 - Supplemental material for Exploration of an Prognostic Signature Related to Endoplasmic Reticulum Stress in Colorectal Adenocarcinoma and Their Response Targeting Immunotherapy
Supplemental material, sj-pdf-1-tct-10.1177_15330338231212073 for Exploration of an Prognostic Signature Related to Endoplasmic Reticulum Stress in Colorectal Adenocarcinoma and Their Response Targeting Immunotherapy by Yu Xu, Yang-Mei Xie, Wen-Sha Sun, Rong Zi, Hong-Qiao Lu, Le Xiao, Kun-Mei Gong and Shi-Kui Guo in Technology in Cancer Research & Treatment
Supplemental Material
sj-pdf-2-tct-10.1177_15330338231212073 - Supplemental material for Exploration of an Prognostic Signature Related to Endoplasmic Reticulum Stress in Colorectal Adenocarcinoma and Their Response Targeting Immunotherapy
Supplemental material, sj-pdf-2-tct-10.1177_15330338231212073 for Exploration of an Prognostic Signature Related to Endoplasmic Reticulum Stress in Colorectal Adenocarcinoma and Their Response Targeting Immunotherapy by Yu Xu, Yang-Mei Xie, Wen-Sha Sun, Rong Zi, Hong-Qiao Lu, Le Xiao, Kun-Mei Gong and Shi-Kui Guo in Technology in Cancer Research & Treatment
Supplemental Material
sj-pdf-3-tct-10.1177_15330338231212073 - Supplemental material for Exploration of an Prognostic Signature Related to Endoplasmic Reticulum Stress in Colorectal Adenocarcinoma and Their Response Targeting Immunotherapy
Supplemental material, sj-pdf-3-tct-10.1177_15330338231212073 for Exploration of an Prognostic Signature Related to Endoplasmic Reticulum Stress in Colorectal Adenocarcinoma and Their Response Targeting Immunotherapy by Yu Xu, Yang-Mei Xie, Wen-Sha Sun, Rong Zi, Hong-Qiao Lu, Le Xiao, Kun-Mei Gong and Shi-Kui Guo in Technology in Cancer Research & Treatment
Supplemental Material
sj-pdf-4-tct-10.1177_15330338231212073 - Supplemental material for Exploration of an Prognostic Signature Related to Endoplasmic Reticulum Stress in Colorectal Adenocarcinoma and Their Response Targeting Immunotherapy
Supplemental material, sj-pdf-4-tct-10.1177_15330338231212073 for Exploration of an Prognostic Signature Related to Endoplasmic Reticulum Stress in Colorectal Adenocarcinoma and Their Response Targeting Immunotherapy by Yu Xu, Yang-Mei Xie, Wen-Sha Sun, Rong Zi, Hong-Qiao Lu, Le Xiao, Kun-Mei Gong and Shi-Kui Guo in Technology in Cancer Research & Treatment
Supplemental Material
sj-pdf-5-tct-10.1177_15330338231212073 - Supplemental material for Exploration of an Prognostic Signature Related to Endoplasmic Reticulum Stress in Colorectal Adenocarcinoma and Their Response Targeting Immunotherapy
Supplemental material, sj-pdf-5-tct-10.1177_15330338231212073 for Exploration of an Prognostic Signature Related to Endoplasmic Reticulum Stress in Colorectal Adenocarcinoma and Their Response Targeting Immunotherapy by Yu Xu, Yang-Mei Xie, Wen-Sha Sun, Rong Zi, Hong-Qiao Lu, Le Xiao, Kun-Mei Gong and Shi-Kui Guo in Technology in Cancer Research & Treatment
Supplemental Material
sj-docx-6-tct-10.1177_15330338231212073 - Supplemental material for Exploration of an Prognostic Signature Related to Endoplasmic Reticulum Stress in Colorectal Adenocarcinoma and Their Response Targeting Immunotherapy
Supplemental material, sj-docx-6-tct-10.1177_15330338231212073 for Exploration of an Prognostic Signature Related to Endoplasmic Reticulum Stress in Colorectal Adenocarcinoma and Their Response Targeting Immunotherapy by Yu Xu, Yang-Mei Xie, Wen-Sha Sun, Rong Zi, Hong-Qiao Lu, Le Xiao, Kun-Mei Gong and Shi-Kui Guo in Technology in Cancer Research & Treatment
Supplemental Material
sj-xlsx-7-tct-10.1177_15330338231212073 - Supplemental material for Exploration of an Prognostic Signature Related to Endoplasmic Reticulum Stress in Colorectal Adenocarcinoma and Their Response Targeting Immunotherapy
Supplemental material, sj-xlsx-7-tct-10.1177_15330338231212073 for Exploration of an Prognostic Signature Related to Endoplasmic Reticulum Stress in Colorectal Adenocarcinoma and Their Response Targeting Immunotherapy by Yu Xu, Yang-Mei Xie, Wen-Sha Sun, Rong Zi, Hong-Qiao Lu, Le Xiao, Kun-Mei Gong and Shi-Kui Guo in Technology in Cancer Research & Treatment
Footnotes
Acknowledgments
Thanks to the Department of General Surgery, Affiliated Hospital of Kunming University of Science and Technology, for supporting this research data.
Declaration of Conflicting Interests
The author(s) declared no potential conflicts of interest with respect to the research, authorship, and/or publication of this article.
Funding
The author(s) disclosed receipt of the following financial support for the research, authorship, and/or publication of this article: This study was supported by the Joint Fund of Yunnan province, China (202001AY070001-131).
Ethics Approval and Consent to Participate
All patients were informed and agreed to this study, and this study was approved by the Medical Ethics Committee of Kunming University of Science and Technology (Approval Number: KMUST-MEC-094).
Availability of Data and Materials
The GSE39582 cohort used in our study can be found in the GEO database (https://www.ncbi.nlm.nih.gov/geo/query/acc.cgi?acc = GSE39582), and the TCGA-COAD cohort (![]() ) is available.
) is available.
Supplemental Material
Supplemental material for this article is available online.
References
Supplementary Material
Please find the following supplemental material available below.
For Open Access articles published under a Creative Commons License, all supplemental material carries the same license as the article it is associated with.
For non-Open Access articles published, all supplemental material carries a non-exclusive license, and permission requests for re-use of supplemental material or any part of supplemental material shall be sent directly to the copyright owner as specified in the copyright notice associated with the article.