
Abstract
Introduction
Cancer causes approximately 1 out of 6 deaths worldwide. It is the second leading cause of death globally, with 8.7 million deaths estimated in 2015. 1 Although significant progress has been made in cancer treatment in the past few decades, chemotherapy remains the most common approach to cancer therapy. Chemotherapeutic drugs can be divided into different classes according to their therapeutic mechanisms (antimetabolite compounds, mitotic spindle inhibitors, alkylating agents, and topoisomerase inhibitors).2,3 However, multidrug resistance (MDR) has become the most significant obstacle to the success of cancer chemotherapy. MDR is the main mechanism of resistance to chemotherapeutic drugs in various types of cancer.3-5 MDR causes >90% of deaths in patients with cancer treated with traditional chemotherapeutics or novel targeted-therapy drugs. The mechanisms of MDR include increased metabolism of exogenous substances, increased drug efflux, growth factors, increased DNA repair capabilities, and genetic factors (gene mutations, amplifications, and epigenetic changes). 6 They affect various solid tumors, including breast cancer, lung cancer, and gastrointestinal cancer. Tumors are usually composed of malignant cells; some of these are sensitive to drugs and others demonstrate MDR. The chemotherapeutic drugs eliminate sensitive cells while retaining a higher percentage of drug-resistant cells, causing the tumor to grow again.7,8 As the primary mechanism of cancer, MDR is dependent on the expression of an energy-dependent efflux pump called an adenosine triphosphate binding cassette transporter. A total of 48 members of this protein family have been identified in humans, which are involved in various physiological functions, such as the transport of sterols, lipids, ions, and peptides. These transporters have extensive drug specificities and can transport a range of structurally diverse compounds. The activity levels of certain members of these transporters reduce the accumulation of drugs in MDR cells, leading to reduced treatment efficacy,9-11 including the classical transporter permeability-glycoprotein (P-gp), also known as MDR1 or ABCB1. P-gp is a 170 kDa transmembrane glycoprotein discovered 40 years ago, which is considered to be the first identified MDR transporter. It has long been considered to be a viable target for overcoming MDR in cancer. 12 Therefore, it is essential to develop early tests to predict MDR and combinational treatment of anti-MDR compounds that can inhibit and eliminate multidrug-resistant tumor cells.
Circulating tumor cells (CTCs) are rare tumor cells that have been studied as diagnostic, prognostic, and predictive biomarkers in numerous types of cancer.13-15 CTCs are separated from the primary tumor or metastases and spread into the patient's bloodstream. This approach ensures that cancer tissue samples are relatively easy to be obtained. In addition, they indicate the actual state of cancer and can be evaluated multiple times during treatment.
Currently, some companies have conducted tests on the application of CTCs in clinical practice, such as CellSearch. CTC-related research has accumulated high clinical effectiveness, notably in the study of breast, lung, prostate, and colorectal cancer.16,17 As part of the liquid biopsy, CTCs assessment provides a large number of clinically relevant information, reflecting the disease's real-time status. This can be used for cancer diagnosis or screening, real-time longitudinal disease monitoring, and even treatment guidance. 18 At present, the acquisition technology of CTCs is mainly divided into 2 categories. The first category is to separate CTCs using their unique biological properties, and the second category is to separate CTCs using their physical characteristics. Biological properties used in tag-dependent techniques include cell surface proteins, such as EpCAM, CD45, and other classes of biomarkers. Physical properties of tumor cells used in label-independent techniques include size, plasticity, and density. In our study, CTCs were isolated using their unique biological properties. Compared with other methods, this method captures CTCs with high specificity and efficiency.15,19,20 Based on the convenience of obtaining CTCs and the lack of physical trauma, the present study aimed to create a novel diagnostic method by using CTCs of patients with cancer to predict the patient's response to chemotherapeutic drugs in advance; this can in turn guide clinicians toward rational drug use.
Single-cell bioanalyzer (SCB) has been recently developed, functioning as an in vitro diagnostic instrument in clinical sample analysis. This instrument can be used to study MDR by monitoring the drug efflux of cancer cells in real time.21,22 This new microfluidic method has been used to investigate the effect of MDR on drug modulation by studying the accumulation of daunorubicin in MDR leukemia cells. This novel technology contains 3 key advantages. Firstly, SCB is very simple because it does not require multiple cycles of drug absorption and drug efflux. Secondly, it is faster than traditional liquid biopsy. Thirdly, due to its ability to compare the time points before the MDR modulator test, it provides a more reliable control. To aid the understanding of the kinetics of drug accumulation in MDR cells, a mathematical model was established to represent the dynamics of drug aggregation in single cells. 23
The present study aimed to assess the probability of SCB and microfluidic chip technology in identifying patients with cancer, who are resistant to specific types of chemotherapy, such as fluorescein isothiocyanate (FITC)-labeled paclitaxel (PTX), and to propose novel methods that can provide clinicians with more appropriate choices in their diagnostic approaches.
Materials and Methods
The study was designed as a prospective study. The SCB and microfluidic chip were obtained from ZellChip Technologies Inc. RPMI 1640 medium (Catalog number: 11875093), PTX with green fluorescence, trypsin-ethylenediaminetetraacetic acid (EDTA), penicillin/streptomycin, and fetal bovine serum (FBS) were purchased from Thermo Fisher Scientific, Inc. 4′,6-diamidino-2-phenylindole (DAPI) and tariquidar were obtained from Invitrogen and Thermo Fisher Scientific, Inc. EpCam antibody (1:100; Catalog number: 2929) and CD45 antibody (1:100; Catalog number: 13917) were purchased from Cell Signaling Technology, Inc.
SCB and Microfluidic Chip Design
The microfluidic chip (2.5 cm × 7.5 cm) was composed of 4 channels, 4 reservoirs, and a chamber containing the cell-retaining structure (Figure 1A–C). The lower left and right reservoirs (1,2) serve as the sample inlet and waste reservoir, respectively. The role of the reservoir (3,4) is to deliver anticancer drugs or P-gp inhibitors. The channel depth was 40 μm, while the reservoir was 1 mm deep and 1.5 mm in diameter. The microchip was made of polydimethylsiloxane. The retention structure of the cells within the chamber was used to select and retain individual cancer cells (Figure 1D).24,25 Based on this active cell trapping strategy, a well-conditioned cell could be established that ensured the successful removal of other unwanted cells. 26

The microfluidic chip allows the isolation and treatment of single cells in the single-cell bioanalyzer (SCB). (A) Images of the microchip. (B) The layout of the microfluidic device indicates that reservoirs 3 and 4 were used for drug delivery, whereas reservoirs 1 and 2 served as the cell inlet and waste, respectively. The “S” corresponds to the cell retention structure. (C) Schematic diagrams displaying the sorting of a single cancer cell and its retention near the cell retention structure. (D) The cancer cell retained within the cell retention structure is shown.
Cell Lines and Cell Culture
The A549 cell line (ATCC number: CCL-185) (chemosensitivity) was purchased from ATCC and cultured in RPMI 1640 medium supplemented with 10% FBS, 100 μg/mL penicillin, and 100 μg/mL streptomycin. A549 cells were treated to produce the A549T cell line (PTX-resistant A549 cells). A549T cells were derived following treatment of A549 cells with PTX (2.0 μg/mL) and cultured with RPMI 1640 medium until stable PTX resistance was achieved. All cells were incubated at 37°C with 5% CO2. The medium of the cells was replaced every 2–3 days.
Immunofluorescence Analysis
Sterile coverslips were placed in a 6-well plate. The tumor cells were seeded on 6-well plates and incubated for 8 h for cell adhesion. Following cell adhesion, the medium was removed, fixed with 1 mL 4% paraformaldehyde for 15 min, and subsequently washed 3 times with phosphate-buffered saline (PBS). Paraformaldehyde-fixed tumor cells were incubated with 0.2% Triton X-100 (1 mL) for 10 min and subsequently washed 3 times with PBS. Following 1 h of treatment, the treated cells were incubated with a primary antibody overnight at 4°C. The following day, the samples were washed 3 times with PBS. Subsequently, the cells were incubated with fluorescence marker-conjugated secondary antibodies (diluted in a blocking solution; 1:500) for 1 h at room temperature in the dark. Finally, the coverslips were mounted with Prolong Gold Antifade Reagent and stained with DAPI.
Isolation of Individual Cancer Cells
The channels and chambers of the single-cell microfluidic chip were filled with RPMI 1640 cell culture medium. The samples containing CTCs were injected from reservoir 1 into a single-cell microfluidic chip. The sample was subsequently observed under the microscope following injection; as soon as the CTCs were observed in the channel of the single-cell microfluidic chip, they were immediately directed to the cell retention chamber “S” by manipulating the fluid flow via reservoir 2.
Extraction of CTCs From Blood and Collection of Pleural Fluid From Patients with Lung and Breast Cancers
Our study has obtained verbal consent from patients. Use the EDTA-k2 anticoagulant vacuum blood collection tube to obtain about 7 mL of the patient peripheral blood, and turn it upside down 5 times to adequately mix the anticoagulant and blood. Store at 4°C. Add lymphocyte separation solution Ficoll (GE Healthcare Life Sciences, Catalog number: 17-1440-02) to a 50 mL centrifuge tube. Take the anticoagulated peripheral blood and mix it well with sterile PBS at a ratio of 1:1 and use a pipette to slowly superimpose it on the lymphocyte separation solution Ficoll surface along the tube wall. The movements should be gentle and pay attention to maintain a clear interface. The final volume ratio of peripheral blood, PBS, and lymphocyte separation medium is 1:1:1. Horizontal centrifugation at 400 g for 30 min. After centrifugation, it can be seen that the tube is divided into 3 layers, the upper layer is plasma and PBS, the lower layer is mainly red blood cells and granulocytes, and the middle layer is lymphocyte separation liquid. At the interface between the upper and middle layers, there is a narrow zone of white cloud layer dominated by mononuclear cells, mainly mononuclear cells, including lymphocytes and monocytes. In addition, it contains platelets. Remove part of the supernatant liquid, leaving about 1 mL of supernatant liquid, insert the pipette into the cloud layer, and aspirate the mononuclear cells. Put it into another centrifuge tube, add more than 5 times the volume of PBS, centrifuge at 300 g for 10 min, and wash the cells twice. After the final centrifugation, discard the supernatant, add red blood cell lysis buffer, and incubate the tube at room temperature for 5 min to lyse the erythrocytes. The time can be appropriately increased or decreased according to the situation. Add 10 mL of PBS, centrifuge at 300 g for 10 min, and wash the cells twice. 9 After the final centrifugation, discard the supernatant, add 50 μL RPMI 1640 (Invitrogen) containing 10% FBS (ThermoFisher Scientific), and resuspend the cells. Then count and calculate the cell viability. The IsoFlux Circulating Tumor Cell Enumeration Kit (Catalog numbers: 910-0091 and 910-0093) is a complete reagent kit for the detection of CTCs from biological samples (whole blood, ascites, etc). It contains antibodies and reagents for purification and immunofluorescence staining of cells to define CTCs as EpCAM+, EGFR+, CD45−, nucleated, and intact cells.
Single-Cell Selection and Retention
The cells were allowed to reach their quiescent phase and the medium solution was injected into reservoir 1 to ensure that the cells were quiescent prior to the drug accumulation experiments. Drug accumulation was subsequently performed in the S chamber. Firstly, the accumulation of anticancer drugs in individual tumor cells was measured in the absence of P-gp inhibitors. Following the collection of data by the computer, the chip shuttles back and forth to allow measurements of cells in and out of the detection window. Cell fluorescence intensity was measured when the cells were within the window. The background was calculated when the cells were outside the window. The background was subtracted from the fluorescence intensity and yielded a corrected signal representing the drug concentration within a single cancer cell.
SCB Detects Drug Accumulation on Single Cells
An optical detection system consisting of an inverted microscope was employed for simultaneous fluorescence measurement and bright-field observation. Using a dichroic filter (620 nm), only red light for cell observation entered the video camera, whereas the orange-fluorescent emission (585 nm) under the blue excitation (470 nm) was transmitted to the photomultiplier tube through a detection aperture. The chip was translated back and forth so that the detection aperture window observed the cell or its surrounding region in turn. When the cell was in or out of the detection aperture, the cellular fluorescence or background signal was measured, respectively. During the measurement phase, select 1 CTC cell and keep the cell in the chip, remove the cell culture medium from all vessels, and add the chemotherapeutic drug to reservoir 3 for approximately 1000 s. Start fluorescence measurements to observe drug accumulation in cells. After the chemotherapeutic drug accumulation phase, remove all solutions from the reservoir and add cell culture medium from reservoir 3. The goal is to wash away the chemotherapy drugs around the cells. After the P-gp inhibitor was subsequently added from reservoir 4, the accumulation of the drug was observed in the computer.
Statistical Analysis
Data are presented as the mean ± standard deviation (SD). The statistical significance test was performed by using the t-test. Detecting statistical differences before and after treatment of the same sample by paired t-test. A P-value <.05 was considered statistically significant.
Ethics Statement
The informed consent was signed by the patients and this study was approved by the Institutional Review Board of the Kiang Wu Hospital (approval number: 2018-007) and Zhuhai Hospital of Traditional Chinese and Western Medicine (approval number: 20190613001). Macau University of Science and Technology (approval number: MUST-FDTC-20221114001). Consent for publication was not applicable.
Results
SCB Detects Drug Accumulation in Chemoresistant and Chemosensitive Cells
Initially, the uptake of PTX-insensitive and PTX-sensitive lung cancer cells was investigated. A549 and A549T cells were treated with 2.0 μg/mL PTX for 15 min and subsequently, a fluorescence microscope was used to observe the fluorescent PTX emitted by the 2 cells. Following dosing, the cells were incubated for 15 min and the fluorescence intensity of the chemotherapeutic drug was found to be higher in sensitive A549 cells than that noted in the resistant A549T cells (Figure 2A and B). The individual tumor cells were retained in the single-cell microfluidic chip and the computer measured the fluorescence intensity to perform background correction. Fluorescent PTX was added and the SCB was used to measure PTX accumulation in a single cell. The curve fitting analysis was performed on the normalized accumulation data using Sigma Plot (version 11.0). The research was applied to the data obtained in the absence and presence of PTX. As shown in Figure 2C, following the retention of a single A549 cell at the “S” position of the microfluidic chip, the signal of the drug accumulation was detected by SCB. Following the stabilization of the 800 s background value, the chemotherapeutic drug FITC-labeled PTX was added. The results indicated that the fluorescence signal value was significantly increased by ∼2.5-fold (P < .001), reaching a maximum of 0.124 in ∼2100 s Following the retention of A549T cells and their treatment with PTX, the fluorescence signal value did not significantly increase (P > .05) (Figure 2D). A549 cells are sensitive to chemotherapeutic drugs. Following the addition of the chemotherapeutic drug PTX, which was labeled with FITC, the accumulation of the drugs in the cells was increased, and the fluorescence signal value measured by SCB was also increased. By contrast, A549T cells were induced by PTX and demonstrated specific chemical resistance to this compound; therefore, the concentrations of the drugs accumulated in the cells were not increased. The fluorescence signal intensity of A549 cells was 8.4-fold higher than that of A549T cells.

Investigation of the PTX-sensitive and resistant lung cancer cells. (A and B) A549 and A549T cells were treated with 2.0 μg/mL PTX for 15 min. The fluorescence intensity was measured by the SCB assay. (A) Images of the fluorescent chemotherapy-treated A549 cells. (B) Images of the fluorescent chemotherapy-treated A549T cells. (C) Drug accumulation was measured on a single A549 cell. The fluorescence signal value was significantly increased by ∼2.5-fold (P < .001), reaching a maximum of 0.124 in ∼2100 s. (D) Drug accumulation was measured on a single A549T cell. The retention of A549T cells and their treatment with PTX, the fluorescence signal value did not significantly increase (P > .05). The statistical analysis of data was performed by the t-test (n = 3).
P-gp Inhibitor Restores Drug Accumulation in A549T Cells
Various studies in recent years have shown that MDR is an important factor responsible for the failure of cancer chemotherapy. P-gp has long been recognized as a viable target for overcoming MDR in cancer.10,11 Therefore, in the present study, the P-gp inhibitor, tariquidar, was added to A549T cells to verify that SCB could detect drug accumulation and accurately predict drug resistance in patients with cancer. The fluorescence value of A549T cells was significantly increased by ∼2.8-fold (P < .001) in response to tariquidar compared with that noted in A549 cells (Figure 3A and B). The intracellular P-gp ion pump expressed in A549T cells can transport the drug out of the cell, and the concentration of the chemotherapeutic drug will not increase in the intracellular compartment. Following the addition of a P-gp inhibitor, the action of the P-gp ion pump was inhibited, resulting in increased drug accumulation in the cell.

The effect of the P-gp inhibitor in A549/A549T cells. Following treatment of A549 and A549T cells with 2.0 μg/mL PTX and 80 μmol/mL tariquidar, the SCB was used to detect the drug accumulation of the 2 cells. (A) The drug accumulation was measured on a single A549 cell. (B) The drug accumulation was measured on a single A549T cell. The fluorescence value of A549T cells was significantly increased by ∼2.8-fold (P < .001) in response to tariquidar compared with that noted in A549 cells. The statistical analysis of data was performed by the t-test (n = 3).
Cancer Cells can be Isolated and Captured From “Mimic” Blood
To confirm that the SCB kit could capture CTCs in the peripheral blood or pleural effusion samples, a model was used to simulate the peripheral blood environment of the patient. Whole blood samples of healthy subjects were obtained from Macau Red Cross Donation Center. Peripheral blood mononuclear cells (PBMCs) were extracted from the blood samples. The PBMCs were spiked with A549 cells in the culture medium (1:5000 ratio of PBMCs to tumor cells). In the CTC capture stage, the CTC markers used EpCAM and CD45 antibodies. Anti-EpCAM antibodies to identify CTCs and anti-CD45 antibodies to identify leukocytes. EpCAM is a transmembrane glycoprotein found almost exclusively in benign and neoplastic epithelial cells. EpCAM is uniformly expressed in carcinomas. In our approach, anti-EpCAM is conjugated into magnetic beads to perform the immunomagnetic separation. Conversely, the principle of utilizing CD45 (common leukocyte antigen), an antigen that is expressed on peripheral blood cells but not CTCs, to identify and isolate the latter is referred to as negative selection. The basis behind the negative selection is the removal of any leukocytes within a sample leaving behind an isolate that is highly enriched for CTCs. A549T cells were stained with anti-EpCAM (green fluorescence). The nuclei were stained with DAPI (blue fluorescence), and the lymphocytes were stained with CD45-cyanine 3 (red fluorescence) (Figure 4B). These results indicated the successful use of antibodies to isolate and capture tumor cells from “mimic” blood.

Cancer cells can be isolated from “mimic” blood by SCB analysis. (A) Images of mixing cancer cells with PBMCs (this image was obtained with an SCB; therefore, the background was red). (B) Tumor cells were incubated with antibodies and imaged using a fluorescent microscope.
The Establishment of a Prediction Platform for Chemotherapy Sensitivity of Patients With Lung Cancer
The prediction of the chemosensitivity was carried out in samples from lung cancer patients. CTC samples were obtained from 6 patients with confirmed nonsmall cell lung cancer from Kiang Wu Hospital in Macau, including 3 peripheral blood CTCs and 3 pleural effusion CTCs. The age of the patients ranged from 54 to 75 years old, and the tumor node metastasis (TNM) stage contained 1 stage II patient and 5 stage IV patients (Table 1). The patients’ CTCs were isolated by EpCAM antibodies and loaded on chips. CTCs were successfully extracted from blood and pleural effusion samples and fixed in the microfluidic chip channel (Figure 5A and D). Following treatment with fluorescence-labeled PTX, the intracellular fluorescence intensity was significantly increased in 2 samples (P < .01), which indicated that they were sensitive to chemotherapy (Patient Nos. 2 and 6), whereas the fluorescence intensity of the other 2 samples was not accumulated only if the P-gp inhibitor was provided and the case was determined as MDR (Patient Nos. 1 and 4) (Figure 5B, C, E, and F). The predictions from these CTCs were consistent with the patient's clinical response to chemotherapy (Table 1).
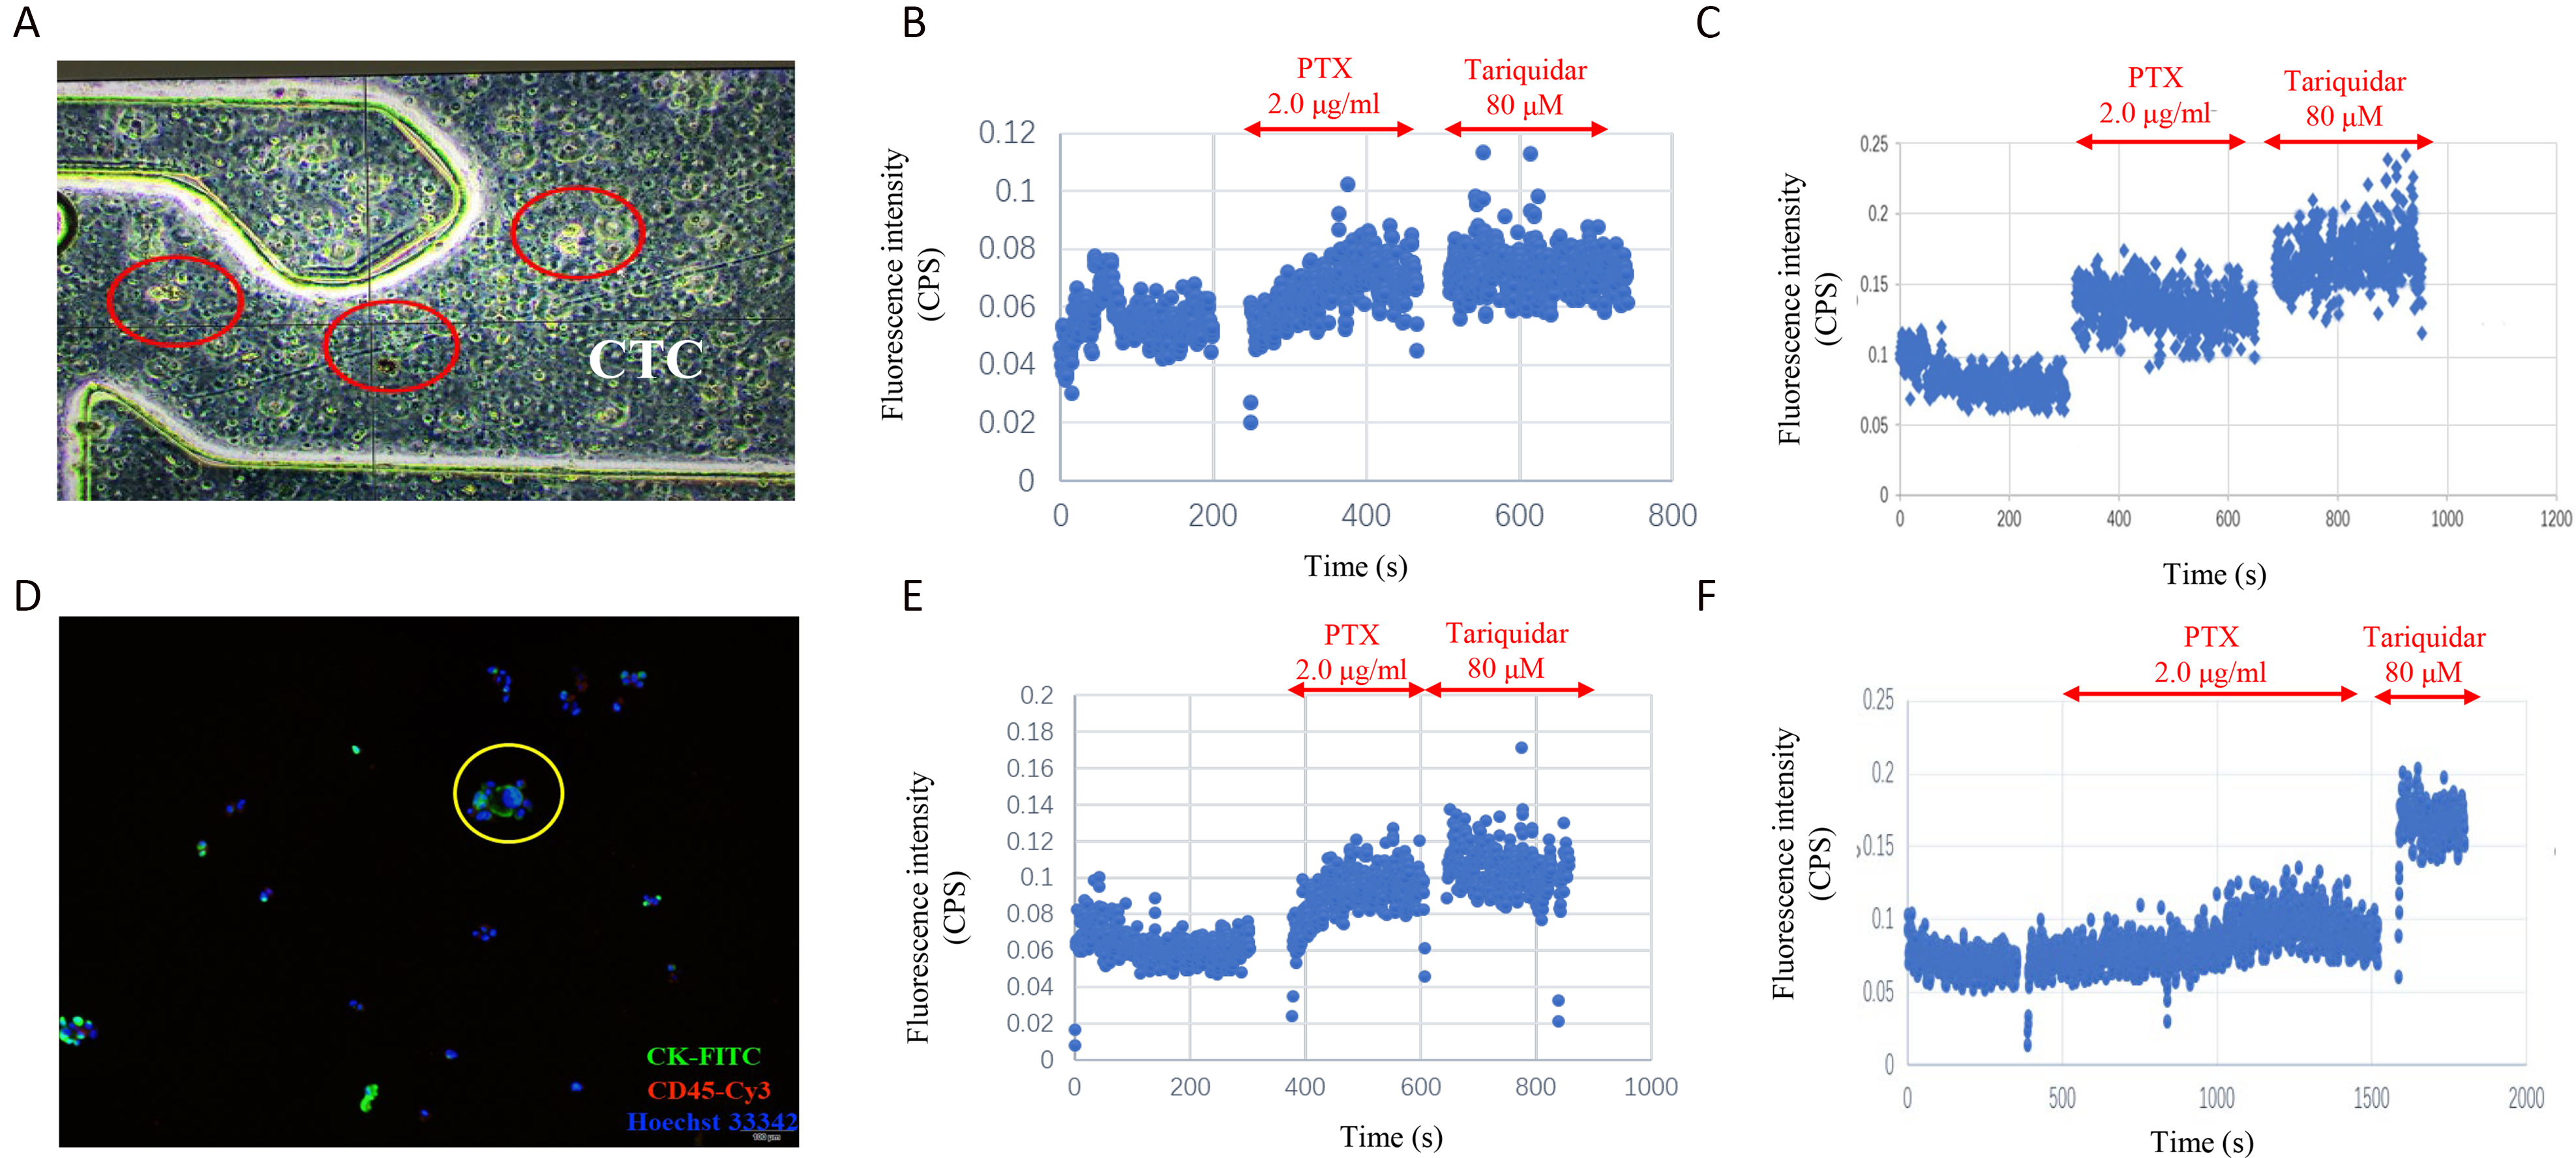
The SCB can be used to predict the patient's response to chemotherapy. (A) CTCs were retained in the microfluidic channel. (B) CTCs were extracted from whole blood. The intracellular fluorescence intensity was significantly increased (P < .01), which indicated that they were sensitive to chemotherapy (Patient No. 2). (C) CTCs were extracted from whole blood, whereas the fluorescence intensity was not accumulated only if the P-gp inhibitor was provided and the case was determined as MDR (Patient No. 1). (D) CTCs were captured from peripheral blood and imaged under a fluorescent microscope. (E) CTCs were extracted from pleural effusion and the intracellular fluorescence intensity was significantly increased (P < .01), which indicated that they were sensitive to chemotherapy (Patient No. 6). (F) CTCs were extracted from pleural effusion and the fluorescence intensity was not accumulated only if the P-gp inhibitor was provided and the case was determined as MDR (Patient No. 4).
Predicted Versus Observed Drug Sensitivity for the Patients Studied Using Samples Obtained From the Blood of Pleural Effusion.

Abbreviation: TNM, tumor node metastasis; PFS: progression-free-survival.
Expansion of the Utilization of the Prediction Platform for Chemotherapy Sensitivity of Patients With Breast Cancer
To better explain and expand the utilization of SCB technology in guiding clinicians toward the rational use of chemotherapeutic drugs, 17 blood samples from patients diagnosed with breast cancer were retrieved from Zhuhai Hospital of Traditional Chinese and Western Medicine. CTCs were collected and assessed by the SCB. CTCs from these 8 patients with breast cancer were predicted to be moderately sensitive to fluorescent PTX (Figure 6A). Administration of the P-gp inhibitor did not increase the drug accumulation in cancer cells. By contrast, the fluorescent intensity of these 9 CTC samples was significantly increased (P < .05), suggesting that the patients with breast cancer may be sensitive to chemotherapeutic drugs or directly treated with them (Figure 6B). This result indicated that patients with breast cancer could have a certain degree of resistance to chemotherapeutic drugs and that P-gp inhibitors could be used in combination in the clinic.

Prediction platform for the sensitivity to chemotherapy of patients with breast cancer (n = 17). (A) CTCs (n = 8) from patients with breast cancer were sensitive to chemotherapy (PTX), and the P-gp inhibitor could not increase the accumulation of PTX in cancer cells. (B) The fluorescent intensity of these 9 CTC samples was significantly increased (P < .05), suggesting that the patients with breast cancer may be sensitive to chemotherapeutic drugs. The statistical analysis of data was performed by the t-test.
Discussion
Cancer is one of the leading causes of death worldwide and >90% of cancer-related mortality is attributed to cancer metastasis. However, the current methods of tissue biopsy increase the risk of tumor metastasis.27,28 Liquid biopsies are emerging as a favorable alternative to conventional tissue biopsies, providing a noninvasive approach to detecting and monitoring cancer biomarkers. Liquid biopsies, comprising the noninvasive analysis of CTCs, represent an exciting tool in precision oncology and can be used to overcome the current limitations of tissue biopsies. 29 CTCs are a population of tumor cells that have detached from the primary tumor and can be found in the peripheral blood of the patients. The proof of the suitability of CTCs as a cancer biomarker originated with the identification of KRAS gene mutations in CTCs from the blood of patients with lung cancer. A luminescent agent with aggregation-induced emission activity, called tetraphenylethene and pyridinium (TPN), has been developed, which uses TPN labeling to identify rare tumor cells in pleural effusion samples of tumor patients. All pleural effusions of patients with tumors can also be used as part of a liquid biopsy. 30 Therefore, CTCs are rare tumor cells that have been studied as diagnostic, prognostic, and predictive biomarkers in several types of cancer. This allows us to predict in advance whether patients with tumors are resistant to chemotherapy.
This technology can currently monitor the treatment process of chemotherapeutic drugs for specific cancer cells, reduce costs, and provide personalized treatment plans for patients (Figure 7). In the present study, the A549 cell line and the A549T cell line were used to determine whether SCB could accurately predict the sensitivity of nonsmall lung cancer cells to chemotherapy. Furthermore, the experiments of mixing tumor cell lines and blood samples indicated the possibility of extracting CTCs in vitro. In addition, CTCs from 6 patients with lung cancer were used. The patients were recruited from the Kiang Wu Hospital of Macau and 3 of them provided peripheral blood CTCs, whereas the remaining 3 provided pleural effusion CTCs. The present study accurately predicted the response of 4 patients to chemotherapeutic drugs. However, 2 predicted sensitive samples did not yield consistent results with the resistance outcome (Patient Nos. 3 and 5). This discrepancy may be because only 1 SCB test was performed on each patient sample. A higher number of SCB tests performed on the same patient cells would ensure additional MDR cells and the correct resistant prediction. However, for further studies, we will collect more lung cancer cases to establish a prediction platform for the chemotherapy sensitivity of lung cancer patients. Finally, the CTCs of 17 patients with breast cancer diagnosed at Zhuhai Hospital of Traditional Chinese and Western Medicine were assessed. The results indicated that 9 patients were sensitive to chemotherapeutic drugs, 8 patients were resistant to a certain degree, and only 1 was completely resistant to chemotherapy. However, since the prognosis of patients with breast cancer requires a minimum observation period of 2 years, it is not clear whether the prognosis of these patients is consistent with our prediction.

Schematic representation of a proposed workflow for the diagnosis and treatment using the single-cell bioanalyzer (SCB).
Conclusion
In conclusion, the data of the present study indicated that the SCB technology could be used as a prognostic assay to evaluate the CTC response to available drugs and guide physicians to treatment options that are most likely to be effective.
Footnotes
Abbreviations
Declaration of Conflicting Interests
The author(s) declared no potential conflicts of interest with respect to the research, authorship, and/or publication of this article.
Funding
The author(s) disclosed receipt of the following financial support for the research, authorship, and/or publication of this article: The project was financially supported by the Faculty of Health Sciences, University of Macau. This work was supported by Macao Science and Technology Development Fund (Project Nos. 0096/2018/A3, 0111/2020/A3, and 0056/2020/AMJ), the NSFC overseas and Hong Kong and Macao Scholars Cooperative Research Fund Project (Project No. 81828013) and funding from Macan Biotechnologies Limited.