
Abstract
Objective
Circulating tumor cells are complete tumor cells with multi-scale analysis values that present a high potential for lung cancer diagnosis. To enhance the accuracy of lung cancer diagnosis, we detected circulating tumor cells by the innovated conical micro filter integrated microfluidic system.
Methods
We recruited 45 subjects of study, including 22 lung cancer patients, 2 precancerous patients, the control group including 14 healthy participants, and 7 patients with lung benign lesions in this prospective study. We calculated the area under the receiver operating characteristic curve of circulating tumor cells, cytokeratin19 fragment, carcinoma embryonic antigen, squamous cell carcinoma, neuron-specific enolase, and their combination, respectively, while compared the circulating tumor cells levels between vein blood and arterial blood. A conical shape filter embedded in a microfluidic chip was used to improve the detection capability of circulating tumor cells.
Results
The study indicated that the sensitivity, specificity, positive predictive value, and negative predictive value of circulating tumor cells detection were 81.8%, 90.5%, 90.0%, and 82.6%, respectively. The circulating tumor cells level of lung cancer patient was significantly higher than that of the control group (P < .05). The area under the curve of circulating tumor cells, cytokeratin19 fragment, carcinoma embryonic antigen, squamous cell carcinoma, and neuron-specific enolase alone was 0.838, 0.760, 0.705, 0.614, and 0.636, respectively. The combination area under the curve of the 4 tumor markers (cytokeratin19 fragment, carcinoma embryonic antigen, squamous cell carcinoma, and neuron-specific enolase) was 0.805 less than that of circulating tumor cells alone. Together, the total area under the curve of circulating tumor cell and the 4 tumor markers were 0.847, showing the highest area under the curve value among all biomarkers. In addition, this study found that there was no significant difference in positive rate of circulating tumor cell between arterial and venous blood samples.
Conclusion
The circulating tumor cells detection technology by conical micro filter integrated microfluidic could be used for lung cancer diagnosis with high sensitivity and specificity. Complementary combination of circulating tumor cells and conventional 4 lung cancer markers could enhance the clinical application accuracy. Venous blood should be used as a routine sample for circulating tumor cells detections.
Introduction
Lung cancer is the leading cause of cancer death worldwide, with an estimated 1.8 million deaths in 2020. 1 The majority of patients are diagnosed at an advanced stage with limited effective treatment and survival rates. Early diagnosis of lung cancer as the key to reduce mortality with a greater chance of cure, needs improved sensitive, specific, and effective detection method. 2 At present, due to the lack of reliable method, the early diagnosis rate of lung cancer patients is only about 10% to 15%. 3 Low-dose computed tomography (LDCT) has been considered as an effective way for screening and early diagnosis, which could decrease the mortality of lung cancer by 20%. 4 However, at the same time, the false positive rate of LDCT was found to be as high as 96.4%. 5
Quantifying circulating tumor cells (CTCs) has recently emerged as a major potential biomarker of diagnosis, evaluation of treatment effect, and prognosis in some cancers including lung cancer. 6 One study has confirmed the correlation between CTCs and lung malignant nodules and the detection of lung diseases by CTCs may be 1 to 4 years earlier than the imaging examination. 7 Studies found that CTCs were present in the peripheral blood (PB) at the early stage of tumor formation, suggesting that CTCs detection has potential value for the early diagnosis of lung cancer.7–9 CTC is recommended as a vital indicator and breakthrough in the early diagnosis of lung cancer. 10
The CellSearch System (Veridex) is the pioneer in developing a standardized commercial system for CTCs detection, which has obtained the approval from the US Food and Drug Administration (FDA) for providing CTC enumeration tests in advanced breast, prostate, and colon cancers.11,12 However, the study displayed that only 32% of patients (19/60) with advanced non-small cell lung cancer (NSCLC) had positive CTC counts at baseline by using CellSearch System. 11 Study revealed that, compared with CellSearch in lung cancer patients, higher positive rate was identified to capture by the size of epithelial tumor cells method. 13 However, small pore size of the filter will cause cell blockage. Pretreatment of blood samples is required before CTCs capture, including centrifugation and red blood cell lysis, which will bring inconvenience to clinical promotion. To improve flux and selectivity, a conical shape filter embedded in a microfluidic chip was previously developed by Tang et al. 14 This method demonstrates a high capture rate in blood samples of cancer patients without pretreatment. Based on the improvement of this technology, we continue to validate the value of CTC clinical application in lung cancer. This study aims to determine the accuracy and feasibility of this CTCs detection technology in the diagnosis of lung cancer.
Materials and Methods
Patients With Lung Cancer and Control Group
From April 2020 to September 2021, 60 participants blood samples were detected by the innovated conical micro filter integrated microfluidic system at Hebei Chest Hospital, Lung Cancer Prevention and Research Center of Hebei Province in this prospective study. Fifteen patients were excluded for the lack of pathology evidence and being breast, pancreatic cancer, and colon cancer patients. In the end, 45 study objects were enrolled in the study (Table 1). The inclusion criteria included: (1) lung cancer patients confirmed by histopathological or cytological and had not received antitumor therapy, (2) aged 18 years or older, and (3) regardless of gender. Excluded lung cancer patients were those who had received radiotherapy, chemotherapy, immunotherapy, and other antitumor treatments. Among the 45 study objects, 22 lung cancer patients confirmed by pathological result were enrolled in the experiment group (lung cancer group). These 22 patients were either NSCLC or small-cell lung cancer (SCLC). Fourteen healthy volunteers and 7 patients with lung benign diseases were recruited into the control group. In addition, 2 individuals were patients with precancerous lesions proven by pathology. Among the 22 patients with NSCLC and SCLC, venous and arterial blood samples were simultaneously collected from 20 of them to detect CTCs (Table 2). The status of disease of these 22 lung cancer patients was defined by pathology diagnosis, clinical feature, laboratory examination, and CT imaging according to the guidelines of the National Comprehensive Cancer Network. Seven patients with lung benign diseases include 1 Wegner's granuloma patient, 1 lung fungal infection patient, and 5 patients with pulmonary nodules. The healthy control individuals had no clinically detectable disease. The trial was approved by the Ethics Committee of Hebei Chest Hospital, and each subject signed an informed consent prior to study entry.
The Characteristics of Lung Cancer Group and Control Group.
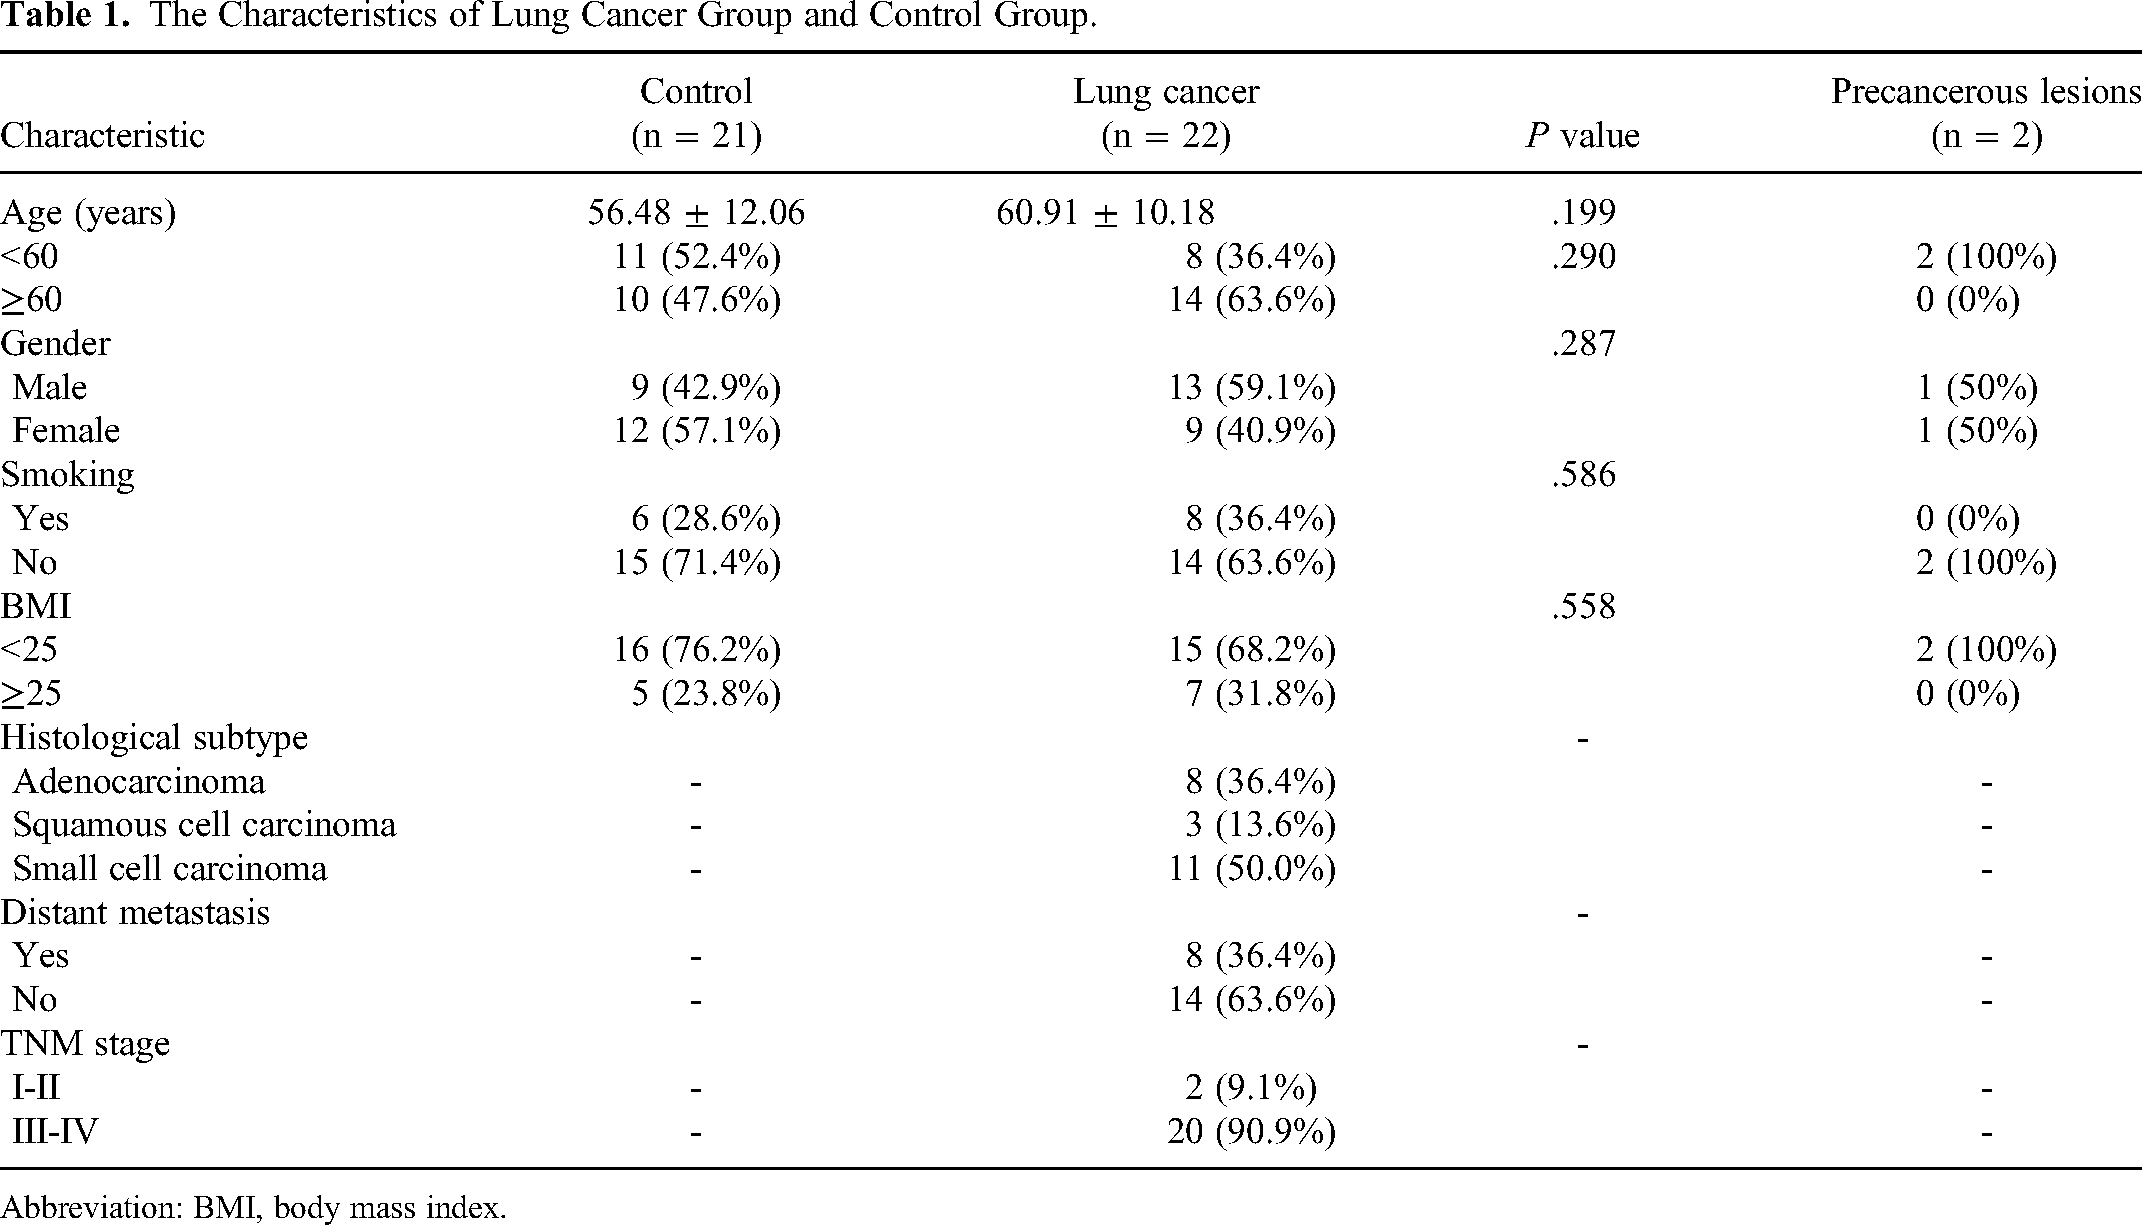
Abbreviation: BMI, body mass index.
Characteristics of the 20 Lung Cancer Patients Withdrawn Arterial and Venous Blood.
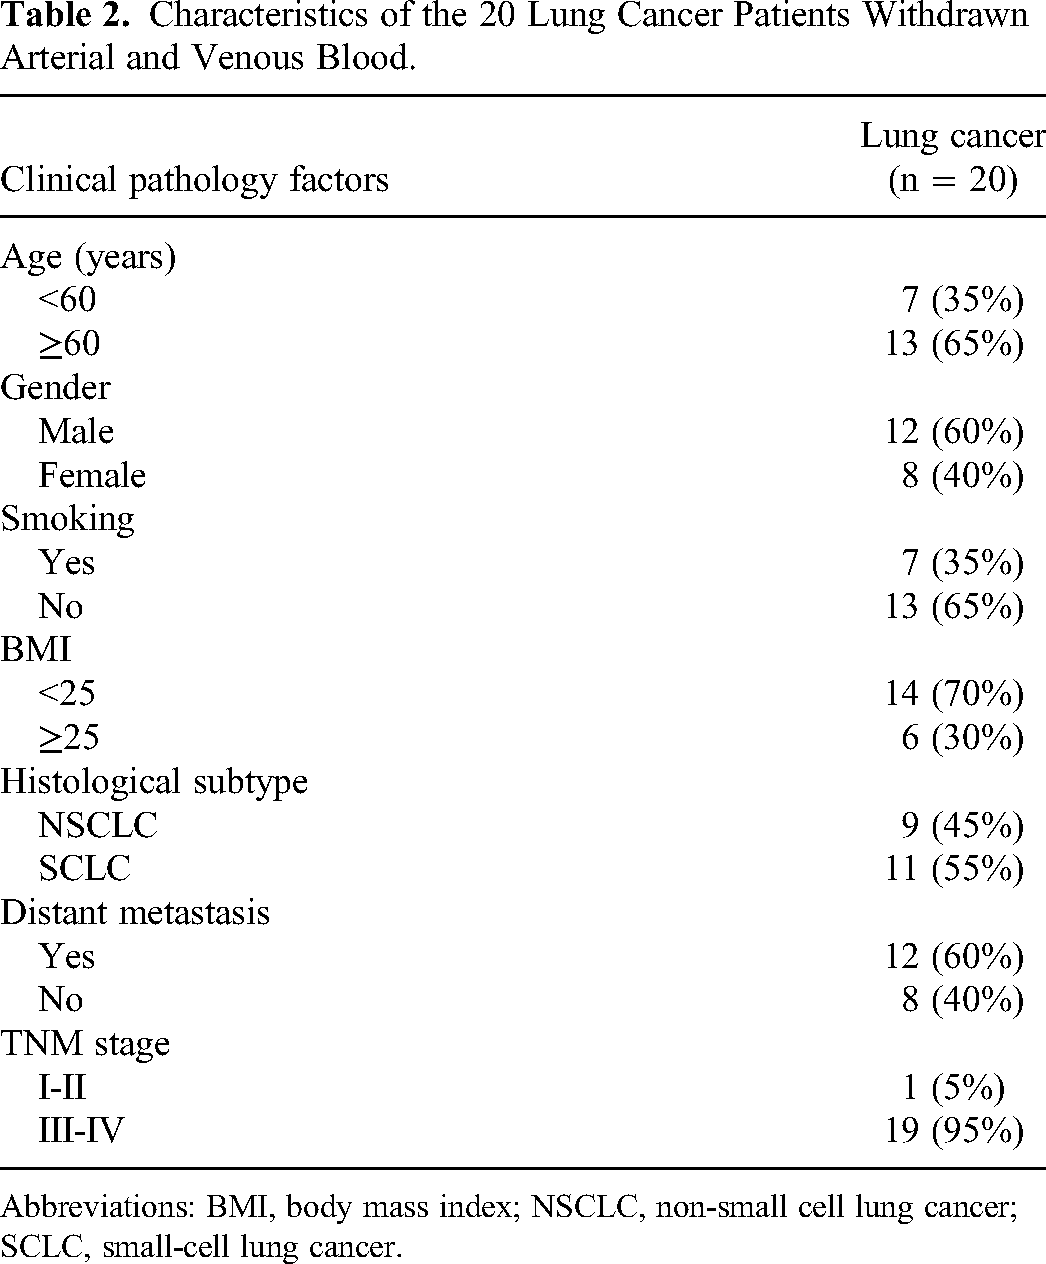
Abbreviations: BMI, body mass index; NSCLC, non-small cell lung cancer; SCLC, small-cell lung cancer.
Detection of Blood Specimens
To avoid contamination of epithelial cells, the first 2 mL of blood was discarded (both arterial blood and venous blood). Then, 5 mL PB samples were collected in the EDTA tubes (BD Diagnostics). Specimens were stored at 4 °C and were processed within 1 h. The 5 mL of blood samples from ante cubital vein were taken from all lung cancer patients, while blood samples from arteries were collected from only the 20 lung cancer patients at the same time while the vein blood was taken. Laboratory staff who performed CTCs detection were blinded to the clinical information of sample groups.
Detection of CTCs
CTCs were enriched by the tapered micro filter integrated in a microfluidic chip using automatic processing system (AF-RCF04, AnFang Biotechnology). The filter consists of micro holes arrays with equilateral triangle distribution. Different from traditional conical holes, holes on this filter were in form of conical shape with the big holes of 18 μm on the back side and small holes of 6.5 μm on the top side. The total number of holes is around 2 × 10⁵ (Figure 1). The filter was clamped on the microfluidic chip which contains 2 plastic plates with channels and chambers. A thin layer elastic film was assembled on the plastic plate to ensure a good seal without leakage during flow manipulation. The CTCs enriching process, from filtration to washing, was performed automatically by the system. Briefly, after installation of the whole device on the platform including tubing connection and blood samples reservoirs, 1 mL phosphate-buffered saline (PBS) was added into the reservoir which allows initial device wetting. During wetting stage, 5 mL of blood sample was diluted to 10 mL by mixing with 2 mL buffer solution and 3 mL PBS, which was incubated at room temperature for 8 min before loading. Then, following filtration, twice in washing steps with a flow rate of 500 µL/min, the diluted blood sample was added to the reservoir. Finally, the clamp was released, and the filter was taken out from the chip for later immunofluorescence staining and microscopy identification.

The schematic diagram of circulating tumor cell (CTC) capture and analysis process: (A) the membrane embedded in the microfluidic chip; (B) the membrane filter; (C) the scanning electron microscope of the filter; (D) Automatic filtration and staining platform (af-RCF04); (E) Upright fluorescence microscope; and (F) the CTC analysis system.
Immunofluorescence Staining and Identification of CTCs
The filter was inserted into another open chamber chip with the same configuration for immunofluorescence staining experiments. Firstly, the cells on the filter were prefixed with 4% paraformaldehyde in PBS for 10 min. Afterward, cells were blocked with 5% bovine serum albumin in PBS for 30 min. Then, they were incubated with a cocktail antibody solution mixed with Alexa Fluor 488-conjugated PanCK antibody diluted 1:500 (Abcam) and PE-conjugated anti-CD45 diluted 1:100 (Thermo Fisher) for 1 h. Finally, 2-(4-Amidinophenyl)-6-indolecarbamidine dihydrochloride (DAPI) was added to stain the cell nuclei. To identify and count the CTCs captured on the filter, the filter was mounted on the glass slide and analyzed with an automated Metafer CTC scanner. Automatic filter scanning, image processing of different fluorescence channel, cell classification, and statistical analysis were realized by multi algorithm defined including cell morphology, nuclei shape, and labeled fluorescence intensity. The identification standard of positive CTC in this method was defined as DAPI+/CD45−/CK+. Two associate professor pathologists reported these CTC results.
Cancer Markers Detection
Serum lung cancer markers were analyzed by an Elecsys immunoassay analyzer (Cobas e602; Roche Diagnostics). These markers include cytokeratin19 fragment (CYFRA21-1), carcinoma embryonic antigen (CEA), squamous cell carcinoma (SCC), and neuron-specific enolase (NSE). Two milliliter venous blood was collected to test these 4 markers. Levels at 3.3 ng/mL, 5.0 ng/mL, 2.7 ng/mL, and 22.0 ng/mL were considered as the upper limits of normality for CYFRA21-1, CEA, SCC, and NSE, respectively.
Statistical Analysis
Statistical analysis was performed with SPSS 22.0. T test, χ2 test, and Mann-Whitney U test were used for comparing values of a numeric outcome between groups and subgroups. A 2-tailed P value <.05 was considered statistically significant. A receiver operating characteristics (ROC) curve was used to decide the cutoff point of sensitivity and specificity, and the corresponding area under the curve (AUC) was calculated for each biomarker.
Results
Patient Characteristics
A total of 45 participants including 22 lung cancer patients, 7 patients with lung benign diseases, 14 healthy individuals, and 2 patients with precancerous lesions were recruited for CTCs examination. The subject characteristics are resumed in Table 1.
To evaluate the CTCs level in periphery arterial and venous blood, 20 patients among the 22 patients with lung cancer were involved. The clinical characteristics of these patients are presented in Table 2.
The correlation of CTCs, cancer biomarkers levels, and the clinical/pathologic characteristics of individuals was analyzed (Table 3). These characters include age at diagnosis (<60 years vs ≥60 years), sex (male vs female), history of smoking (Yes vs No), body mass index (<25 vs ≥25), histopathology subtype (NSCLC vs SCLC), distant metastasis (Yes vs No), and TNM stage (I-II vs III-IV). The results demonstrated that only the SCC level of patients with smoking and NSE level of patients with SCLC were higher than those with non-smoking and NSCLC (P < .05). There was no significant difference between other subgroups of lung cancer patients (P > .05).
CTC and Biomarkers Levels of Different Subgroups in Patients With Lung Cancer.

Abbreviations: BMI, body mass index; CTC, circulating tumor cell; CYFRA21, cytokeratin19 fragment; CEA, carcinoma embryonic antigen; SCC, squamous cell carcinoma; NSE, neuron-specific enolase; NSCLC, non-small cell lung cancer; SCLC, small-cell lung cancer.
Circulating Tumor Cell Counting and Cancer Biomarker Level Analysis
Table 4 presents the comparing results of average CTCs level and 4 cancer biomarkers (CEA, CYFRA21-1, SCC, and NSE) values between control group and lung cancer group. The mean level of CTCs in the control group and the lung cancer group were 0.24 and 11.18, respectively. Compared with healthy volunteers and patients with benign lung disease, the average CTC level was significantly higher in patients with lung cancer (P < .01). The results also show that the average CEA and CYFRA21-1 levels in control group were much lower than that in lung cancer group (P < .01). For SCC and NSE, there was no significant difference between the 2 groups (P > .05).
Comparison of CTC and Biomarkers Between the Control Group and the Experiment Group.
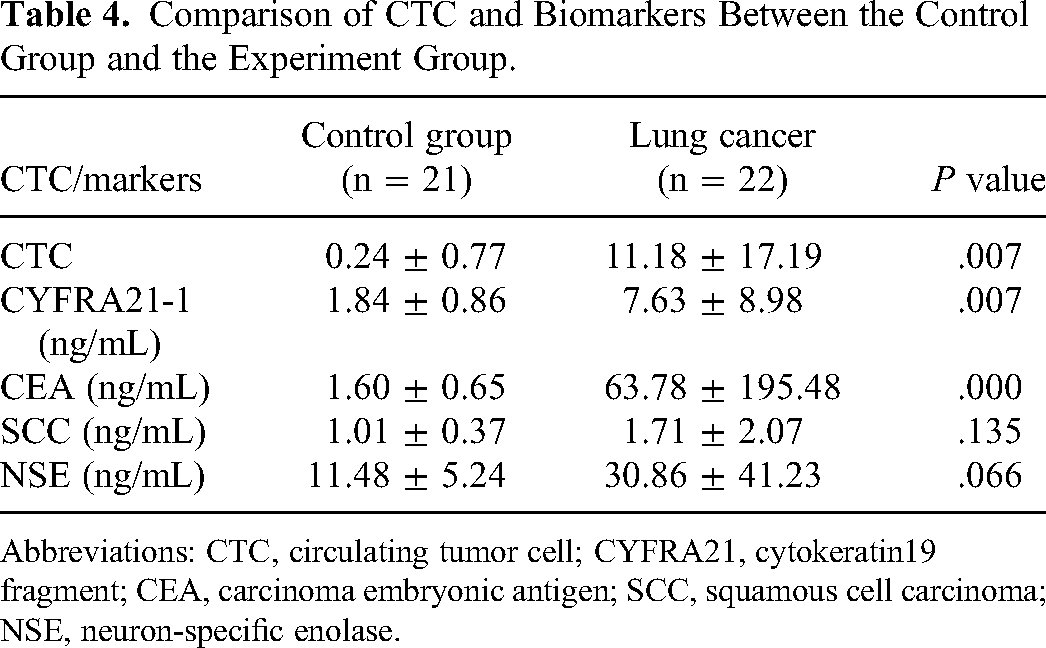
Abbreviations: CTC, circulating tumor cell; CYFRA21, cytokeratin19 fragment; CEA, carcinoma embryonic antigen; SCC, squamous cell carcinoma; NSE, neuron-specific enolase.
Comparison ROC Curves of CTC and Cancer Markers
The ROC was plotted to determine the efficiency of CTC. Four cancer biomarkers and combination of CTC with cancer biomarkers in lung cancer diagnosis are illustrated in Figure 2.
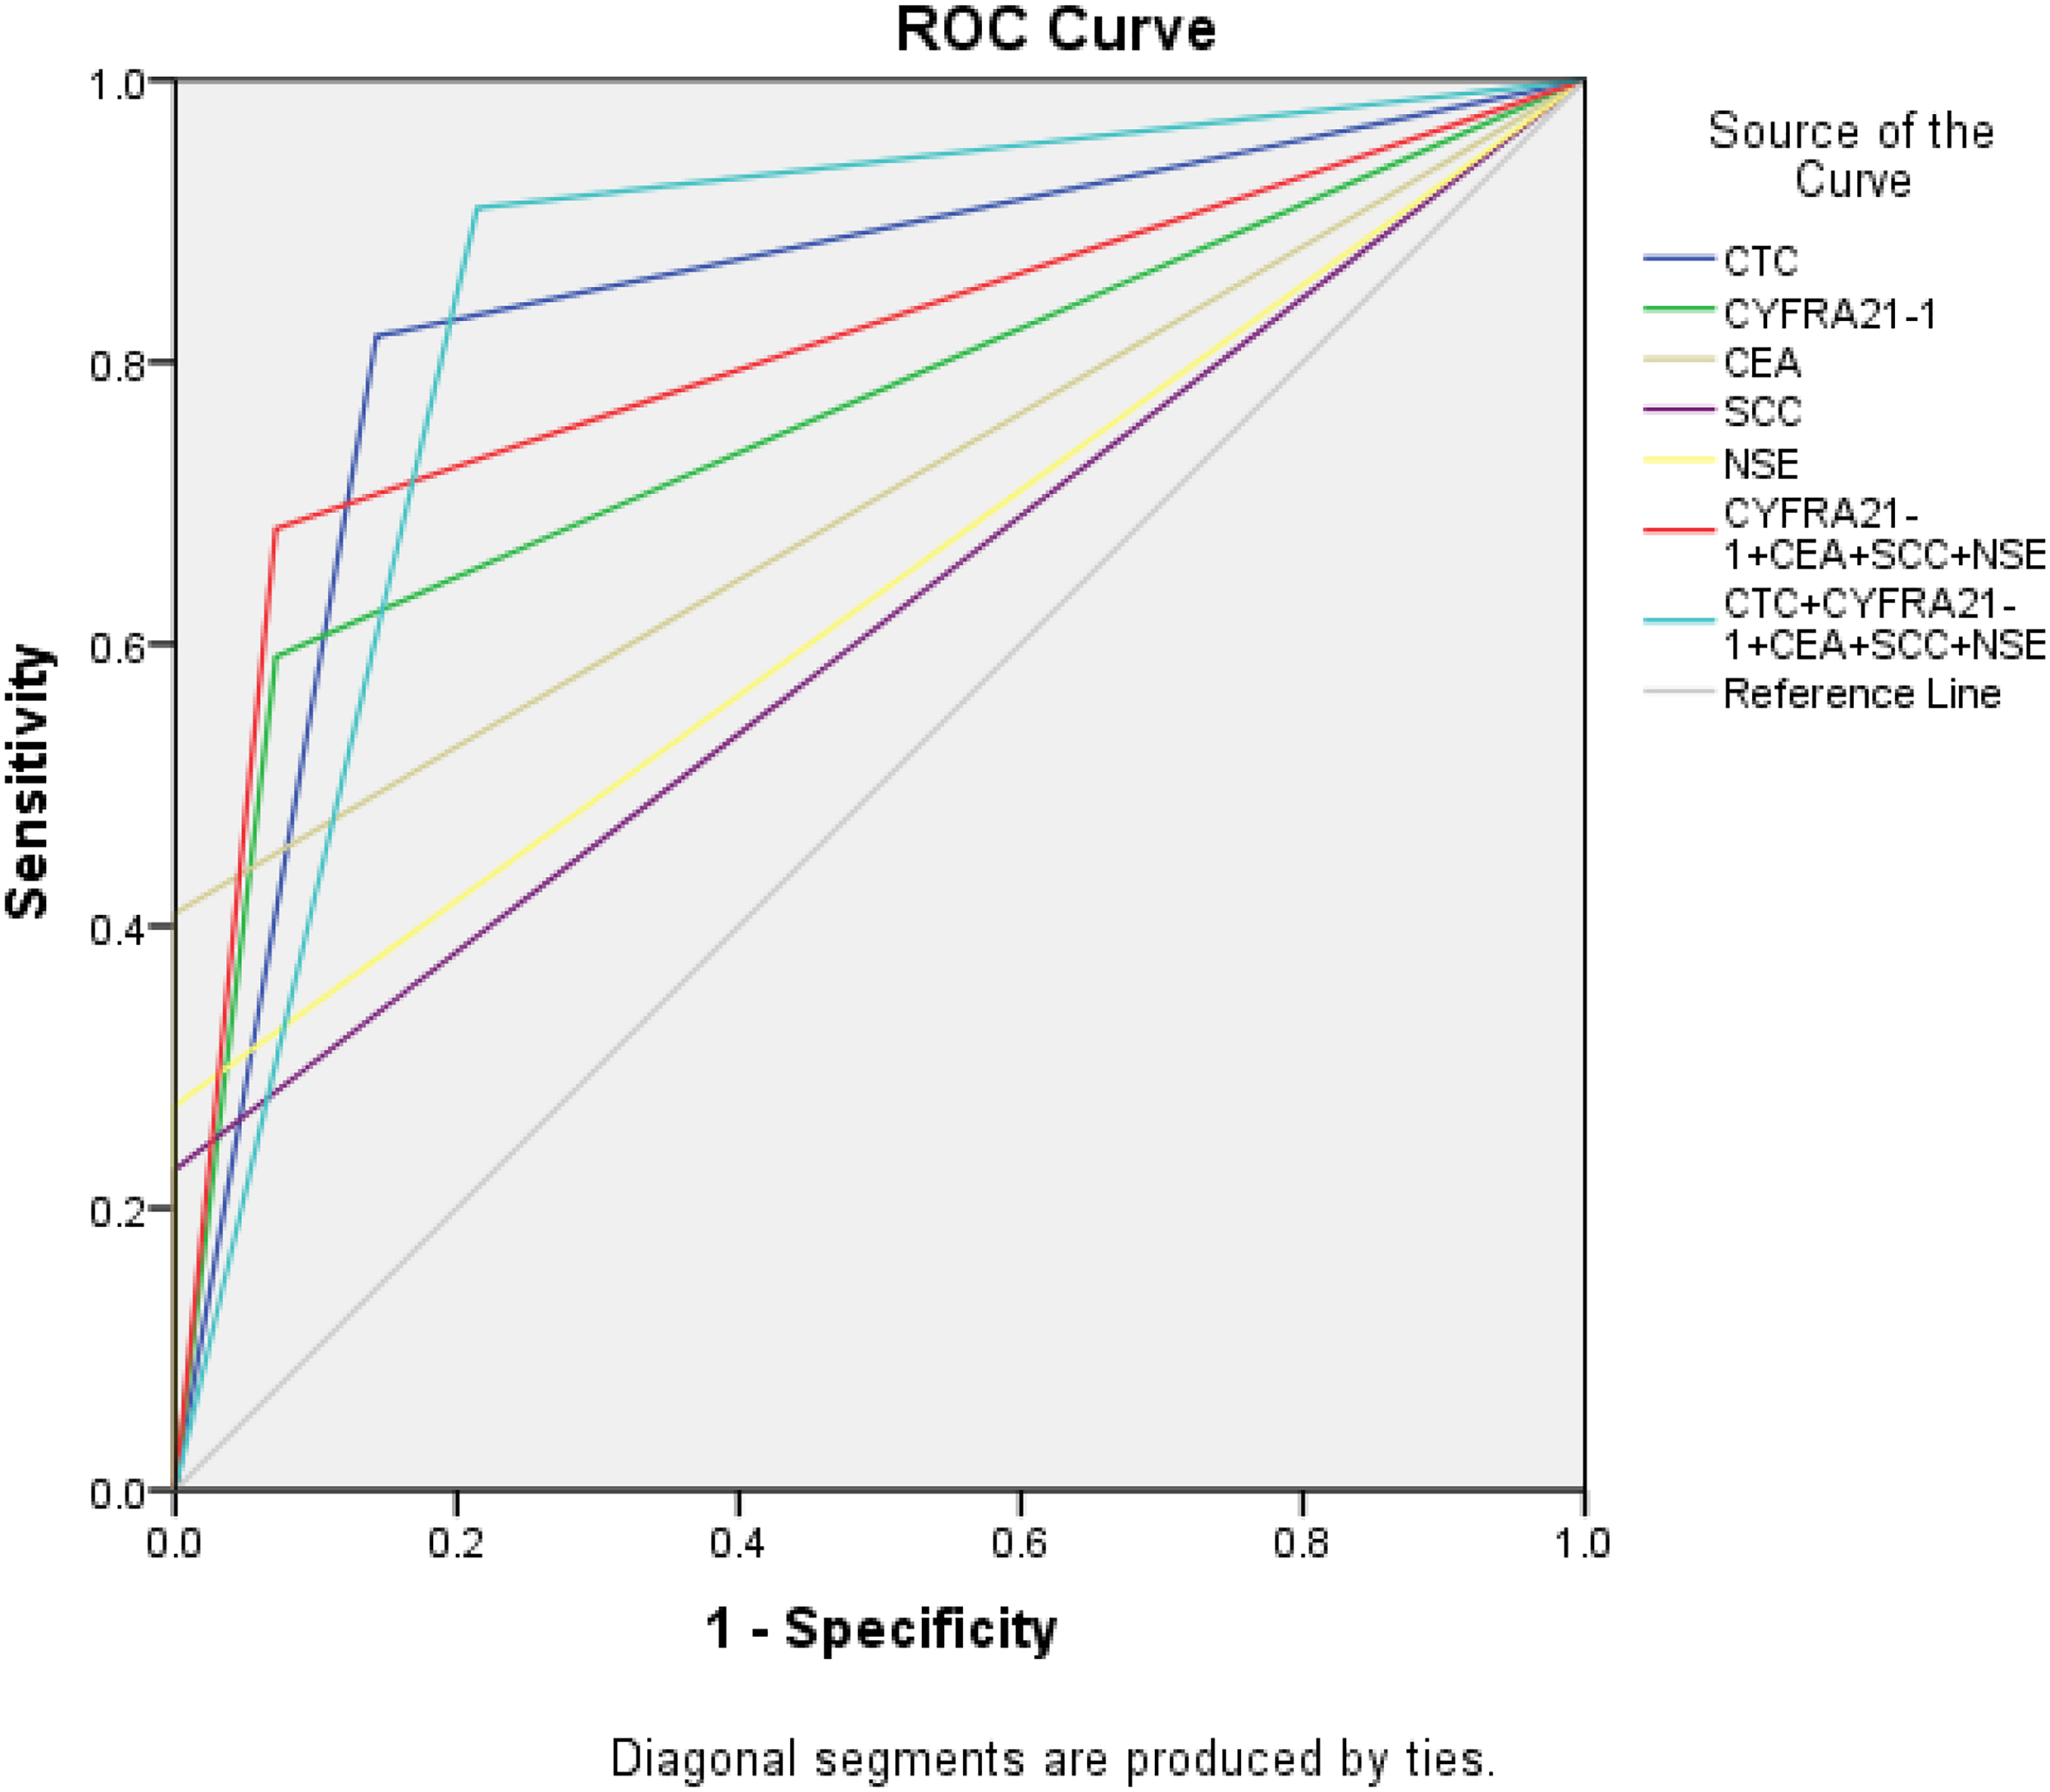
Receiver operating characteristic (ROC) curves of circulating tumor cell (CTC), tumor markers, combination tumor markers, combination of CTC, and these markers.
We determine that the area under the ROC curve of CTC, CYFRA21-1, CEA, SCC, and NSE are 0.838 (95% CI, 0.695-0.981), 0.760 (95% CI, 0.601-0.918), 0.705 (95% CI, 0.537-0.872), 0.614 (95% CI, 0.430-0.797), and 0.636 (95% CI, 0.457-0.816), respectively. The AUC of the 4 cancer markers combination was higher than that of each single biomarker, but it was lower than the AUC value of CTC. It was found that the AUC of CTC and the 4 biomarkers combination is 0.847, the highest among all these AUC values. The detailed values of the sensitivity, specificity, positive predictive value, and negative predictive value of the lung cancer biomarkers and CTCs are shown in Table 5. The cutoff value between control group and lung cancer patient group is 0.5 CTC units. The sensitivity, specificity, positive predictive value, and negative predictive value of the current CTCs detection method are 81.8%, 90.5%, 90.0%, and 82.6%, respectively. It reveals that this CTCs detection technology could be more accurate than the conventional cancer biomarkers. In addition, CTCs screening could be added with the 4 biomarkers detections to enhance the clinical significance of lung cancer diagnosis.
Comparison of CTC and Clinical Biomarkers.

Abbreviations: AUC, area under the curve; CTC, circulating tumor cell; CYFRA21, cytokeratin19 fragment; CEA, carcinoma embryonic antigen; SCC, squamous cell carcinoma; NSE, neuron-specific enolase.
Comparison of CTC Levels Between Arterial and Venous Blood Samples
The major disadvantage of CTCs technology is that very low numbers of CTCs could be detected in most of the clinical metastatic cancer. It is suspected that CTCs might have been sequestered or destroyed while circulating in the bloodstream. To explore the possibility to capture more CTCs and increase the sensitivity of current method in lung cancer diagnosis, 2 different blood sources (venous blood and arterial blood) from the same patient with the same volume were processed to compare at the same time. Our result revealed that the average CTC count within arterial blood was 6.80 ± 13.18, and it was 12.10 ± 17.80 within the vein specimen. There was no significant difference between the 2 different blood samples (P > .05). The CTCs positive rate of arterial blood and venous blood was 70.0% and 80.0%, respectively. Figures 3 to 4 presented the fluorescence image of the CTCs captured through arterial blood and venous blood from 12 lung cancer patients and 8 health volunteers. Figure 3 presented the fluorescence image of the CTCs and white blood cells captured in arterial blood and venous blood from 12 lung cancer patients. Figure 4 showed the fluorescence image of some white blood cells captured in venous blood of 8 health volunteers. No CTCs were found in the vein blood of the health participants. In addition, we found that there was no significant difference neither in CTCs morphology nor fluorescence intensity between venous and arterial blood in cancer patients.

Fluorescence-stained circulating tumor cells in arterial blood and venous blood. Blue is cell nucleus of circulating tumor cells and white blood cells. Green is cytoplasm of circulating tumor cells. Red is cytoplasm of white blood cells.

Fluorescence-stained white blood cells in venous blood. Blue is cell nucleus of white blood cells. Green is cytoplasm of circulating tumor cells. Yellow is cytoplasm of white blood cells.
Discussion
The clinical significance of “liquid biopsy” has now been widely recognized, because of their capability for noninvasive detection and their flexibility for real-time monitoring of the status of patients. Among liquid biopsy technology, CTCs detection method presents noticeable advantages when compared with ctDNA and exosome diagnosis. It allows characterization of complete cancer cells at a different scale from genomics to proteomics. It could be also applied to build in vitro cancer metastasis model which could be expected to accelerate drug development. However, there are still a lot of challenges in CTCs isolation such as the difficulties to enrich the CTCs, the capabilities to capture different subtype CTCs, etc. For instant, only the CellSearch System has been approved by the FDA which can provide CTCs enumeration and applied CTCs level as prognostic value for advanced colon cancers, breast, and prostate cancers. 12 However, the principle of CTCs enumeration of CellSearch system relies on the cancer cells recognition of epithelial markers such as EpCAM. In most of the cancer metastasis phase, CTCs may lose these epithelial markers during epithelial-to-mesenchymal transition.15,16 This leads to the low positive rate of CellSearch System. 12 Previous study has also demonstrated that folate receptor (FR) expression was upregulated in about 75.7% NSCLC patients, especially lung adenocarcinoma. 17 It is reported that FR±CTC could enable lung cancer diagnosis with a sensitivity of 77.7%, specificity of 89.5%, and AUC value of 0.796 (95% CI, 0.721-0.871), respectively. It also has been proved that the combination FR±CTC with NSE, CEA, and CYFRA21-1 had a higher AUC value (0.827, 95% CI, 0.760-0.893) than that of CTC alone. 18 Another strategy is based on the isolation by size technology (ISET), which is nonepithelial surface marker dependent. Previous studies revealed that a higher positive rate and more CTCs counts could be achieved comparing with CellSearch for lung cancer diagnosis.13,19
In this study, the CTCs enrichment was performed with a technology based on the isolation of CTC by size. Different from other ISET technology, a specific filter of conical holes was developed which allows isolating of different types of CTCs with high sensitivity and removing most of the blood cells with high throughput and minimum white blood cells contamination. In addition, microfluidic technology has been introduced for multi samples automatic processing with high-precision flow control. The automatic system can also eliminate the instability caused by human factors due to the complexity of CTCs enrichment process from isolation to staining. Our result displayed that the CTCs level of lung cancer group was significantly higher than control group (P < .05), which is coincident with previous studies.18,20,21 The accuracy of the CTC detection in the diagnosis of lung cancer is higher than the combination of cancer biomarkers in clinical application (such as CEA, SCC, NSE, CYPFRA21-1, and CA125).18,21 The AUC value by a combination of CTCs and lung cancer biomarkers is higher than CTC characterization alone, showing consistency with previous studies.18,21 The consistency between ours and previous studies prompts that CTCs detection by this method presents a high potential for lung cancer diagnosis, and the complementary combination of CTCs with lung cancer biomarkers could enhance the clinical application accuracy in clinical application.
The early detection of CTCs could play an important role in cancer screening. Previous studies have demonstrated that the sensitivity of CTCs detection in colorectal cancer and its precancerous lesions is as high as 88.0% and CTCs can be detected in 10% to 30% of patients with early breast cancer.22,23 It is worth pointing out that 2 CTCs were captured in one of the 2 patients with lung precancerous lesions in our prospective study. The positive rate is 50% in lung precancerous disease. This indicates the possibility of capturing CTCs in the PB of patients with early-stage lung cancer or lung precancerous lesions. The image magnification is slightly lower and has certain limitations. We will improve the image magnification in the future and conduct further clinical studies with a large number of cases to lay a foundation for clinical application in future study.
The quantity of CTCs isolated is one the most important factors to increase the credibility and stability of clinical application of CTCs technology, especially for future early cancer diagnosis. One study shows that the number of CTCs captured in arterial blood is higher than in venous blood. 24 Hence, we try to evaluate the necessity of CTC detection with arterial blood in contrary to routine venous samples. However, our result demonstrated that there was no significant difference in positive rate of CTCs between arterial and venous samples (P > .05), which was inconsistent with Terai's result. 24 The result difference may be related to different detection methods and small sample size in these 2 studies (20 vs 17). It may be necessary to enlarge the sample size and conduct a multicenter trial with an extensive investigation on whether there are more CTCs in arterial blood than in venous blood on some theory basis. Now, it is not recommended to routinely collect arterial blood instead of venous blood for CTCs detection.
In conclusion, CTCs detection approach using the conical micro filter integrated microfluidic method could be used for lung cancer diagnosis with high sensitivity and specificity. In lung cancer clinical application, the combination of CTCs with lung cancer markers could improve the diagnostic accuracy. Further investigation on the potential value of CTC in early diagnosis of lung cancer is required.
Footnotes
Abbreviations
Acknowledgments
This work was supported by the Finance Department and Health Commission of Hebei Province (Grant NO. 2019061438). The authors also acknowledge professors Guiyun Zhu and Na Wang for the coordination of CTC detection and statistical analysis in this study, respectively.
Authors’ Note
The study was conducted in accordance with the Declaration of Helsinki and approved by the Ethics Committee of Hebei Chest Hospital (protocol code 2021023 and April 9, 2021). Informed consent was obtained from all subjects involved in the study.
Author Contributions
Conceptualization, S.G. and S.W.; methodology, P.H. and N.C.; software, N.C.; validation, S.G., W.G., and S.W.; formal analysis, W.G.; investigation, S.G. and J.C.,; resources, X.W., C.L., Y.W., J.W., W.W., J.M., Y.Z., and P.H.; data collection, P.H. and S.G.; writing- original draft preparation, S.G. and J.C.; writing - review and editing, S.G., W.G., and S.W.; visualization, S.G., and W.G., ; supervision, S.G. and S.W.; project administration, S.G. and S.W.; and funding acquisition, S.G. and S.W. All authors have read and agreed to the published version of the manuscript.
Declaration of Conflicting Interests
The author(s) declared no potential conflicts of interest with respect to the research, authorship, and/or publication of this article.
Funding
The author(s) received no financial support for the research, authorship, and/or publication of this article.