
Abstract
Introduction
Diffuse large B-cell lymphoma (DLBCL) is a prevalent and aggressive non-Hodgkin Hodgkin's lymphoma (NHL) that accounts for 30% of all NHL cases. 1 Standardized rituximab-based treatment has significantly improved patient survival by affording complete remission rates of 75%-80% in patients with the primary disease. 2 However, there is considerable variability among individuals in terms of clinical signs, molecular and genetic factors, and treatment responsiveness. Therefore, approximately 30% of patients still experience drug resistance or relapse after treatment, 3 and the prognosis for these patients is extremely poor, with a 2-year overall survival (OS) rate of only 20%. 4 Early recognition and customized treatment approaches for patients with high-risk DLBCL are therefore crucial.
Currently, the International Prognostic Index (IPI) and the National Comprehensive Cancer Network (NCCN)-IPI are the primary tools for predicting the prognosis of DLBCL patients. These tools categorize patients into four risk categories based on five clinical parameters, including age, Ann Arbor stage, serum lactate dehydrogenase (LDH) level, extranodal involvement, and Eastern Cooperative Oncology Group performance status (ECOG PS).5,6 However, patients in the same risk stratification might have drastically different prognoses. 7 Several other significant elements, including pathological characteristics, genetic characteristics, and tumor microenvironment, also affect the prognosis of cancer patients in addition to the characteristics of the tumor.8,9 Although several prognostic biomarkers and genetic traits have been identified using immunohistochemistry or molecular technologies,10,11 their practical clinical applicability in underdeveloped countries is still limited due to the high cost and technical complexity of such testing. Therefore, it is essential to determine accurate, available, and cost-effective prognostic biomarkers for DLBCL patients in order to conduct an individualized risk assessment and personalized treatment guidance.
Recent research has shown that inflammation is a significant contributor to the initiation and progression of DLBCL.12,13 Inflammation provides nutrition for tumor cells, stimulates cell growth, and disrupts immune balance. 14 Some combination indices based on the number of circulating inflammatory cells have been developed and proposed as simple measures to assess systemic inflammation, of which the most often utilized were neutrophil-to-lymphocyte ratio (NLR), platelet-to-lymphocyte ratio (PLR), and lymphocyte-to-monocyte ratio (LMR). These variables have been found to have prognostic significance for various types of cancer, including DLBCL.15–17 Other variables such as the prognostic nutritional index (PNI), the Glasgow prognostic score (GPS), and the modified Glasgow prognostic score (mGPS) have been suggested to assess inflammation and nutritional status, and their prognostic value have been demonstrated in various types of cancer.18,19 The systemic immune-inflammation index (SII), a novel indicator that combines neutrophil, lymphocyte, and platelet counts, has been proposed in recent years. SII is thought to capture systemic inflammation more accurately, and its prognosis value is superior to traditional inflammatory parameters such as NLR, LMR, and PLR.20,21 Similarly, the systemic inflammatory response index (SIRI), which is calculated based on neutrophils, lymphocytes, and monocytes, has also been found to be associated with the prognosis of tumors. 22 Unfortunately, the reports of SII, PNI, GPS, and mGPS have been limited in patients with DLBCL, while the prognostic value of SIRI has not been reported.
Nomogram is a visual statistical model that uses known variables to predict clinical events. Each variable within the model corresponds to a specific score, and by summing up the individual scores, the total score is calculated. Subsequently, a function transformation relationship between the total score and the probability of the outcome event occurrence is utilized to compute the predicted value of an individual's outcome event. Although nomograms have been developed to predict the prognosis of various solid tumors,23,24 they are rarely employed in DLBCL. To address this gap, we comprehensively assessed the prognostic value of various inflammatory parameters and created a comprehensive and applicable nomogram model. We validated the prediction model utilizing both internal and independent external validation cohorts. The model utilizes baseline data before treatment, including hematological data and clinical characteristics, which are readily available. The model can be useful for clinicians in conducting initial survival evaluation of patients during diagnosis and developing an appropriate dosing regimen.
Materials and Methods
Patients
This retrospective study included a total of 423 patients from two tertiary hospitals. Among them, 325 DLBCL patients admitted to the Affiliated Hospital of Jiangnan University from January 2009 to December 2021 were divided into a training cohort and an internal validation cohort at a ratio of 7:3, consisting of 228 and 97 patients, respectively. Additionally, 98 DLBCL patients admitted to Wuxi People's Hospital Affiliated with Nanjing Medical University from January 2015 to December 2021 were used as an external validation cohort. We have de-identified all patient details. All of these patients received definitive chemotherapy, with some of them also undergoing radiotherapy or surgical treatment. The inclusion criteria were as follows: (a) a confirmed diagnosis of DLBCL based on typical immunophenotypic and histological features; (b) first-time diagnosis of DLBCL and no prior anti-tumor treatment; (c) received at least three cycles of chemotherapy; and (d) availability of complete baseline clinical data and follow-up data. The exclusion criteria included HIV positivity, acute or chronic inflammatory diseases, transformed indolent lymphoma, primary central nervous system lymphoma, primary mediastinal large B-cell lymphoma, and patients with a history of other tumors. In addition, patients with missing data or lost to follow-up during the study were also excluded from the analysis. According to Norman et al, 25 in retrospective studies, the minimum sample size required for conducting multivariate analysis should be at least 20 times the number of variables.
Data Collection
The electronic medical record system was used to gather the patients’ baseline clinical data. Patients’ hematological data included serum lactate dehydrogenase (LDH), serum β2-microglobulin (β2-MG), albumin, and C-reactive protein levels, and platelet, neutrophil, lymphocyte, and monocyte counts. The clinicopathological features of the patients included age, sex, Ann Arbor stage, B symptoms, bone marrow invasion, ECOG PS, site and the number of extranodal involvement, chemotherapy regimen, cells of origin, and immunological markers (BCL2, BCL6, and Ki-67). The monoclonal antibodies used in this study were anti-BCL2 (clone 124, DAKO, cut-off 50%), anti-BCL6 (clone LN22, DAKO, cut-off 30%), and anti-Ki67 (clone SP6, Abcam, cut-off 90%) antibodies. The results of all histopathological analyses were verified by two pathologists. Immunohistochemical labeling was used to classify cells as germinal center B-cell-like (GCB) or non-GCB according to Hans’ criteria. Risk stratification of patients according to IPI and NCCN-IPI. The full blood cell counts and laboratory data were obtained prior to the initiation of chemotherapy in the patients. The construction and best cut-off values for GPS, mGPS, NLR, PLR, LMR, SII, SIRI, and PNI are shown in Table 1.
Definition and Optimal Cut-Off Values of Inflammation Scores.

Follow-Up
Follow-up visits were scheduled every 3 months for the first 1–2 years after treatment, every 6 months in years 3–4, and annually after year 5. The routine follow-up investigations performed included physical examination, laboratory tests, ultrasound, and imaging (including CT and PET-CT). Patients who do not return to our hospital for a reexamination on time will be followed up by telephone. The study's endpoint event was OS, which was defined as the time between disease diagnosis and death from any cause or final follow-up. The deadline for the final follow-up was June 30, 2022.
Statistical Analysis
The optimal cut-off value for continuous variables is determined using the receiver operator characteristic (ROC) curve, and the continuous variables are converted into categorized variables to make the model more intuitive. The relationship between NLR, PLR, LMR, SII, SIRI, PNI, GPS, and mGPS and survival time was examined using the Kaplan Meier curve and compared using the log-rank test. The Spearman correlation coefficient is used to test the correlation between sequenced variables. 26 Categorical variables were reported as frequencies and percentages, and compared using the chi-square test or Fisher’ s exact test. Given the likelihood of multicollinearity, we used the “glmnet” package of R software to run the least absolute shrinkage and selection operator (LASSO) analysis to screen the most valuable indicators among all candidate biomarkers of inflammation. After then, the variables were entered into the multivariate Cox regression model to further select independent predictors. Variables that had a P-value of <.05 were enrolled into the nomograms. The nomogram predicting the 1-, 3-, and 5-year OS rates were developed using the rms package in R. The nomogram was used to convert the regression coefficient of each independent risk factor in multivariate Cox regression to a number on a scale of 0 to 100. The total point score for the predicted probability was calculated by adding the points for each independent variable. The Akaike information criterion (AIC) and Bayesian information criterion (BIC) were used to assess the model's goodness of fit. The concordance index (C-index) and area under the curve (AUC) of the ROC were used to compare the performance of the nomogram, IPI, and NCCN-IPI. Decision curve analysis (DCA) was performed to investigate the clinical value of the nomogram. A calibration curve with 1000 bootstrap resamples was utilized to display the agreement between predicted and actual survival probability. For statistical analysis, SPSS 25.0 (IBM, Chicago, IL, USA) and R software (version 4.1.3, http://www.Rproject.org) were used. The X-tile software 27 (version 3.3.1, Yale University, New Haven, CT, USA) was used to determine the optimal cut-off value of the nomogram score and divide the patients into low, medium, and high-risk groups. The Kaplan-Meier method was used to plot survival curves, which were then compared using the log-rank test.
Ethics Approval and Informed Consent
This study has been approved by the Ethics Committee of the Affiliated Hospital of Jiangnan University (APPROVAL NUMBER: LS2022037) and the Ethics Committee of Wuxi People's Hospital Affiliated with Nanjing Medical University (APPROVAL NUMBER: KY22101). Due to the study's retrospective nature, patients’ written informed consent was exempted.
Results
Patient Cohorts and Characteristics
From January 2009 to December 2021, a total of 650 patients with DLBCL were evaluated, of which 227 patients were excluded from the analysis, and 423 patients who met the inclusion criteria were included in the study. The training cohort, internal validation cohort, and external validation cohort consisted of 228, 97, and 98 patients, respectively. The study flow and patient selection process are shown in Supplemental Figure 1. In the training cohort, 140 patients (61.4%) were over 60 years old, 113 (49.6%) were female, 115 (50.4%) patients were in Ann Arbor stage III-IV, and 84 (36.8%) had elevated LDH levels. In the internal validation group, 54 (55.7%) patients were over 60 years old, 48 (49.5%) were female, 56 (57.7%) were in Ann Arbor stage III-IV, and 35 (36.1%) had elevated LDH levels. In the external validation cohort, 59 (60.2%) patients were aged over 60 years, 50 (51.0%) were female, 55 (56.1%) patients had Ann Arbor stage III-IV, and 35 (35.7%) patients had elevated LDH levels. The median follow-up time of the training set was 47 months (range: 4-109 months), and the OS rates of 1-, 3-, and 5-year were 83.7%, 72.7%, and 69.6% respectively; The median follow-up time of the internal validation set was 43 months (range: 4-110 months), and the OS rates of 1-, 3-, and 5-year were 78.4%, 69.7%, and 67.3% respectively; The median follow-up time of the external validation set was 44 months (range: 5-89 months), and the OS rates of 1-, 3-, and 5-year were 89.8%, 63.4%, and 53.9%, respectively. By the end of follow-up, 65 (20.0%), 28 (28.9%), and 36 (36.7%) patients died in the three cohorts, respectively. According to the ROC curve, the optional cut-off points of NLR, PLR, LMR, SII, SIRI, PNI, and β2-MG were 4.62, 192.06, 2.62, 1109.90, 1.50, 42.55, and 2.55, respectively. The baseline characteristics of patients in the training set, internal validation set, and external validation set were shown in Table 2.
Baseline Characteristics of Patients.

Abbreviations: LDH, lactate dehydrogenase; ECOG PS, Eastern Cooperative Oncology Group Performance Status; EN, extranodal; COO, cell of origin; GCB, germinal center B-cell-like; SII, Systemic immune-inflammation index; SIRI, System inflammation response index; PNI, Prognostic Nutritional Index; NLR, neutrophil to lymphocyte ratio; PLR, platelet to lymphocyte ratio; LMR, lymphocyte to monocyte ratio; GPS, Glasgow Prognostic Score; mGPS, modified Glasgow Prognostic Score; β-2 MG, β-2 microglobulin; IPI, International Prognostic Index; NCCN, National Comprehensive Cancer Network.
Correlation Between SII, PNI, and Clinicopathological Characteristics
According to the cut-off value, the SII was divided into a high SII group (SII ≥ 1109.90) and a low SII group (SII < 1109.90), and the PNI was divided into a high PNI group (PNI ≥ 42.55) and a low PNI group (PNI < 42.55). In the training cohort, patients with high SII had higher LDH levels (P = .031), and were more likely to have bone marrow invasion (P = .044), and higher IPI scores (P = .017); Patients with low PNI had higher LDH levels (P < .001), a later Ann Arbor staging (P < .001), more extranodal involvement (P = .005), higher β2-MG levels (P < .001), and are more likely to have B symptoms (P = .006), bone marrow involvement (P = .009), higher IPI scores (P < .001), and higher NCCN-IPI scores (P < .001). Both high SII and low PNI were also found to be associated with high NLR, high PLR, low LMR, high SIRI, high GPS, and high mGPS in the training cohort (all P < .001). In the internal validation cohort, patients with high SII had higher LDH levels (P = .036), more extranodal involvement (P = .003), higher IPI scores (P = .048), and higher NCCN-IPI scores (P = .045); patients with low PNI had higher LDH levels (P = .011), higher β2-MG levels (P = .006), higher IPI scores (P = .021), and higher NCCN-IPI scores (P = .033). High SII and low PNI were also found to be associated with high NLR, high PLR, low LMR, high SIRI, high GPS, and high mGPS in the internal validation cohort (all P < .05). In the external validation cohort, high SII was associated with high NLR (P < .001), high PLR (P < .001), low LMR (P = .032), and high SIRI (P < .001), and low PNI was associated with B symptoms (P < .001), high PLR (P = .002), high GPS (P < .001), and high mGPS (P = .012). The correlation between SII, PNI and clinicopathological characteristics are shown in Tables 3 and 4.
Comparison of Baseline Characteristics Between Different Groups of the Study Population Categorized by SII.
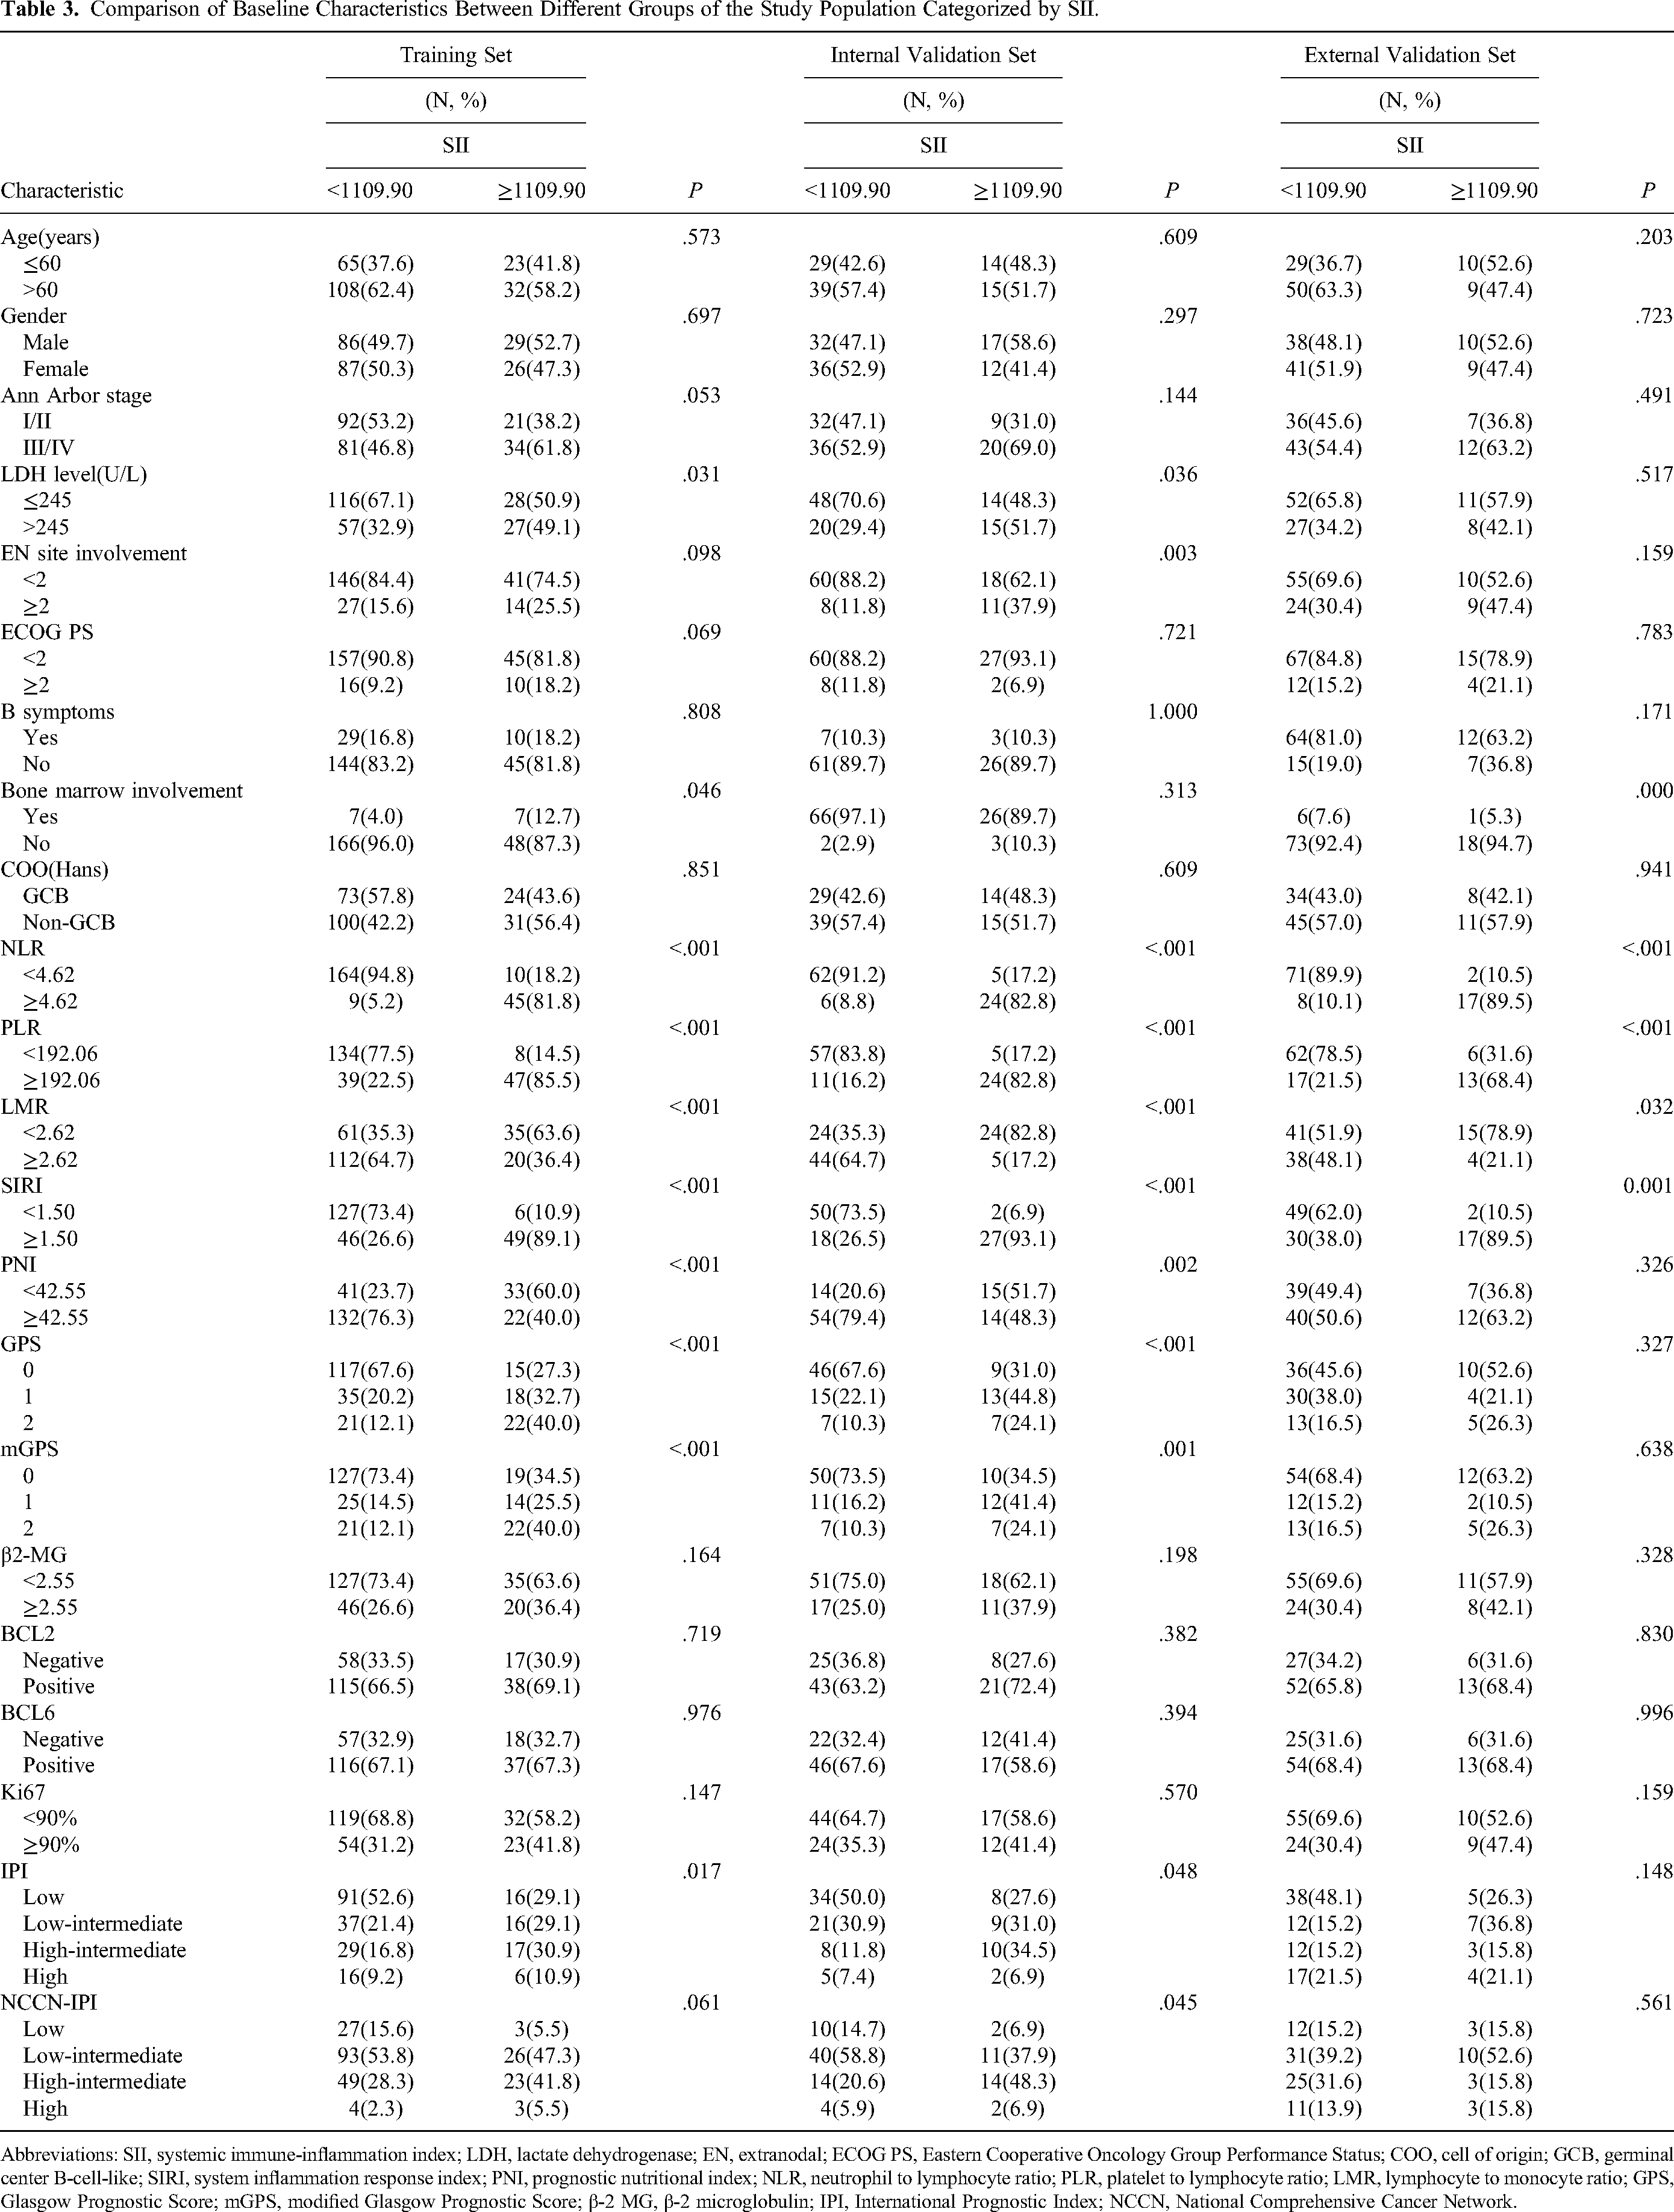
Abbreviations: SII, systemic immune-inflammation index; LDH, lactate dehydrogenase; EN, extranodal; ECOG PS, Eastern Cooperative Oncology Group Performance Status; COO, cell of origin; GCB, germinal center B-cell-like; SIRI, system inflammation response index; PNI, prognostic nutritional index; NLR, neutrophil to lymphocyte ratio; PLR, platelet to lymphocyte ratio; LMR, lymphocyte to monocyte ratio; GPS, Glasgow Prognostic Score; mGPS, modified Glasgow Prognostic Score; β-2 MG, β-2 microglobulin; IPI, International Prognostic Index; NCCN, National Comprehensive Cancer Network.
Comparison of Baseline Characteristics Between Different Groups of the Study Population Categorized by PNI.

Abbreviations: PNI, prognostic nutritional index; LDH, lactate dehydrogenase; EN, extranodal; ECOG PS, Eastern Cooperative Oncology Group Performance Status; COO, cell of origin; GCB, germinal center B-cell-like; SIRI, system inflammation response index; SII, systemic immune-inflammation index; NLR, neutrophil to lymphocyte ratio; PLR, platelet to lymphocyte ratio; LMR, lymphocyte to monocyte ratio; GPS, Glasgow Prognostic Score; mGPS, modified Glasgow Prognostic Score; β-2 MG, β-2 microglobulin; IPI, International Prognostic Index; NCCN, National Comprehensive Cancer Network.
The Relationship Between Systemic Inflammatory Markers and the Prognosis of Patients with DLBCL
Each inflammatory marker's prognostic value was assessed. The Kaplan-Meier curve in the training cohort revealed that NLR, PLR, LMR, SII, SIRI, PNI, GPS, and mGPS were significantly correlated with the OS of DLBCL patients (Figure 1A–H, P < .05). Similar results were found in the internal validation set (Supplemental Figure 2A–H, P < .05). While in the external validation set, patients with low LMR and high SIRI show a poor survival trend, although it is not statistically significant (Supplemental Figure 3A–H, P > .05). Then, we created a correlation matrix (correlation coefficient r, form −1 [red] to 1 [blue]) to better understand the relationship between the variables listed above. The results show that there is a strong correlation between some variables (r > 0.6, P < .001; Figure 2).

In the training cohort, the Kaplan–Meier curve of the overall survival (OS) rate of patients with diffuse large B-cell lymphoma (DLBCL) and the correlation coefficient matrix of various inflammatory indicators. (A–H) Kaplan–Meier curve of different levels of NLR, PLR, LMR, SII, SIRI, PNI, GPS, and mGPS; (I) Correlation matrix with correlation coefficients from −1 (negative correlation; red) to 1 (positive correlation; blue).

Selection of risk factors by the least absolute shrinkage and selection operator (LASSO) Cox regression analysis. (A) The LASSO coefficient profiles of the candidate predictors. (B) Tuning parameter (λ) selection in the LASSO model performed ten-fold cross-validation. (C) Forest plot of the multivariate Cox regression analysis of the training cohort. (D) Nomogram for predicting 1-, 3-, and 5-year OS.
Construction the Nomogram
The LASSO regression method is used to identify the best predictive factors. LASSO regression can handle the problem of overfitting the model and variable collinearity. 28 Using the 10-fold cross-validation, we determined the optimum LASSO model parameter (lambda). Using the minimum error criterion, with a lambda of 0.043, we screened 10 parameters which are important for DLBCL patients’ prognosis, including age, gender, Ann Arbor stage, LDH, ECOG PS, SII, PNI, bone marrow involvement, mGPS, and β-2 MG (Figure 2A and B). Then, based on the multivariate Cox analysis, six variables which show significance (P < .05) in the analysis were further screened, including age, ECOG PS, LDH, SII, PNI, and β-2 MG (Figure 2C). Based on these six variables, a nomogram for predicting the 1-, 3-, and 5-year survival rates of DLBCL patients were constructed (Figure 2D). The scores for each independent factor were added up to obtain the total score, which allowed the chance of survival at different time points to be calculated for each patient.
The Goodness-of-Fit and Performance of the Nomogram
The AIC and BIC were used to assess the nomogram's goodness-of-fit. In the training cohort, the AIC and BIC of the nomogram (AIC, 596.656; BIC, 609.702) were lower than the IPI (AIC, 627.159; BIC, 638.031) and NCCN-IPI (AIC, 627.783; BIC, 645.178), demonstrating that the nomogram's goodness-of-fit was greater. The C-index of the nomogram (0.804, 95% CI: 0.751-0.857) outperformed the IPI (0.690, 95% CI: 0.629-0.751) and NCCN-IPI (0.691, 95% CI: 0.632-0.750). The 1-, 3-, and 5-year calibration curves revealed a good agreement between the projected and actual OS (Figure 3A–C). The AUC for the nomogram predicting the 1-, 3-, and 5-year OS rates were 0.853 (95% CI: 0.778-0.927), 0.853 (95% CI: 0.789-0.917), and 0.845 (95% CI: 0.771-0.920), respectively, which were better than the corresponding values associated with the IPI (0.692, 95% CI: 0.604-0.780; 0.747, 95% CI: 0.672-0.822; and 0.750, 95% CI: 0.656-0.843) and NCCN-IPI (0.699, 95% CI: 0.612-0.785; 0.738, 95% CI: 0.666-0.810; and 0.749, 95% CI: 0.666-0.832; Figure 4A-C).

Calibration curve of the nomogram in different cohorts. Calibration curves for predicting 1-year (A), 3-year (B), and 5-year (C) OS in the training cohort; Calibration curves for predicting 1-year (D), 3-year (E), and 5-year (F) OS in the internal validation cohort; Calibration curves for predicting 1-year (G), 3-year (H), and 5-year (I) OS in the external validation cohort.

Receiver operating characteristic (ROC) curves verified the predictive value of nomogram, International Prognostic Index (IPI), and National Comprehensive Cancer Network (NCCN)-IPI in different cohorts. ROC curves of the nomogram, IPI, and NCCN-IPI predicting 1-year (A), 3-year (B), and 5-year (C) OS in the training cohort; ROC curves of the nomogram, IPI, and NCCN-IPI predicting 1-year (D), 3-year (E), and 5-year (F) OS in the internal validation cohort; ROC curves of the nomogram, IPI, and NCCN-IPI predicting 1-year (E), 3-year (F), and 5-year (G) OS in the external validation cohort.
In the internal validation cohort, the AIC and BIC of the nomogram (AIC, 225.807; BIC, 233.800) were lower than the IPI (AIC, 235.011; BIC, 241.672) and NCCN-IPI (AIC, 237.099; BIC, 247.757). The C-index of the nomogram (0.778, 95% CI: 0.702-0.854) outperformed the IPI (0.711, 95% CI: 0.637-0.785) and NCCN-IPI (0.685, 95% CI: 0.599-0.771). The nomogram's 1-, 3-, and 5-year OS calibration curves showed good calibration (Figure 3D-F). The AUC for the nomogram predicting the 1-, 3-, and 5-year OS rates were 0.873 (95% CI: 0.784-0.963), 0.793 (95% CI: 0.679-0.907), and 0.840 (95% CI: 0.729-0.950), respectively, which were better than the corresponding values associated with the IPI (0.844, 95% CI: 0.767-0.922; 0.715, 95% CI: 0.594-0.836; and 0.705, 95% CI: 0.566-0.843) and NCCN-IPI (0.711, 95% CI: 0.668-0.875; 0.734, 95% CI: 0.627-0.841; and 0.672, 95% CI: 0.528-0.816; Figure 4D-F).
In the external verification cohort, the AIC and BIC of the nomogram (AIC, 271.152; BIC, 280.653) were lower than the IPI (AIC, 276.617; BIC, 284.535) and NCCN-IPI (AIC, 277.548; BIC, 290.217). The C-index of the nomogram (0.799, 95% CI: 0.730-0.868) was superior to IPI (0.702,95% CI: 0.614-0.790) and NCCN-IPI (0.678,95% CI: 0.584-0.772). The calibration curve showed a good consistency between the predicted probability and the actual probability of OS rate (Figure 3G-I). The AUC for the nomogram predicting the 1-, 3-, and 5-year OS rates were 0.842 (95% CI: 0.576-0.917), 0.836 (95% CI: 0.618-0.852) and 0.816 (95% CI: 0.647-0.857), which was better than the IPI and NCCNI-IPI (Figure 4G–I). This result demonstrates the validity and dependability of the nomogram.
The Clinical Utility of the Nomogram
The clinical net benefit of the prediction models was demonstrated using the DCA. The 1-, 3-, and 5-year DCA curve evaluations in the training cohort revealed that the nomogram had better net benefits than the IPI and NCCN-IPI, as well as a greater advantage in predicting OS (Figure 5A). Similar results were obtained in the internal and external validation sets (Figure 5B and C).
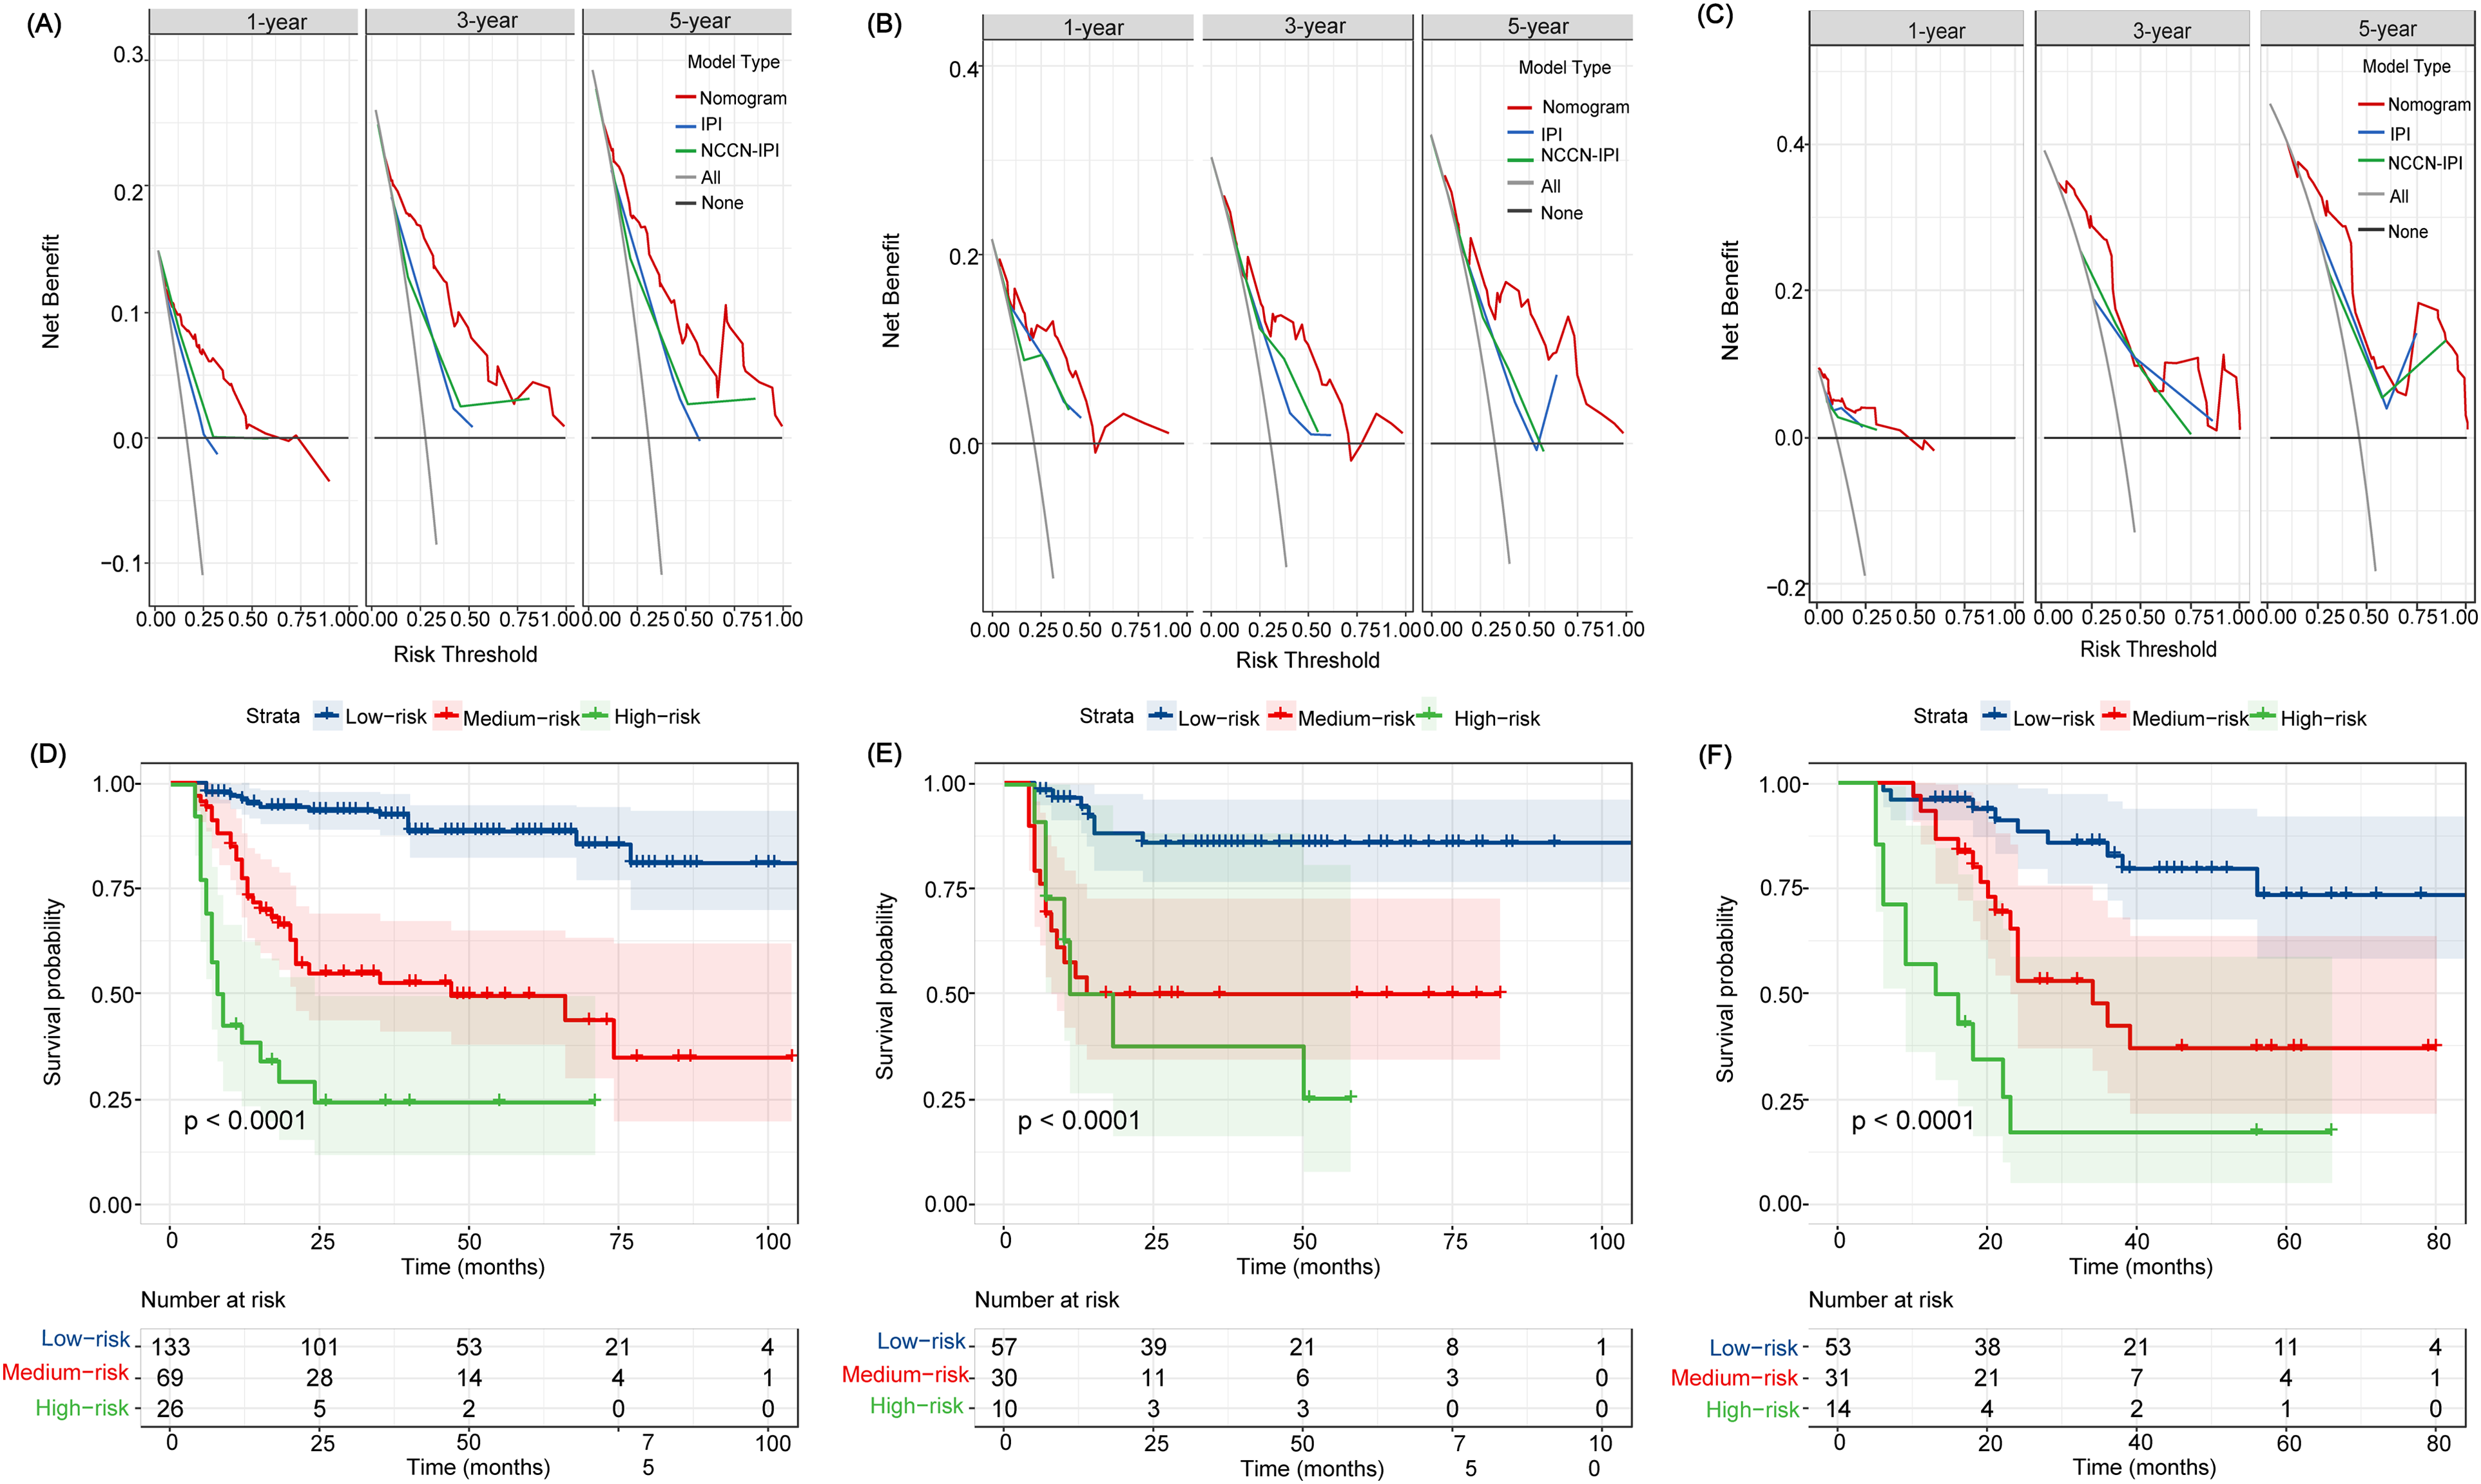
Decision curve analysis (DCA) and risk stratification of the nomogram. DCA curves of the nomogram, IPI, and NCCN-IPI in the training cohort (A), internal validation cohort (B), and external validation cohort (C); Kaplan-Meier curves for predicting OS in DLBCL patients according to risk stratification system in the training cohort (D), internal validation cohort (E), and external validation cohort (F).
To determine if the nomogram could accurately stratify patients with DLBCL, we calculated the total score for each patient and used the optimal cut-off values determined using the X-tile procedure to divide the patients in the training and validation sets into three groups: low-risk (0-156 points), medium-risk (157-273 points), and high-risk (>273 points). In the training cohort, there were 133, 69, and 26 patients in the low-, intermediate-, and high-risk groups, respectively. And the corresponding 5-year OS rates of the three risk groups were 88.6%, 49.6%, and 24.2%, respectively. There was a significant difference in OS among the three risk groups (P < .001, Figure 5D). Similarly, in the internal validation cohort, the corresponding 5-year OS rates of the three risk groups were 85.8%, 48.1%, and 28.4%, respectively. There was a significant difference in OS among the three risk categories (P < .001, Figure 5E). In the external validation cohort, the corresponding 5-year OS rates of the three risk groups were 86.1%, 47.8%, and 17.1%, respectively, with significant differences among the three groups (P < .001, Figure 5F).
Discussion
Due to the high degree of heterogeneity in DLBCL, it is crucial from a clinical standpoint to accurately estimate the prognosis of patients. The routine hematological examination is low-cost and repeatable. The variation of blood cells can indicate an individual's immunological and inflammatory status, which is important for the growth and prognosis of cancer. But this has not yet been extensively applied in clinical practice. In this work, we created and validated a nomogram to predict the 1-, 3-, and 5-year OS rates of DLBCL patients based on their baseline clinical features and hematological indicators. The model underwent rigorous internal and external validation. The research results show that compared with the IPI model and the NCCN-IPI model, the C-index and AUC of the nomogram were higher, indicating better prediction accuracy. Calibration curves and DCA analysis showed that our nomograms have satisfactory calibration and clinical applicability. In addition, patients were effectively classified into three risk groups based on the nomogram scores. All of these outcomes imply that our nomogram could be an effective supplement to the existing prognostic model. It can not only be used for predicting prognosis, but also can be used to assist doctors in developing tailored treatment plans, promoting clinical decision-making, and providing clinical nursing guidance. For example, patients with high scores are more likely to have a poor prognosis, therefore, more comprehensive treatment and nursing, longer time follow-up, and more accurate routine imaging monitoring, such as PET-CT, are required. This could be essential in improving patient survival rates.
To predict the prognosis of DLBCL, a nomogram based on a single inflammatory marker, such as SII or PNI, has been developed.21,29 However, considering the heterogeneity of patients and the difference in critical values, the predictive utility of a single clinical marker may be restricted. Furthermore, previous studies simply included potential inflammatory parameters with high correlation or collinearity into multivariate Cox regression models to select independent predictive factors, which may result in parameter conflicts and statistical issues. In this study, we gathered more variables than previous research to comprehensively evaluate the prognostic factors of patients. However, not all variable is included in the model. We conducted LASSO Cox regression analysis to select the most valuable inflammatory indicators. This method is more conducive to the development of limited sample size and multiple indicator models and can avoid the impact of multiple collinearity to some extent. Finally, the nomogram contained six indicators: age, ECOG PS, LDH level, SII, PNI, and β2-MG.
Some studies in recent years have showed that indicators related to systemic inflammatory status and immune response play a role in predicting the prognosis of cancer patients. Especially the prognostic value of indicators related to leukocyte counts (such as neutrophils, lymphocytes, and monocytes) and their combinations (such as NLR, PLR, and LMR) in particular has been fully validated.30,31 When injury or a pathogen invading occurs, the immune system is activated and produces a large number of inflammatory cells, including neutrophils, monocytes, and platelets. 32 Neutrophils can promote tumor occurrence by releasing reactive oxygen, reactive nitrogen, and metalloproteinases, 33 and they can also inhibit the anti-tumor response of CD8 + T lymphocytes to promote tumor proliferation. 34 Furthermore, neutrophils can promote tumor spread by inhibiting natural killer function and increasing tumor cell exosmosis. 35 Thus, the presence of neutrophils is frequently suggestive of a poor prognosis in tumor patients. In contrast to neutrophils, high lymphocyte counts are associated with better OS in patients with DLBCL. 36 Lymphocytes play a crucial role in immune system regulation. They exert antitumor properties by triggering cytotoxic death and preventing tumor invasion and migration. 37 Monocytes and platelets can promote tumor angiogenesis and metastasis, and their high counts are linked to worse prognosis in patients with a variety of cancers. As a result, peripheral blood cell-associated inflammatory markers indicate the dynamic balance of the immune system's antitumor and pro-tumor features and are crucial determinants of the prognosis of patients with DLBCL. Our study comprehensively evaluated the correlation between various inflammatory parameters (such as NLR, PLR, LMR, SII, SIRI, PNI, GPS, and mGPS) and the prognosis of patients with DLBC. In the training set, Kaplan-Meier survival curve showed that all these parameters were related to the patient's OS. However, after LSAAO regression and multivariate Cox regression, only SII and PNI were included in the nomogram as important prognostic factors. It is worth noting that our study is also the first to report the prognostic value of SIRI in DLBCL patients, although it cannot be used as an independent predictor to predict the prognosis of DLBCL patients.
SII is linked to circulating tumor cells and is a new indicator of an inflammatory state. Several large meta-analyses have found that SII is associated with a worse prognosis in patients with solid tumors.38,39 However, there are very little data for patients with DLBCL, and SII cut-off values vary greatly between studies, with 521.5 and 1684.09, respectively.40,41 Nonetheless, both investigations discovered that increased SII was related to shorter OS in DLBCL patients. More importantly, Wang Z et al and Wu J et al discovered that the AUC value of SII is bigger than traditional inflammatory indicators such as NLR, PLR, and LMR,21,41 indicating that the prediction effect of SII has been improved. In our study, an SII ≥ 1109.90 was associated with poor OS in patients with DLBCL and may remain a strong predictor in a multifactorial analysis. These findings suggest that SII, as a relatively novel prognostic marker, may be a better predictor of DLBCL prognosis than other standard inflammatory markers. We further evaluated the differences in clinicopathological characteristics between the high SII group and the low SII group, and found that high SII may be related to higher tumor load and disease severity.
PNI is a composite indicator of nutritional and inflammatory status. Low PNI has been associated with poor OS and PFS in many cancers, including DLBCL.18,42,43 Shen Z et al also found that PNI was a powerful predictor that could re-stratify the prognosis of different clinicopathologic subgroups. 43 In our study, the prognostic value of PNI was also verified, and we found that it can be used as an independent predictor of OS in patients with DLBCL to predict patient prognosis. We further compared the differences in clinicopathological characteristics between the high PNI group and the low PNI group, and found that the low PNI levels may reflect higher tumor load and greater aggressiveness, which may lead to malnutrition and immunosuppression and are associated with poorer survival outcomes in patients with DLBCL.
β2-MG and LDH are tumor-related parameters. LDH is involved in tumor homeostasis and disease progression via some proinflammatory cytokines. 44 There is adequate evidence to suggesting that an increase in LDH levels is associated with a worse survival outcome in DLBCL patients. 45 LDH is another independent prognostic factor in DLBCL patients in this study. β2-MG can be used as an indicator to reflect tumor load, tumor aggressiveness, and the ability of the immune surveillance system to recognize tumors. Previous study has linked an increase in β2-MG levels to a poor prognosis in individuals with lymphoproliferative disorders such as Burkitt's lymphoma and peripheral T-cell lymphoma, including DLBCL.46–48 The GELTAMO-IPI scoring system based on β2-MG and other factors enable more accurate stratification of DLBCL patients. 49 Our study used the ROC curve to determine the cut-off value for β2-MG. According to the ROC curve, the cut-off value for β2-MG was 2.55. Our investigation further revealed that high level of β2-MG is correlated to a worse OS in DLBCL and could be used as an independent predictor to create a nomogram.
Although the new model in this study significantly improved the accuracy of predicting patient OS, our study has some limitations. Firstly, as this is a retrospective study, there may be some selection bias. Secondly, our goal is to design a nomogram based on baseline characteristics to predict the prognosis of patients, so we did not check the dynamic changes of these indicators or the impact of follow-up treatment on the prognosis of patients in the study. Thirdly, we only focus on patients’ OS, but not on progression-free survival. Finally, we only selected patients from two hospitals in Wuxi City for analysis, it is unclear whether the results of this study are applicable to hospitals in other regions. Therefore, in the future, we will need to perform multi-center collaboration and more large sample prospective cohort studies to validate our research findings.
Conclusions
To summarize, our nomogram based on clinical features and inflammatory markers demonstrates great prediction accuracy and discrimination, which may be used to assist clinicians in selecting and adjusting treatment regimens.
Supplemental Material
sj-docx-1-tct-10.1177_15330338231180785 - Supplemental material for An Externally Validated Nomogram for Predicting the Overall Survival of Patients With Diffuse Large B-Cell Lymphoma Based on Clinical Characteristics and Systemic Inflammatory Markers
Supplemental material, sj-docx-1-tct-10.1177_15330338231180785 for An Externally Validated Nomogram for Predicting the Overall Survival of Patients With Diffuse Large B-Cell Lymphoma Based on Clinical Characteristics and Systemic Inflammatory Markers by Yajiao Liu, Li Sheng, Haiying Hua, Jingfen Zhou, Ying Zhao and Bei Wang in Technology in Cancer Research & Treatment
Supplemental Material
sj-pdf-2-tct-10.1177_15330338231180785 - Supplemental material for An Externally Validated Nomogram for Predicting the Overall Survival of Patients With Diffuse Large B-Cell Lymphoma Based on Clinical Characteristics and Systemic Inflammatory Markers
Supplemental material, sj-pdf-2-tct-10.1177_15330338231180785 for An Externally Validated Nomogram for Predicting the Overall Survival of Patients With Diffuse Large B-Cell Lymphoma Based on Clinical Characteristics and Systemic Inflammatory Markers by Yajiao Liu, Li Sheng, Haiying Hua, Jingfen Zhou, Ying Zhao and Bei Wang in Technology in Cancer Research & Treatment
Footnotes
Acknowledgments
We thank all the patients who participated in this study.
Author Contributions
YJL, HYH, and JFZ conceived and designed this study. YJL, LS, and YZ collected data. All authors participated in data analysis, drafting, or revising articles. All authors have read and approved the final manuscript.
Data Availability Statement
Data can be made available by contacting the corresponding author.
Declaration of Conflicting Interest
The authors reports no potential conflicts of interest with respect to the research, authorship, and/or publication of this article.
Ethics Approval
This study was approved by the Medical Ethics Committee of Affiliated Hospital of Jiangnan University (approval number: LS2022037) and the Ethics Committee of Wuxi People's Hospital Affiliated with Nanjing Medical University (approval number: KY22101).
Funding
The authors received no financial support for the research, authorship, and/or publication of this article.
Informed Consent
The requirement for written informed consent was waived off due to the retrospective nature of the study. All data used in this manuscript were anonymized.
Supplemental Material
Supplemental material for this article is available online.
Abbreviations
References
Supplementary Material
Please find the following supplemental material available below.
For Open Access articles published under a Creative Commons License, all supplemental material carries the same license as the article it is associated with.
For non-Open Access articles published, all supplemental material carries a non-exclusive license, and permission requests for re-use of supplemental material or any part of supplemental material shall be sent directly to the copyright owner as specified in the copyright notice associated with the article.