
Abstract
Keywords
Introduction
Ferroptosis is a regulated cell death definite type for the gathering of lipid-based lipid-reactive oxygen species (ROS) recently. 1 It is an iron-dependent procedure motivated by the fatal gathering of lipid peroxidation. 2 In latest durations, the ferroptosis induction has become an encouraging substitute curative to stimulate tumor cell death, particularly on behalf of malignancies therapy using traditional treatments.3,4
Diffuse large B-cell lymphoma (DLBCL), as defined by the World Health Organization (WHO) classification, is biologically and clinically heterogeneous malignancies of the proliferation of large lymphoid B cells. 5 According to the origin of the cell, DLBCL is generally divided into germinal center B cell (GCB) and activated B cell (ABC) subtypes. About 60%–70% of DLBCL patients can be cured with the generally recognized rituximab, cyclophosphamide, hydroxydaunorubicin, vincristine, and prednisone regimen. 6 While the remaining patients will experience a relapse or be refractory. Meanwhile, the prognosis of advanced cancer patients is still unfavorable. Ferroptosis was deemed to be a very important target in various disease therapies, especially in cancer therapy.7,8 Expression of specific genes affect the ferroptosis occurrence, making them a promising target for treatment. Thus, it is important to explore tumor progression and the underlying ferroptosis mechanism of tumorigenesis in DLBCL. Moreover, there is an urgent need to identify novel potential prognostic biomarkers that could be even used as realistic targets.9,10
Previous studies have informed that ferroptosis participated in many physiopathological processes, including the development of several kinds of cancers, 11 but a little in DLBCL. For example, in mouse lymphoma models, erasing a ferroptosis inducer could sluggish tumor growth and stimulate hypertrophy. Some research also reflected that the induction of ferroptosis was an impending therapeutic approach for lymphoma, but the research on relationships between ferroptosis and clinical lymphoma data was still needed. 12 Meanwhile, researchers found that lymphoma cell lines in a sensitivity analysis were particularly susceptible to GPX4-regulated ferroptosis. 13 Nevertheless, whether ferroptosis-related genes expression were related to DLBCL patients’ prognosis residues fundamentally unidentified.
In our research, we primarily derived DLBCL patients’ clinical information and expression profiles cohort. Then, we constructed 2 predicting models. Model 1 was a multigene prognostic model with ferroptosis-related genes, while Model 2 was multiclinical factors, prognostic models with clinical risk factor and the risk score calculated from model 1. In the end, we carried out the functional enrichment analysis to examine potential mechanisms engaged with genes in Model 1. Also, the correlation was analyzed between genes in Model 1 and immune infiltration. We considered that the robust prognostic model could help to improve the risk stratification of DLBCL patients and enable more accurate assessment for clinical management of the related population.
Results
Patient Selection
Two datasets(GSE11318 (n = 203) and GSE57611(n = 37)) were delocked batch effect with batch and clinically distinct subtypes, the principal component analysis (PCA) analysis of gene expression data distributed much more averagely after batch removal (Supplemental Figure S2A). compared to before (Supplemental Figure S2B). A total of 240 DLBCL patients were obtained as the training set. In total, 412 DLBCL patients from the GSE10846 cohort as validation set were enrolled. The detailed clinical characteristics of patients in both training and validation cohorts were summarized in Table 1.
Baseline Clinical Characteristics of DLBCL Patients.

Abbreviations: DLBCL, diffuse large B-cell lymphoma; ABC, activated B cell.
Identification of Prognostic Ferroptosis-Related Genes
221 ferroptosis-related genes were matched with the training gene set, and 27 of which were associated with overall survival (OS) in the univariate Cox regression in the training set (Supplemental Table S2 and Figure S3A). The PPI network derived from the STRING archive among the candidate genes indicated that TP53, MUC1, NOX4, and so on were the hub genes (Supplemental Figure S3B).
Construction of a Prognostic Model in the Training Cohort
Using deviance as the selection criteria, 10-fold cross-validation was performed when the least absolute shrinkage and selection operator (LASSO) cox method was used for modeling in the process of gene selection. Partial likely deviance distribution of each log(λ)was shown in Figure 1A. The coefficients result distribution when using different variables were shown in Figure 1B. Stepwise method was applied to the results to optimize the model AIC results, when the results were 4 genes, the model has the best AIC. The model that obtained the best results was composed of CAPG, HAMP, NOX4, and SLC1A5.We further used the 4 OS genes to build a cox regression model as the final model called model 1(gene expression model). The risk score was calculated according to the formula mentioned in the method part as following:

Identification of prognostic ferroptosis-related genes in DLBCL. (A) LASSO coefficient profiles of the most useful prognostic genes. (B) 10-fold cross-validation for tuning parameter selection in the LASSO model. (C) Heatmap of enriched terms across the 27 mRNAs, colored according to P-value. (D), (E) Network of enriched terms colored according to (D) cluster ID (nodes with the same cluster ID are typically close to each other) and (E) p-value (terms with more genes tend to have higher p-values). LASSO: least absolute shrinkage and selection operator; DLBCL: diffuse large B-cell lymphoma.
GO term analyses were executed to investigate the possible biological functions of 27 identified OS genes. As shown in Figure 1C-E, terms with more genes tended to develop greater P-values, and GO annotation and KEGG pathway revealed top categories that were positively correlated with ferroptosis, such as ferroptosis, cellular response to ionizing radiation, response to an inorganic substance, etc These results indicated that GO enrichment was critically significant in DLBCL patients, and powerfully associated with ferroptosis, especially in the cellular response to ionizing radiation.
Independent Prognostic Role of the Prognostic Gene Signature
The result of the best cutoff value that could separate the people into high-risk and low-risk groups was 0.78 conferring to the risk score distribution plot in Figure 2A. The patients were stratified into a high-risk group (n = 74) or a low-risk group(n = 155) conferring to the cut-off value (Figure 2A). The high-risk group turned out to be considerably different from the low-risk group in TNM stage I to IV, clinically distinct subtypes (ABC&GCB, ABC, GCB), and total population in the training cohort (Figures 2 and 3). As shown in Figure 2B, patients with high-risk had a high probability of death earlier than those with low-risk in total cohort. The time-dependent ROC curves were applied to estimated the predictive performance of the risk score for OS, and the area under the curve (AUC) got 0.673 at 1 year, 0.708 at 3 years, and 0.709 at 5 years (Figure 2C). As shown in Figure 2D-G, patients with high risk had a high probability of death earlier than those with low-risk in every TNM stage. Also, the Kaplan-Meier curve suggested that patients in the high-risk group obligated a considerably worse OS (P < .001) than the low-risk equivalents in clinically distinct subtypes (ABC&GCB, ABC, GCB, Figure 3A-C). The same OS results were seen in total cohort (Figure 4A), the TNM stages (I-IV, Figure 4B-E) and clinically distinct subtypes (ABC&GCB, ABC, GCB, Figure 4 F-H) in the validation set in GSE10846. What's more, in validation set GSE4475, except the TNM stage(I,II, Supplemental Figure S4B-C), the worse OS was shown in high-risk group compared to low-risk group in the total cohort (Supplemental Figure S4A) the TNM stage (III,IV, Supplemental Figure S4D-E) and clinically distinct subtypes (ABC&GCB, ABC, GCB, Supplemental Figure S4G-H). In validation set GSE32918, the consistent result was shown in total cohort (Supplemental Figure S5A) and clinically distinct subtypes (ABC&GCB, ABC, GCB, Supplemental Figure S5 B-D).

Prognostic OS analysis of the 4-gene signature model in the training cohort. (A) The distribution and cutoff value of the risk scores in the training cohort. (B, D-G) Kaplan–Meier curves for the OS of patients in the high-risk group and low-risk group in the TNM stage (total,I-IV). (C) AUC of time-dependent ROC curves verified the prognostic performance of the risk score in the training cohort. Abbreviations: OS, overall survival; AUC, area under the curve.
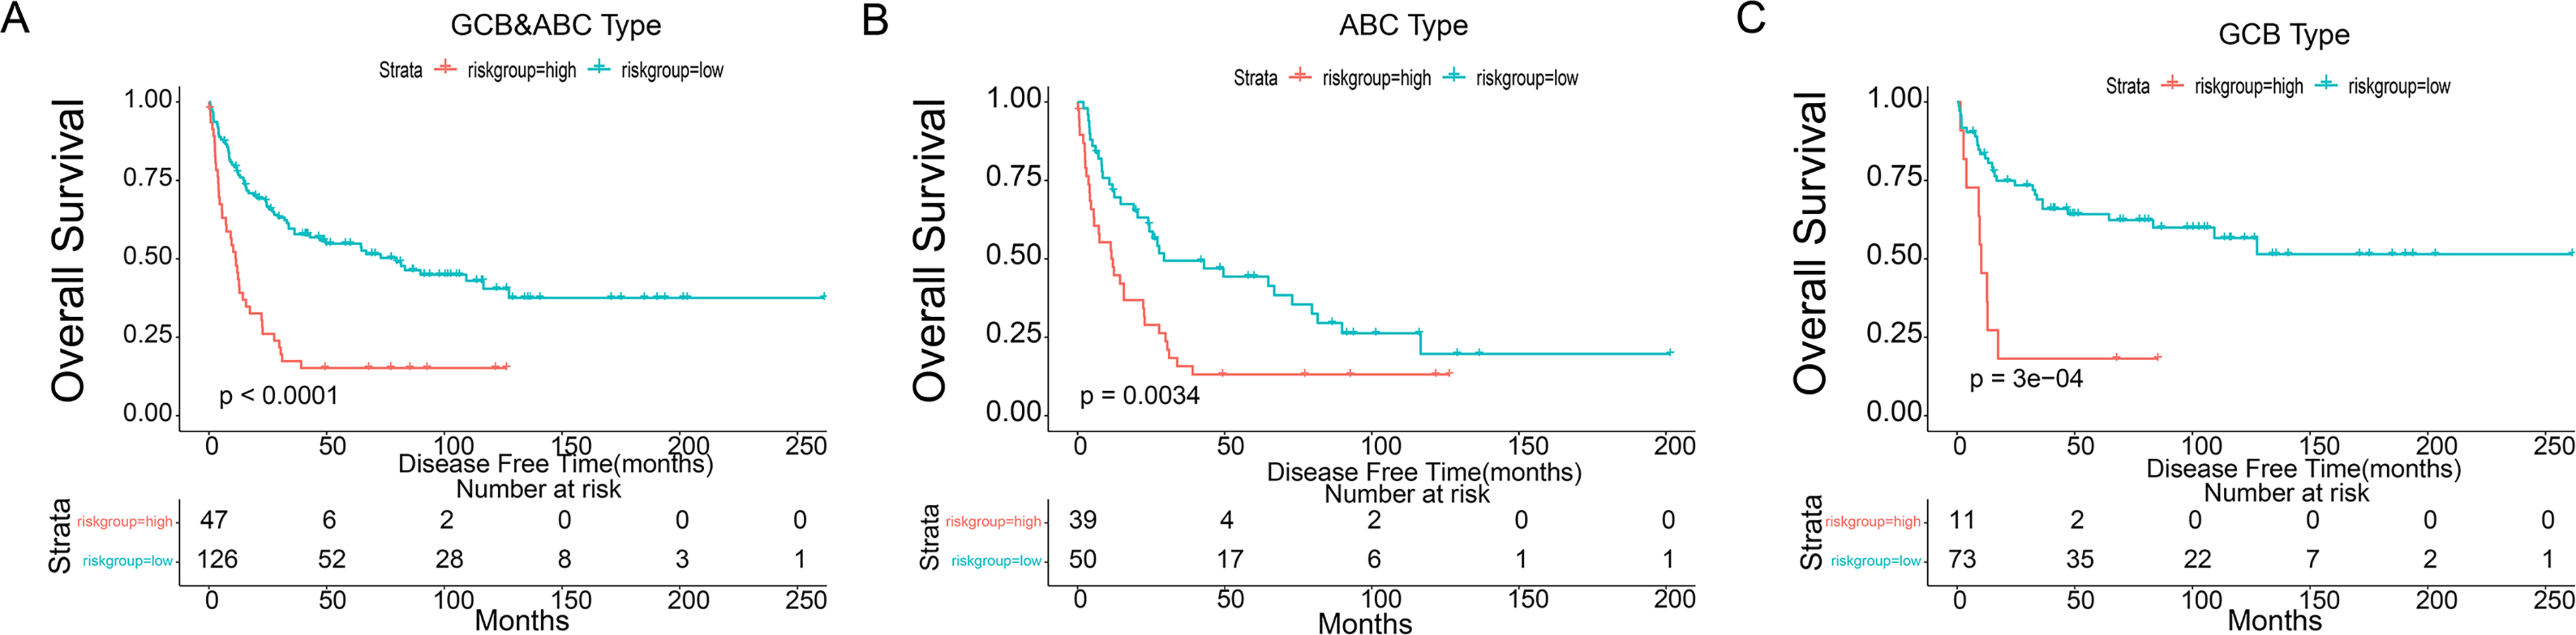
Prognostic OS analysis of the 4-gene signature model in the training cohort. (A-C) Kaplan-Meier curves for the OS of patients in the high-risk group and low-risk group in clinically distinct subtypes (ABC&GCB,ABC,GCB, respectively). Abbreviations: OS, overall survival; GCB, germinal center B cell; ABC, activated B cell.
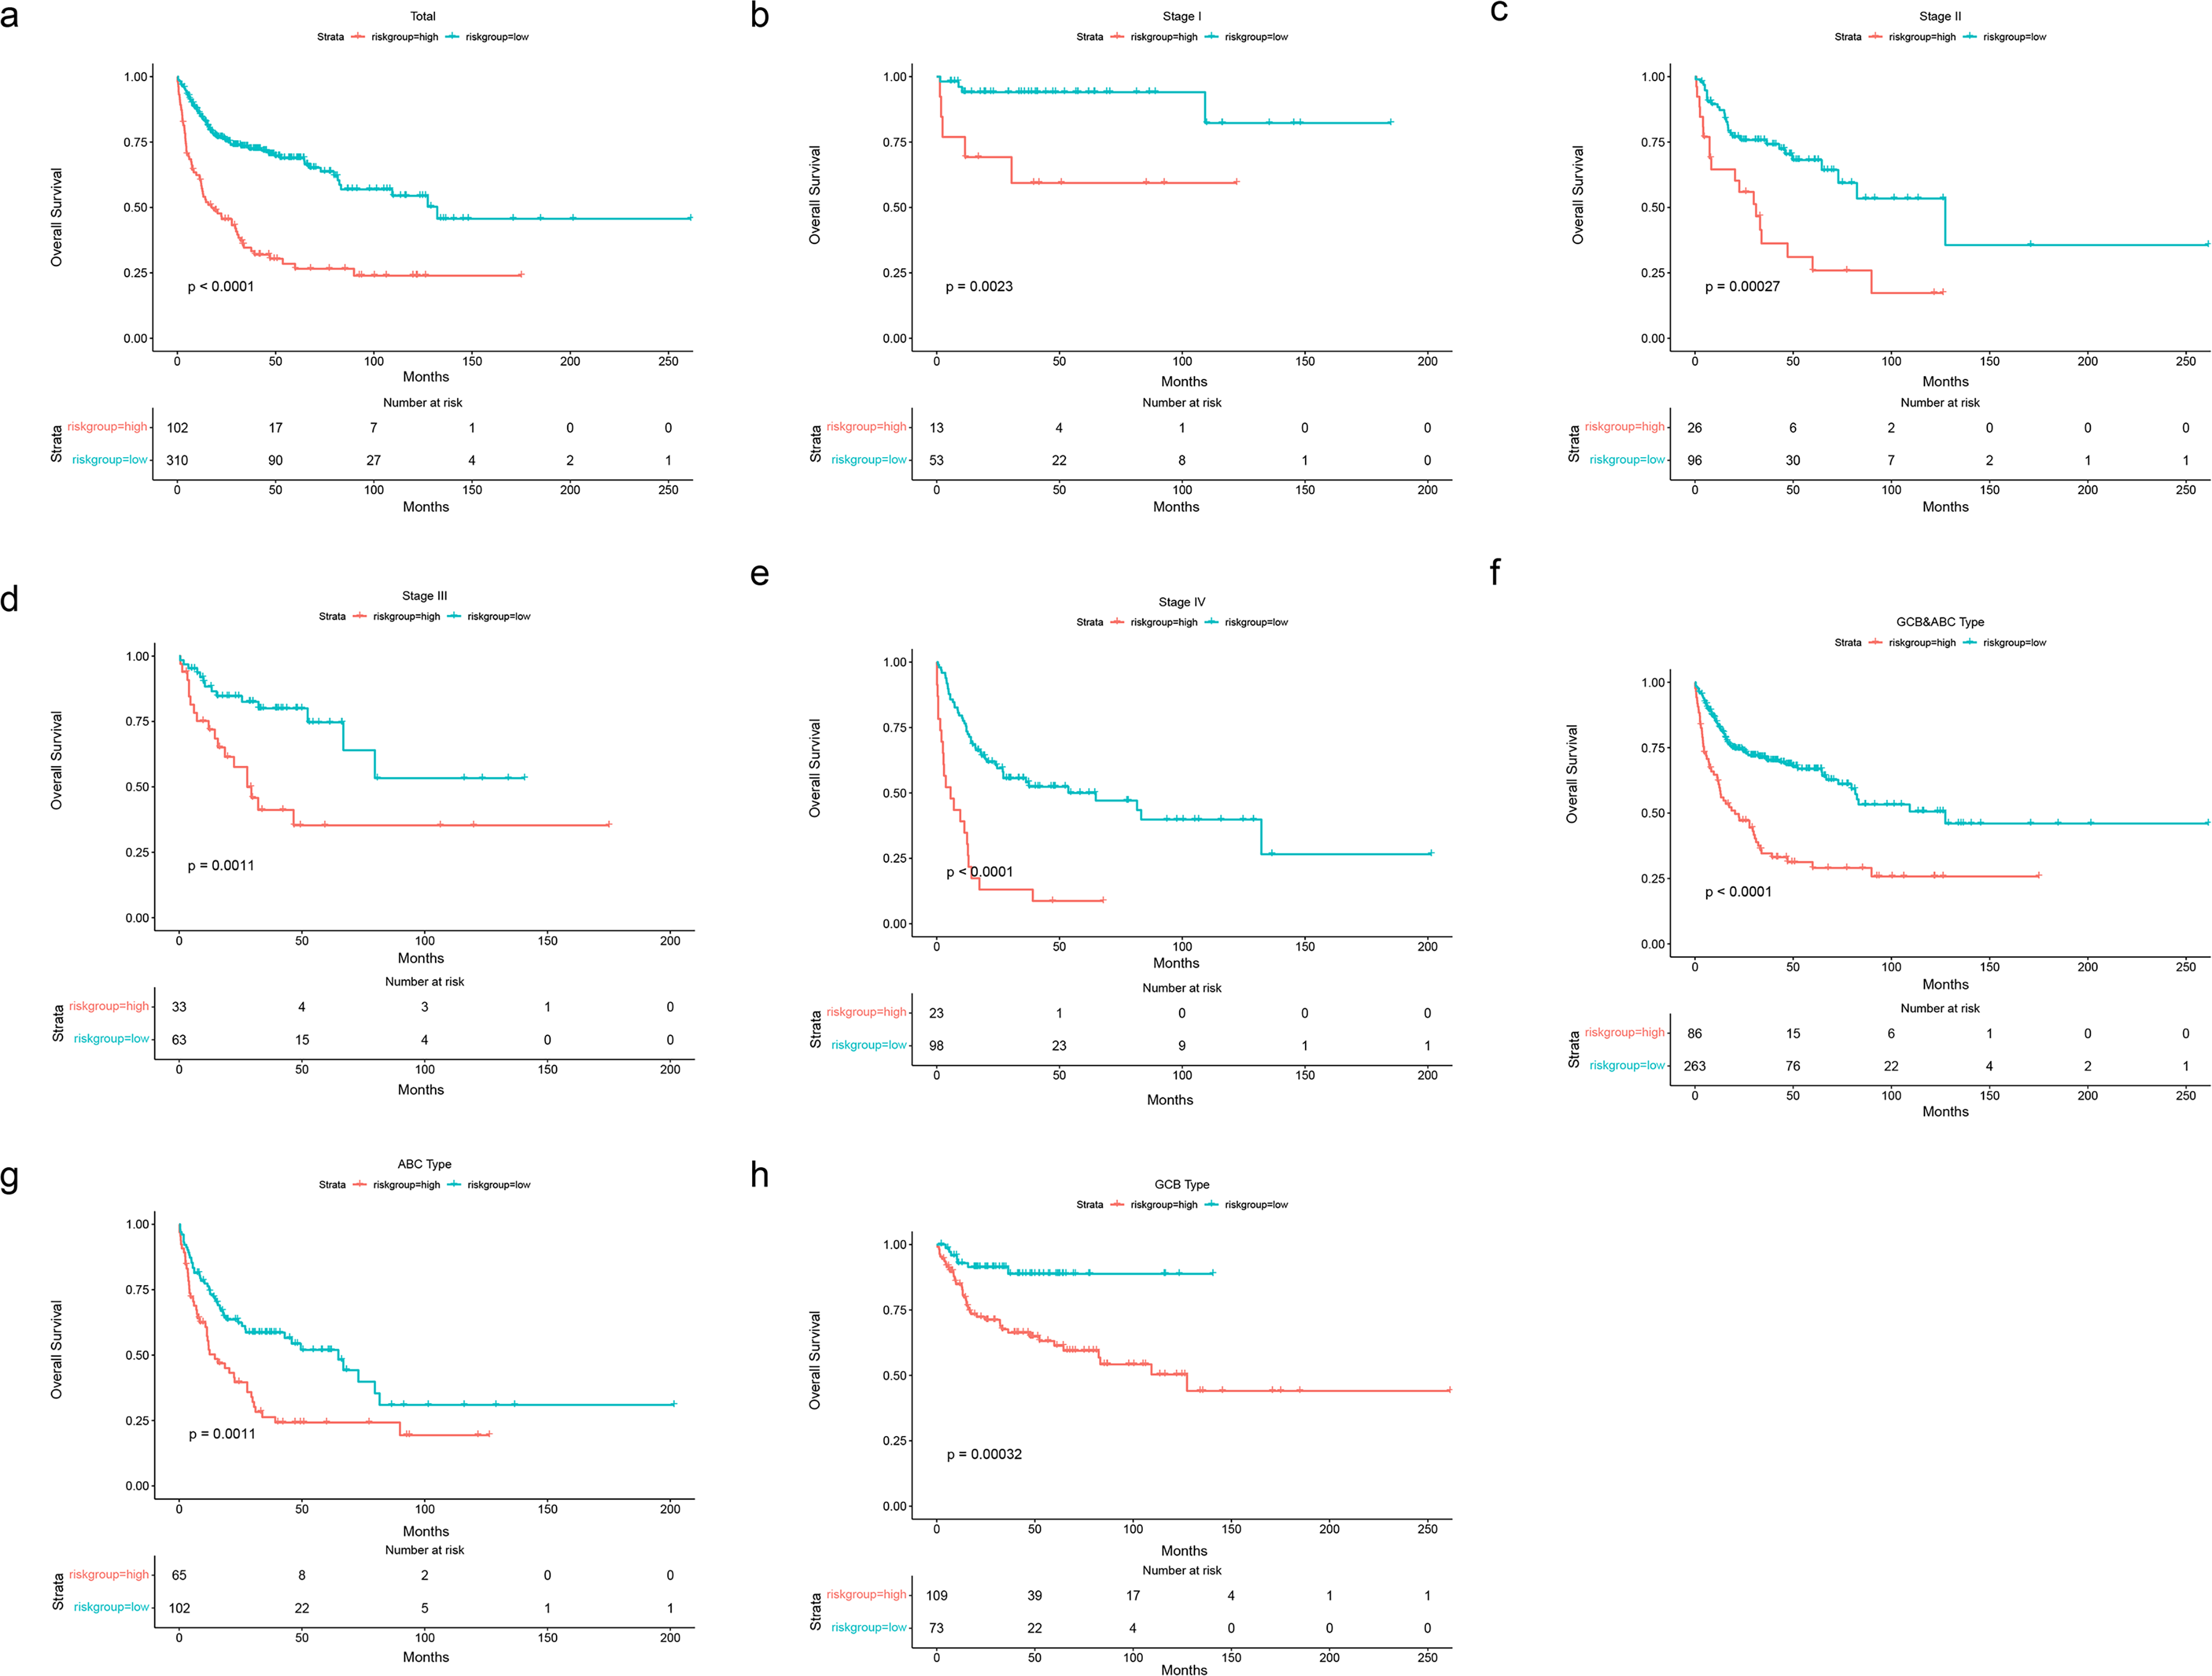
Prognostic OS analysis of the 4-gene signature model in validation cohort in GSE10846. (A-E) Kaplan–Meier curves for the OS of patients in the high-risk group and low-risk group in the TNM stage (total,I-IV). (F-H) Kaplan–Meier curves for the OS of patients in the high-risk group and low-risk group in clinically distinct subtypes (ABC&GCB, ABC, GCB, respectively). Abbreviations: OS, overall survival; GCB, germinal center B cell; ABC, activated B cell.
Independent Prognostic Factor Role of the 4-Gene Signature in Clinical Regression Model
We further choose GCB and ABC types to present our findings (n = 173 patients).To ensure the completeness of clinical information, we drop the patient with any missing value in stage, clinically distinct subtypes, age and risk score and got 160 patients after this step. The age was separated by 60 as young and old patients. Among the 160 OS patients included in the training dataset, univariate Cox regression analysis indicated that age group, final microarray diagnosis, stage, and our prognostic model were significant. Among these factors, age, TNM stage, the risk score was the hazardous variables (P-value<.05). Also, multivariate cox regression which was called model 2(clinical model) indicated that risk score was an independent prognostic factor for OS (Figure 5A), which was consistent with the results in validation set in GSE10846 (Figure 6A).

(A) Forrest plot of the multivariate Cox regression analysis in DLBCL training set. (B) Establishment of the nomogram predicting OS for DLBCL patients in the training cohort. The nomogram plot was built based on 4 prognostic factors in DLBCL. (C) The calibration plot for internal validation of the nomogram. (D-F) The time-dependent ROC curves of the nomograms comparison for 1-, 3-, and 5-year overall survival in DLBCL, respectively. (G-H) The DCA curves of the nomograms comparison for 1-, 3-, and 5-year OS in DLBCL, respectively. Abbreviations: DLBCL: diffuse large B-cell lymphoma; OS, overall survival.

Nomogram was built including age, clinically distinct subtypes, stage, and risk score (Figure 5B). In the nomogram, the probability of 1-, 3-, 5- were vertically paralleled with the total points calculated by the sum of points of every single variable. The calibration plots displayed that the precision of the nomogram is satisfactory in forecasting 1-, 3-, and 5year OS (Figure 5C). The 1-,3-,5- ROC curve of the different models including every single variable model and our established risk score model were presented in Figure 5D-F.The model had the best performance in 1-(AUC = 0.773), 3-(AUC = 0.805), and 5 year(AUC = 0.813). The 1-,3-,5 years DCA figures were presented including every single variable model and our established risk score model (Figure 5G-H). Consistently, the model showed the best net benefit for forecasting OS, particularly on behalf of 3-, 5-year survival. The multivariate Cox regression results, nomogram, calibration plot, 1-, 3-, 5years ROC results, 1-, 3-, 5 years DCA results show quite a similar trend with the results in the validation cohort (GSE10846) (Figure 6).
Correlation Analyses Between Risk Score Genes Expression and Infiltrating Immune Cells
We further investigated the association between genes in model 1(gene expression model) and 6 kinds of infiltrating immune cells, including CD4 + T cells, CD8 + T cells, B cells, macrophages, neutrophils, and dendritic cells. The outcomes revealed that all 4 genes expression levels had meaningful associations with the dendritic cells (Figure 7). Our results suggested that dendritic cells may be significantly associated with DLBCL.

Correlation of 4 genes in risk score model expression with immune infiltration levels in DLBCL samples, as assessed by TIMER analysis. (A) CAPG. (B) HAMP. (C) NOX4.D SLC1A5. DLBCL: diffuse large B-cell lymphoma; TIMER, tumor immune estimation resource.
Identification of Potential Ferroptosis Subtypes of DLBCL
Ferroptosis subtypes can be utilizedd to reflect the Ferroptosis-related status in cancers, and therefore supporting to recognize appropriate patients for specific therapy. Consequently, we investigated the expression profiles of 221 Ferroptosis-related genes in 229 patients from the derivation cohort to implement consensus clustering. According to their cumulative distribution function and function delta area, we selected k = 3 where Ferroptosis-related genes showed to be steadily clustered (Figure 8A-B) and attained 3 Ferroptosis-related genes designated as Ferroptosis-related subtypes (FR1-FR3) (Figure 8C). FR2 and FR3 were associated with a better prognosis, whereas FR1 had the poorest survival probability (Figure 9A). Subtype distribution across different risks groups, tumor stages, and clinically distinct subtypes indicated that patients were irregularly clustered and the proportion is similar (Figure 9B-D). Consistent with the outcomes attained with the training group, the Ferroptosis-related subtypes were prognostically appropriate in the validation cohort also (Figure 9E), and considerably changed in diverse risks groups, tumor stages (Figure 9F-G), as well as clinical distinct subtypes (Figure 9H). Taken together, the Ferroptosis-related subtypes can be utilized to foresee the prognosis of DLBCL patients, which is consistent across different cohorts.

Identification of potential ferroptosis subtypes of diffuse large B-cell lymphoma (DLBCL). (A) Cumulative distribution function curve. (B) Delta area of ferroptosis-related genes in training cohort. (C) Samples clustering heatmap.
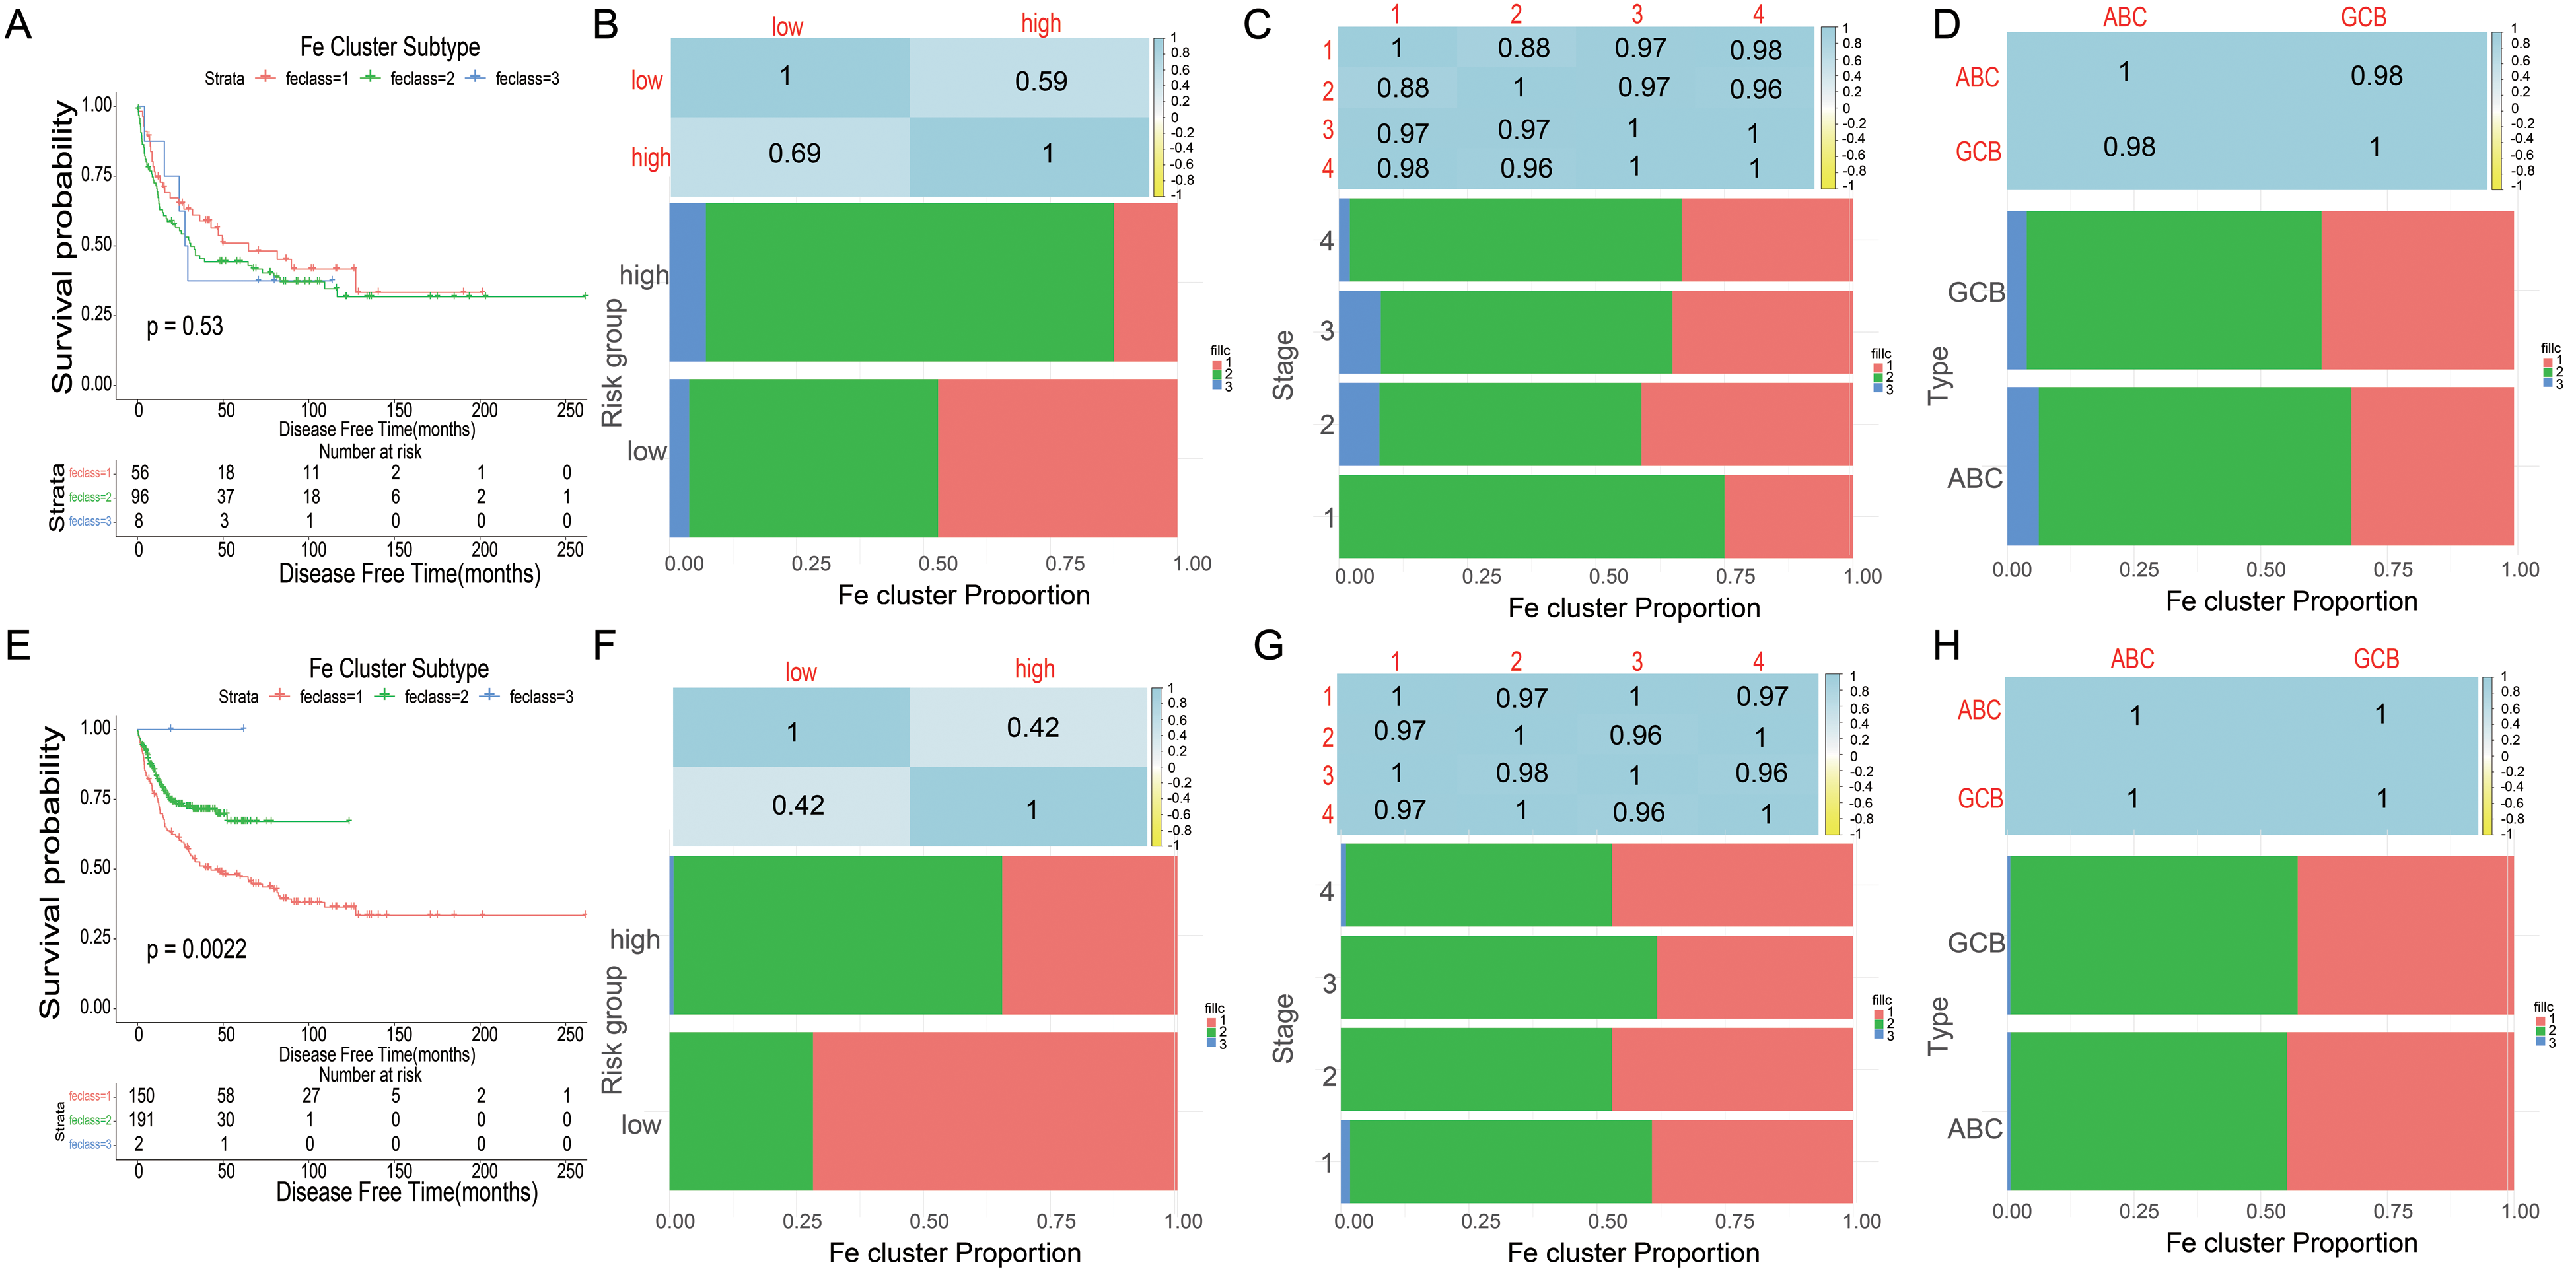
Prognostic evaluation and ferroptosis subtypes validation of DLBCL patients. (A) Kaplan–Meier curves showing OS of DLBCL ferroptosis subtypes in training cohort. (B-D) Distribution of FS1-FS3 across DLBCL signature(B), TNM stages(C) and clinically distinct subtypes(D) in training cohort. (E) Kaplan-Meier curves showing OS of DLBCL ferroptosis subtypes in validation cohort. (F–H) Distribution of FS1-FS3 across DLBCL signature(F), TNM stages(G) and clinically distinct subtypes(H) in validation cohort. Abbreviations: DLBCL, diffuse large B-cell lymphoma; OS, overall survival.
External Validation Using the Online Database
Consistent with our results, CAPG and SLC1A5 were found to be significantly overexpressed in the tumor, while HAMP and NOX4 were not significantly expressed in DLBCL in the Oncomine (Figure 10A). The mRNA expression of CAPG was uncovered to be considerably overexpressed in DLBCL tumors than normal tissue in the GEPIA database (Figure 10B). In the cBioportal for Cancer Genomics website, NOX4 among 4 genes of the risk score model obsessed the most recurrent genetic alterations(0.7%) and missense mutation was the most usual alteration (Figure 10C). Survival analyses were performed in GEPIA. High CAPG expression patients group displayed remarkable longer OS and DFS in GEPIA (Figure 11A-B), however, HAMP and NOX4 and SLC1A5 were no significant differences in OS and DFS (Figure S6). Meanwhile, CAPG was found in consistent with OS results in GSE4475 (Figure 11C). Taking together, CAPG was an aberrant expression gene and low CAPG expression predicted adverse outcomes as a potential prognosticator.
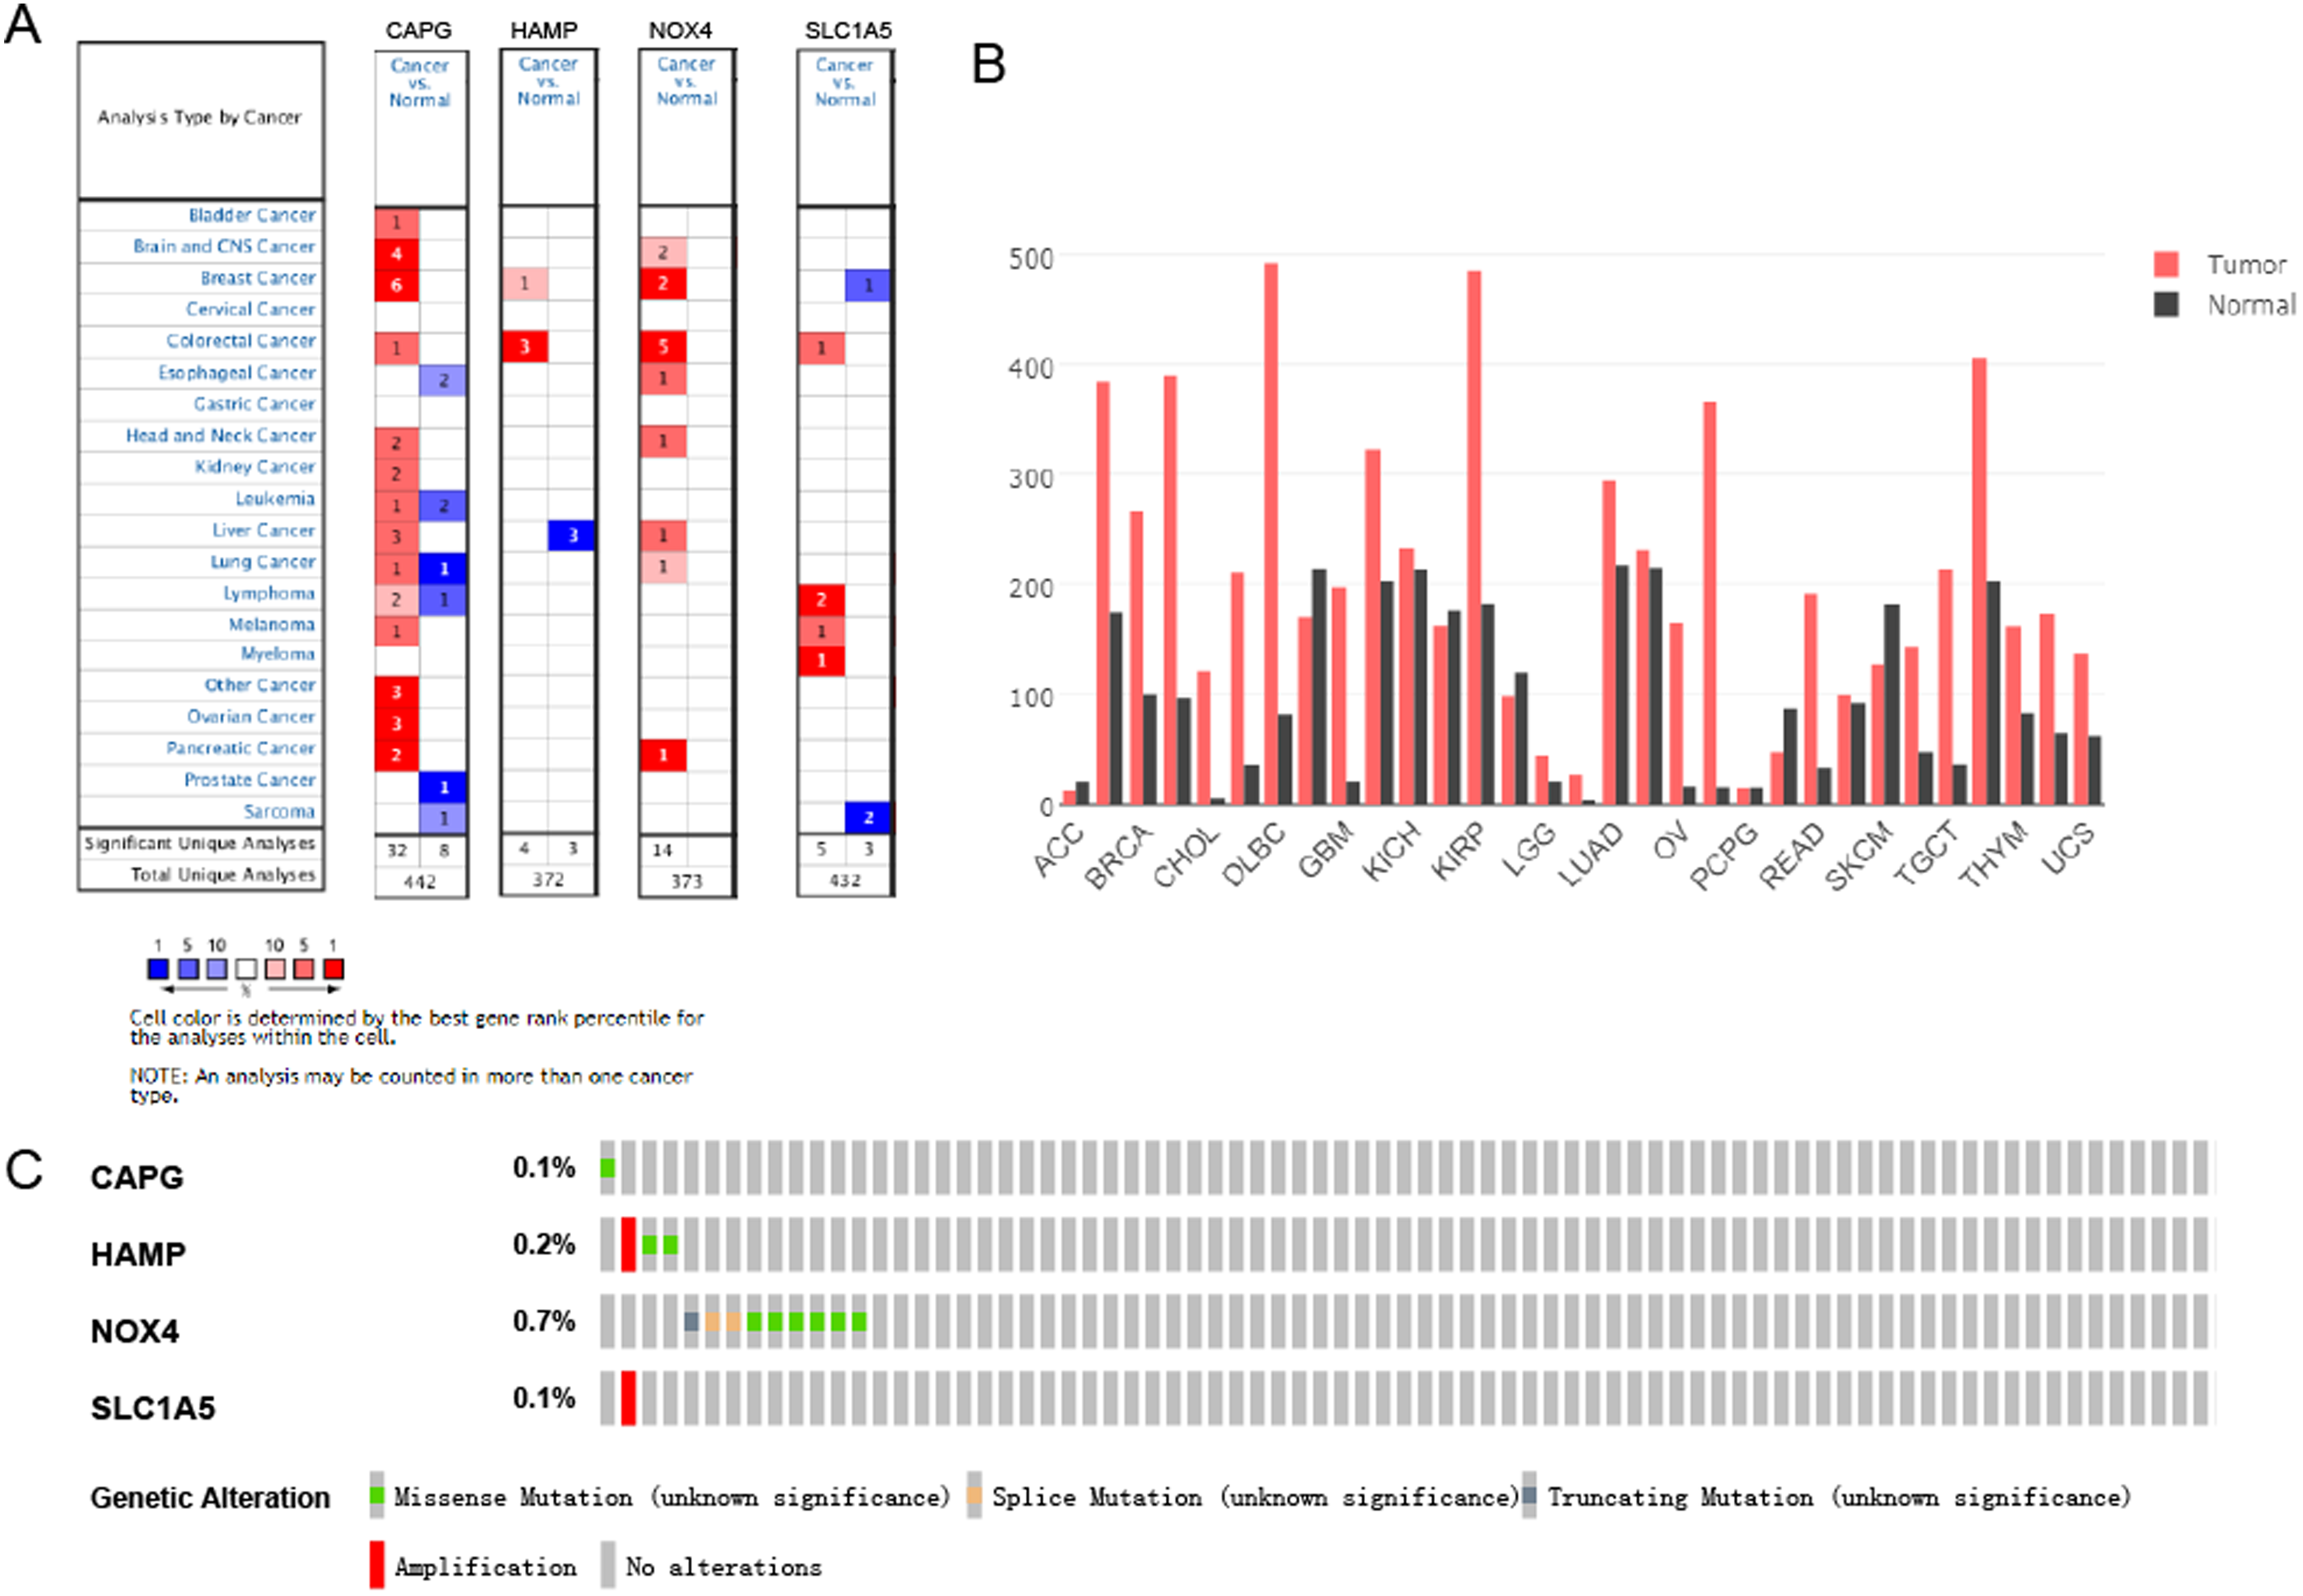
Expression and genetic alterations of the 4 predictive genes. (A) The expression profiles of the 4 genes in the Oncomine database (https://www.oncomine.org/resource/main.html). (B) The CAPG expression in tumor tissue and normal tissue in GEPIA (http://gepia.cancer-pku.cn/index.html). (C) Genetic alterations of the 4 genes. Data were from the cBioportal for Cancer Genomics (http://www.cbioportal.org/).

Prognostic value of CAPG expression. (A) CAPG in OS in GEPIA. (B) CAPG in DFS in GEPIA. C CAPG in overall survival in GSE4475 in prognoscan. Abbreviations: OS, overall survival; DFS, disease-free survival.
Discussion
Ferroptosis is a novel form of regulated cell death that can inhibit the progression of chemotherapy-resistant tumors.14,15 But the role between mRNA expression and ferroptosis-related genes in DLBCL is unclear. In this study, we systematically studied the role of ferroptosis-related genes in DLBCL. A new prognostic model involving 4 ferroptosis-related genes was erected and endorsed in an exterior group. Functional analyze discovered that ferroptosis-related passageways were enriched in DLBCL. Few preceding studies implied that numerous genes might control provoked ferroptosis and their association with DLBCL patients' OS. 16 For instance, GPX4-positive and 8-hydroxydeoxyguanosine-negative patients had a significantly poor prognosis. And GPX4 overexpression inhibits ROS-induced cell death in DLBCL. 13
In our study, 27 ferroptosis-related genes were found to be correlated with OS in the univariate cox regression analysis. It revealed the possible role of ferroptosis in DLBCL and the opportunity of structuring a prognostic model utilized these ferroptosis-related genes. Our prognostic model was composed of 4 ferroptosis-related genes(CAPG, HAMP, NOX4, and SLC1A5). These genes could be crudely categorized into 6 classes comprising of response to starvation (NOX4, HAMP), central carbon metabolism in cancer (SLC1A5), cellular response to ionizing radiation (NOX4, HAMP), response to an inorganic substance (HAMP),sulfur compound metabolic process (NOX4), and response to tumor necrosis factor (HAMP).
CapG, a member of the gelsolin protein family, has been found in the cytoplasm and nucleus. 17 Previously, CapG was identified as an oncogene in various carcinomas, including prostate, 18 breast, 19 and lung adenocarcinoma. 20 It was overexpressed in cancer specimens or cell lines and has been reported to promote tumor invasion and metastasis, such as CapG was connected with prognosis and dependent on cellular migration and invasiveness in ovarian carcinoma and hepatocellular carcinoma.20,21 HAMP, involved in the maintenance of iron homeostasis and played a vital role in iron absorption regulation. 22 HAMP was up-regulated and responsible for the progression of colorectal adenocarcinoma tissue iron metabolism. HAMP was overexpressed and ferroportin amount reduction could cause iron accumulation and Wnt signaling increase, which was shown to be crucial in colorectal carcinogenesis. 23 NOX4 encodes a member of the NOX-family. NOX4 was also involved in high glucose-induced apoptosis in renal tubular epithelial cells via the Notch pathway. 24 SLC1A5 is a small neutral amino acid exchanger and upregulated in rapidly proliferating lymphocytes. 25 For instance, SLC1A5 was significantly increased in 5 ibrutinib-resistant Mantle cell lymphoma patient samples, comparing with 4 ibrutinib-sensitive Mantle cell lymphoma patient samples. 26
High CAPG expression patients group displayed remarkable longer OS and DFS in GEPIA (Figure 10A-B). Meanwhile, CAPG was found in consistent with OS results in GSE4475 (Figure 11C), and consistent with CAPG coefficient risk score was a negative number. Taking together, CAPG was an aberrant expression gene and low CAPG expression predicted adverse outcomes as a potential prognosticator.
We investigated the association between genes and clinical features including TNM stage and clinically distinct subtypes by the risk score calculated according to the selected gene signature. First, in the analysis process of univariate cox regression, the high-risk group turned out to be considerably different from the low-risk group in TNM stage I-IV, clinically distinct subtypes and total population in both the training cohort and the validation cohort. The OS of patients in the high-risk group was shorter than that of patients in the low-risk group in the TNM stage and clinically distinct subtypes (ABC, GCB) (P < .001 in the training cohort and validation cohort). What's more, multivariate cox regression which was called model 2(clinical model) indicated that risk score was an independent prognostic factor (HR = 2.73,95%CI = [1.74-4.30]) for OS (Figure 5A), which was consistent (HR = 2.73, 95%CI = [1.21-3.26]) with the results in validation set in GSE10846 (Figure 6A). ROC curve confirmed the signature's foretelling size.
Besides, the result of functional analysis publicized that ferroptosis-related pathways were enriched, and ferroptosis prognosis status was altered between 3 subtypes by consistency cluster analysis. In addition, we built a nomogram including age group, final microarray diagnosis, stage, and our prognostic model. The performance of the nomogram was verified in validation cohorts. The calibration plots displayed that the precision of the nomogram is well in foretelling 1-, 3-, and 5-year OS. Consequently, our nomogram may provide simple, accurate prognosis predictions for DLBCL.
Finally, we also investigated the association between gene signature and 6 kinds of infiltrating immune cells, including CD4 + T cells, CD8 + T cells, B cells, macrophages, neutrophils, and dendritic cells. The outcomes revealed that all 4 genes expression levels had meaningful associations with the dendritic cells (Figure 7). Our results suggested that dendritic cells were significantly associated with DLBCL. Though few are recognized about dendritic cells’ function in tumor immune response in the context of DLBCL, we also investigated and found some. Lymphoma immune checkpoint blocking therapy could be effective via triggering a complex network, due to dendritic cells playing a hub role in antitumor responses. 27
A study also clarified a point that dendritic cells as mediators of antitumor factor production by investigating the role of CD11c positive dendritic cells in DLBCL, indicating that dendritic cells affected the growth of lymphoma.28,29 Dendritic cells were discovered to show a vital function in the initiation of adaptive immune responses. When motivated, it produced regulation of certain molecules, on whose surface shared in T-lymphocyte stimulation.29,30
There are some limitations in our study. Firstly, our study is based on the GEO public database, this ferroptosis prognostic model needs to be further verified in prospective, multicenter, real-world studies. Secondly, our study only preliminarily revealed the relationship between ferroptosis related-genes and prognosis. The underlying mechanisms need to be further explored by experiment studies. Quantitative real-time polymerase chain reaction, Western blot and immunohistochemistry would be performed in our future study to identify the expression levels of the 4 genes in diffuse large B-cell lymphoma. We would also evaluate the clinical values of the genes. Moreover, further in vitro and in vivo experiments may be used to investigate the biological functions of the genes. Besides TNM stage, clinical subtype group that we have explored in this study. We will collect samples owing to clinical features in our future study. We will try to identify the ferroptosis-related correlation between the gene signature (Model 1) and the clinical features such as giant tumor, bone marrow invasion, central invasion, etc We would also evaluate more potential clinical values of the gene signature.
Conclusions
In summary, we constructed a novel ferroptosis-related prognostic model in DLBCL patients. Ferroptosis-related signature may play a potential role in the process of antitumor development and it could serve as therapeutic targets for DLBCL.
Materials and Methods
Patient Publicly Available Data Acquisition and Ferroptosis Gene Sets
Two RNA-sequencing (RNA-seq) datasets and matching clinical data of DLBCL patients in GSE11318 (GPL570,n = 203) and GSE57611 (n = 37) were downloaded from Gene Expression Omnibus (GEO; http://www.ncbi.nlm.nih.gov/geo/) cohort. The gene expression outlines were standardized by the “scale” method offered in the R package “limma”. The 2 datasets were delocked batch effect, and 240 DLBCL patients were used as the training set in total. The PCA analysis was used to assess the performance of batch removal. Meanwhile, 412 DLBCL patients from the GSE10846 cohort as validation set were completely enrolled. Then, the list of 393 ferroptosis-related genes was gathered from the FerrDb database (http://www.zhounan.org/ferrdb/ operations/download.html) 31 and literature search,which were provided in Supplemental Table S1. Besides, we used the GSE32918, GSE4475 to validate the model to increase the generability of the established model. The flow chart of this study was presented in Supplemental Figure S1.
Data Cleaning
After batch removal of GSE13118 and GSE57611, we matched the patients’ gene dataset with the clinical dataset. 229 people were remaining after we remove the population whose OS months were 0 and the survival status of OS months was missing. 221 intersection genes were obtained after Ferroptosis-related genes were crossed with the training population genes profile. The dataset including 221 prognostic-related gene expressions of 229 people was filtered to remove genes with the condition that more than half amount of the population’s gene expression was 0.f. Taking the median of each gene as the cut-off, the expression data of each gene was converted into categorical data. We did univariate cox regression in sequence for the 221 genes and selected the gene with a p-value less than 0.05. In this step, the selected genes were invoked as candidates for the LASSO cox regression model in the following analysis process.
Construction and Validation of a Prognostic Ferroptosis-Related Gene Signature
To screen Ferroptosis-related genes with prognostic values, we performed Univariate Cox analysis of OS. Log-rank test were used to adjust the significance of the analysis. The LASSO-penalized Cox regression analysis was utilized to select the best variables set and minimize the risk of overfitting. The “glmnet” R package was used to conduct the LASSO algorithm. The normalized expression matrix of candidate prognostic-related genes were regarded as the independent variables, and the overal. Survival time and living status among DLBCL patients in the training datasets were considered as the reaction markers.
Ten-fold cross-validation following the 1 standard error criteria was used to determined the penalty penalty parameter (λ) for the model. The partial likely deviance distribution of each parameter(λ)and the coefficients results distribution when using different variables were shown as the principle of how the final variables set were selected. The stepwise method was utilized to optimize the variable combination with the loweest AIC value. The risk score of the collected population was estimated conferring to sum of product of the standardized expression level of each selected gene in final set and its matching regression coefficients. The formula was founded as follows:
Estimation of Risk Score Signature, Construction, and Assessment of the Nomogram Combined Signature and Clinical Information
To show the correlation result of the established risk score model with the clinical information, we added some analysis combining the established risk score with the clinical information. To ensure the completeness of data, we deleted the individuals with any missing value in the engaged variables. The process of analyzing included 3 steps. First, after removing the single variable with the log-rank value of cox regression higher than 0.05, we built a multivariate model with all statistically significant clinical variables and the obtained risk score as an independent variable. The Kaplan-Meier curve and log-rank test were applied to estimate the connection between risk score and OS situation. The proportional hazards assumption was confirmed for each factors before being engaged in Cox regression models. Multivariate Cox regression models were implemented to explore the connection between risk score stages and OS in the attendance of identified clinical hazard features. The forest plot was applied to display the Hazard Ration, 95% CI and p-value of every univariate and multivariate model by the R package ‘forestplot’. Second,We drew a nomogram plot of the multivariate model to help clinical doctors to understand and apply the model. Third, the calibration plot,ROC curve and DCA plot were used to evaluate the performance of the nomogram. The calibration plot was used to measure the time-dependent precision of the multivariate model. The ROC analysis was utilized to calculate AUC and check the prediction accuracy for the multivariate model. We displayed the time-dependent ROC plot of every single clinical information-based model and the multivariate model in 1-year, 3-year, and 5-year, respectively. The time-dependent DCA plot was used to evaluate the clinical value of the multivariate model,which was conducted by the “stdca” R package to show the comparison of the models with each single clinical factors and the full model.
Functional Enrichment Analysis and PPI Network
Metascape was employed to handling Gene Ontology (GO) and Kyoto Encyclopedia of Genes and Genomes (KEGG) analyses established using genes in univariate Cox analysis of OS. PPI(Protein-Protein Interaction) network was established in The STRING database (http://string-db.org/). 32 We used a spring model in STRING to generate the network images. Nodes were modeled as masses and edges as springs; the final position of the nodes in the image was computed by minimizing the ‘energy’ of the system.
Discovery of the Ferroptosis Subtypes
To recognize potential immune subtypes and gene components, the ferroptosis-related genes signfiicantly associated with OS in univariate cox analysis at first(n = 221)were clustered based on their expression sketches matrix. “1-Pearson correlation” distance metric was set as the partition around medoids algorithm, and 500 bootstraps were executed with each embroiling 80% patients in the training cohort. In total, 2 to 7 was set as the range for number of the cluster sets, and the optimum subset was identified by assessing the consensus matrix and the consensus cumulative distribution function. Then, the identified ferroptosis subtypes then were endorsed in the validation group using the same cluster settings.
TIMER Database Analysis
Tumor Immune Estimation Resource (TIMER; https://cistrome.shinyapps.io/timer/), an interactive web gateway that could execute widespread exploration on the infiltration levels of diverse immune cells. The association of genes in the risk score model and immune cell infiltration in DLBCL was examined in TIMER. The “Gene” module is able to explore the association between genes in risk score model and immune cell infiltration levels (CD4 + T cells, CD8 + T cells, B cells, macrophages, neutrophils, and dendritic cells) using the TCGA database. TIMER was likewise advantageously to explore the connection between genes in risk score model and diverse gene marker collections of immune cells by operating the “Correlation” module. Purity-correlated partial Spearman's correlation and statistical significance were applied to assess the associations of genes in risk score model with immune infiltration. 33
Prognostic Evaluation and Ferroptosis Subtypes Validation
The ferroptosis subtypes were validated in the validation cohort with the same settings. The foretelling values of the ferroptosis subtypes were assessed via P-value of log-rank test in cox regression. The uniformity of ferroptosis subtypes between the training and validation groups was computed by intragroup percentage of risk group, stage, clinically distinct subtype. Meanwhile, Pearson correlation coefficients were used to determine the association of ferroptosis subtypes with risk group, stage, clinically distinct subtype.
External Validation Using the Online Database
Hub genes in LASSO cox were surveyed from several online databases as follows: (1) Oncomine analysis. The Oncomine database (www.oncomine.org) is a platform including different cancer-related cohorts. Genes expression levels of diseases could be confirmed in Oncomine analysis. 34 (2) Gene correlation analysis in GEPIA. The online database Gene Expression Profiling Interactive. 35 (3) cbioportal analysis. The cBioPortal for Cancer Genomics (http://cbioportal.org) can visualize gene alteration frequencies and gene alteration patterns in selected data sets.Genomic data types include copy-number alteration, somatic mutations, DNA methylation,mRNA and microRNA expression, and so on. 36 (4) PrognoScan analysis. PrognoScan database (http://www.abren.net/PrognoScan/) was avaliable for the relationships between gene expression and patients’ prognoses. 37
Statistical Analysis
The OS between diverse crowds was compared by Kapln–Meier curve with the log-rank test. Cox regression analyses including univariate and multivariate were applied to recognize independent predictors of OS. R software(Version 3.5.3) was used to completed all statistical analyses. p-value less than 0.05 was considered statistically significant.
Supplemental Material
sj-tif-1-tct-10.1177_15330338221147772 - Supplemental material for Identification and Development of a 4-Gene Ferroptosis Signature Predicting Overall Survival for Diffuse Large B-Cell Lymphoma
Supplemental material, sj-tif-1-tct-10.1177_15330338221147772 for Identification and Development of a 4-Gene Ferroptosis Signature Predicting Overall Survival for Diffuse Large B-Cell Lymphoma by Huitao Wu, Junyan Zhang, Li Fu, Rilige Wu, Zhenyang Gu, Chengliang Yin and Kunlun He in Technology in Cancer Research & Treatment
Supplemental Material
sj-tif-2-tct-10.1177_15330338221147772 - Supplemental material for Identification and Development of a 4-Gene Ferroptosis Signature Predicting Overall Survival for Diffuse Large B-Cell Lymphoma
Supplemental material, sj-tif-2-tct-10.1177_15330338221147772 for Identification and Development of a 4-Gene Ferroptosis Signature Predicting Overall Survival for Diffuse Large B-Cell Lymphoma by Huitao Wu, Junyan Zhang, Li Fu, Rilige Wu, Zhenyang Gu, Chengliang Yin and Kunlun He in Technology in Cancer Research & Treatment
Supplemental Material
sj-tif-3-tct-10.1177_15330338221147772 - Supplemental material for Identification and Development of a 4-Gene Ferroptosis Signature Predicting Overall Survival for Diffuse Large B-Cell Lymphoma
Supplemental material, sj-tif-3-tct-10.1177_15330338221147772 for Identification and Development of a 4-Gene Ferroptosis Signature Predicting Overall Survival for Diffuse Large B-Cell Lymphoma by Huitao Wu, Junyan Zhang, Li Fu, Rilige Wu, Zhenyang Gu, Chengliang Yin and Kunlun He in Technology in Cancer Research & Treatment
Supplemental Material
sj-tif-4-tct-10.1177_15330338221147772 - Supplemental material for Identification and Development of a 4-Gene Ferroptosis Signature Predicting Overall Survival for Diffuse Large B-Cell Lymphoma
Supplemental material, sj-tif-4-tct-10.1177_15330338221147772 for Identification and Development of a 4-Gene Ferroptosis Signature Predicting Overall Survival for Diffuse Large B-Cell Lymphoma by Huitao Wu, Junyan Zhang, Li Fu, Rilige Wu, Zhenyang Gu, Chengliang Yin and Kunlun He in Technology in Cancer Research & Treatment
Supplemental Material
sj-tif-5-tct-10.1177_15330338221147772 - Supplemental material for Identification and Development of a 4-Gene Ferroptosis Signature Predicting Overall Survival for Diffuse Large B-Cell Lymphoma
Supplemental material, sj-tif-5-tct-10.1177_15330338221147772 for Identification and Development of a 4-Gene Ferroptosis Signature Predicting Overall Survival for Diffuse Large B-Cell Lymphoma by Huitao Wu, Junyan Zhang, Li Fu, Rilige Wu, Zhenyang Gu, Chengliang Yin and Kunlun He in Technology in Cancer Research & Treatment
Supplemental Material
sj-tif-6-tct-10.1177_15330338221147772 - Supplemental material for Identification and Development of a 4-Gene Ferroptosis Signature Predicting Overall Survival for Diffuse Large B-Cell Lymphoma
Supplemental material, sj-tif-6-tct-10.1177_15330338221147772 for Identification and Development of a 4-Gene Ferroptosis Signature Predicting Overall Survival for Diffuse Large B-Cell Lymphoma by Huitao Wu, Junyan Zhang, Li Fu, Rilige Wu, Zhenyang Gu, Chengliang Yin and Kunlun He in Technology in Cancer Research & Treatment
Supplemental Material
sj-xls-7-tct-10.1177_15330338221147772 - Supplemental material for Identification and Development of a 4-Gene Ferroptosis Signature Predicting Overall Survival for Diffuse Large B-Cell Lymphoma
Supplemental material, sj-xls-7-tct-10.1177_15330338221147772 for Identification and Development of a 4-Gene Ferroptosis Signature Predicting Overall Survival for Diffuse Large B-Cell Lymphoma by Huitao Wu, Junyan Zhang, Li Fu, Rilige Wu, Zhenyang Gu, Chengliang Yin and Kunlun He in Technology in Cancer Research & Treatment
Supplemental Material
sj-xlsx-8-tct-10.1177_15330338221147772 - Supplemental material for Identification and Development of a 4-Gene Ferroptosis Signature Predicting Overall Survival for Diffuse Large B-Cell Lymphoma
Supplemental material, sj-xlsx-8-tct-10.1177_15330338221147772 for Identification and Development of a 4-Gene Ferroptosis Signature Predicting Overall Survival for Diffuse Large B-Cell Lymphoma by Huitao Wu, Junyan Zhang, Li Fu, Rilige Wu, Zhenyang Gu, Chengliang Yin and Kunlun He in Technology in Cancer Research & Treatment
Footnotes
Authors’ Contributions
KLH, CLY and HTW have made a substantial contribution to the concept and design of the article. HTW and JYZ analyzed data for the article and drafted the article. LF, RLGW and ZYG revised it critically for important intellectual content. All authors approved the version to be published, and they have agreed to be accountable for all aspects of the work in ensuring that questions related to the accuracy or integrity of any part of the work are appropriately investigated and resolved.
Declaration of Conflicting Interests
The author(s) declared no potential conflicts of interest with respect to the research, authorship, and/or publication of this article.
Funding
The author(s) disclosed receipt of the following financial support for the research, authorship, and/or publication of this article: This work was supported by 2020 China Industrial Technology Infrastructure Public Service Platform Project (grant number 2020-0103-3-1), and independent research project of Medical Engineering Laboratory of Chinese PLA General Hospital (grant number 2022SYSZZKY26).
Availability of Data and Materials
Consent for Publication
The authors confirmed that this work can be published. The content of this manuscript is original, and it has not yet been accepted or published elsewhere.
Supplemental Material
Supplemental material for this article is available online.
References
Supplementary Material
Please find the following supplemental material available below.
For Open Access articles published under a Creative Commons License, all supplemental material carries the same license as the article it is associated with.
For non-Open Access articles published, all supplemental material carries a non-exclusive license, and permission requests for re-use of supplemental material or any part of supplemental material shall be sent directly to the copyright owner as specified in the copyright notice associated with the article.