
Abstract
Background
To develop a fully automated in-house gamma analysis software for the “Cheese” phantom-based delivery quality assurance (QA) of helical tomotherapy plans.
Methods
The developed in-house software was designed to automate several procedures, which need to be manually performed using commercial software packages. The region of interest for the analysis was automatically selected by cropping out film edges and thresholding dose values (>10% of the maximum dose). The film-measured dose was automatically aligned to the computed dose using an image registration algorithm. An optimal film scaling factor was determined to maximize the percentage of pixels passing gamma (gamma passing rate) between the measured and computed doses (3%/3 mm criteria). This gamma analysis was repeated by introducing setup uncertainties in the anterior–posterior direction. For 73 tomotherapy plans, the gamma analysis results using the developed software were compared to those analyzed by medical physicists using a commercial software package.
Results
The developed software successfully automated the gamma analysis for the tomotherapy delivery quality assurance. The gamma passing rate (GPR) calculated by the developed software was higher than that by the clinically used software by 3.0%, on average. While, for 1 of the 73 plans, the GPR by the manual gamma analysis was higher than 90% (pass/fail criteria), the gamma analysis using the developed software resulted in fail (GPR < 90%).
Conclusions
The use of automated and standardized gamma analysis software can improve both the clinical efficiency and veracity of the analysis results. Furthermore, the gamma analyses with various film scaling factors and setup uncertainties will provide clinically useful information for further investigations.
Introduction
Patient-specific quality assurance (QA) is an essential routine process for the safe delivery of radiation treatment. This process typically includes pretreatment delivery verification which identifies discrepancies between calculated and delivered radiation doses. So far, the delivery quality assurance (DQA) processes that use water equivalent phantoms with inserted ionization chambers/films or detector arrays1–6 are well-established methods. The gamma analysis (GA) 7 has been commonly used to compare the measured doses to the calculated doses.
Recently, there has been a strong interest in developing and clinically implementing log-based (or phantom-less) patient-specific QA (PSQA) methods.8–10 Many studies have evaluated the feasibility of a log-based PSQA for tomotherapy.8,9,11–13 However, for the tomotherapy PSQA, since no log-based commercial software is currently available, the cylindrical Virtual Water™ phantom (Gammex RMI, Middleton, WI; called the “Cheese” phantom), which is available upon the purchase of a tomotherapy machine, is widely used.
While detailed guidelines for PSQA procedures for helical tomotherapy have been published in the American Association of Physicists in Medicine (AAPM) Task Group (TG) reports,14,15 the GA software provided by the vendor and commercial software has several shortcomings. First, performing a GA using the vendor-provided and commercial software packages involves several procedures that need to be manually performed by medical physicists, such as the determination of region of interest (ROI), alignment of the film to the dose calculation grids, determination of film scaling factor (FSF), and creation of the report. In consequence, the GA results often may vary depending on the knowledge and experience levels of the medical physicist. Second, it is labor-intensive to identify the reason for the failure when the GA result does not meet the criteria. When the DQA fails, the AAPM TG-148 report recommends that the medical physicist should investigate the causes. Further investigations typically necessitate multiple analyses by adjusting and/or verifying several parameters, including the ROI, film alignment, and FSF.
To overcome these problems, an automated in-house GA software package was developed for the Cheese phantom-based pretreatment beam verification for helical radiotherapy plans, which complies with the guidelines provided in the AAPM TG-148 and TG-218 reports. The developed in-house software was designed to automate all of the aforementioned manual procedures with the use of standardized parameters, thereby minimizing the user-dependency of the GA results. Furthermore, the developed software is capable of not only finding the maximum gamma passing rate (GPR; percentage of pixels passing gamma) but also providing clinically relevant information, such as GPRs calculated under various FSFs and setup uncertainties.
Methods
Development of in-House Automated DQA Software
Automation in Developed Software
The workflow of the GA for the tomotherapy pretreatment beam verification is shown in Fig. 1. The GA that uses commercial software packages, such as TomoDQA Station (Accuray Inc., Sunnyvale, CA, USA) or Radiological Imaging Technology (RIT, Inc., Colorado Springs, CO, USA), requires users to manually perform several steps. However, the newly-developed software has automated the following procedures: (1) selection of ROI for GA, (2) determination of an optimal FSF, (3) alignment of the film-measured dose to the computed dose, and (4) repeated GA with setup errors in the anteroposterior (A-P) direction.

Workflow comparison between the gamma analyses methods using (a) commercial software and (b) the developed software.
First, the ROI selection for the GA was automated by only including regions inside 10% of each height and width from the film edge and doses larger than 10% of the maximum dose. Using the TomoDQA Station, only a rectangular region can be selected manually, which leaves room for user-dependent and nonstandardized GA. For instance, GA results could be inaccurate if the predefined ROI includes the phantom edge, in which the film measurement can be incorrect. This procedure to exclude the near-phantom edge region should be manually performed for the GA, even using a more advanced commercial software package such as RIT.
In the developed software, the location of the phantom edge was automatically calculated by detecting a horizontal line, along which the GPR was lower than 20%; for this calculation of the GPR, only a central part of each horizontal line (approximately 10 cm; 300 pixels) was chosen to focus the analysis on high dose region as illustrated in Fig. 2. When multiple lines with GPR < 20% were found, the innermost line was determined to be the phantom edge. This phantom edge detection was performed only in 20% top and bottom regions of the film, in which the phantom edge can be located. Once the phantom edge was detected, the predefined ROI was modified to exclude 10 mm from the phantom edge, following the recommendation by the AAPM TG-148 report. 14

(a) Graphical illustration of the regions subjected to the suggested phantom edge detection algorithm (20% top and bottom regions of the film), (b) comparison of the dose distributions in the region near the phantom edge between the measured and calculated doses.
Second, an optimal FSF was automatically determined by performing GA with a range of FSFs (0.9–1.1 with an interval of 0.1) and finding an FSF with a maximum GPR. These GA results with various FSFs can provide additional information that would be useful for further investigation.
Third, the film-measured dose was automatically aligned to the computed dose in two steps. The first step of the automatic registration was to find the A-P location of the film inserted in the Cheese phantom. The film A-P location was calculated using the geometric relationship (A-P distance) between the film plane and the metal balls in the phantom as illustrated in Figure 3. Specifically, the A-P coordinates of the film plane were calculated by adding the film-to-metal ball distance in the A–P direction (94.7 mm, Fig 3) to the red laser A–P location (metal ball location), available in the DICOM RT plan file. This was followed by two-dimensional image registration using a built-in MATLAB multimodal registration algorithm. In the automatic image registration, a mutual information-based image metric was minimized to find optimal translation and rotation vectors using a global optimization algorithm (One Plus One Evolutionary Optimizer).
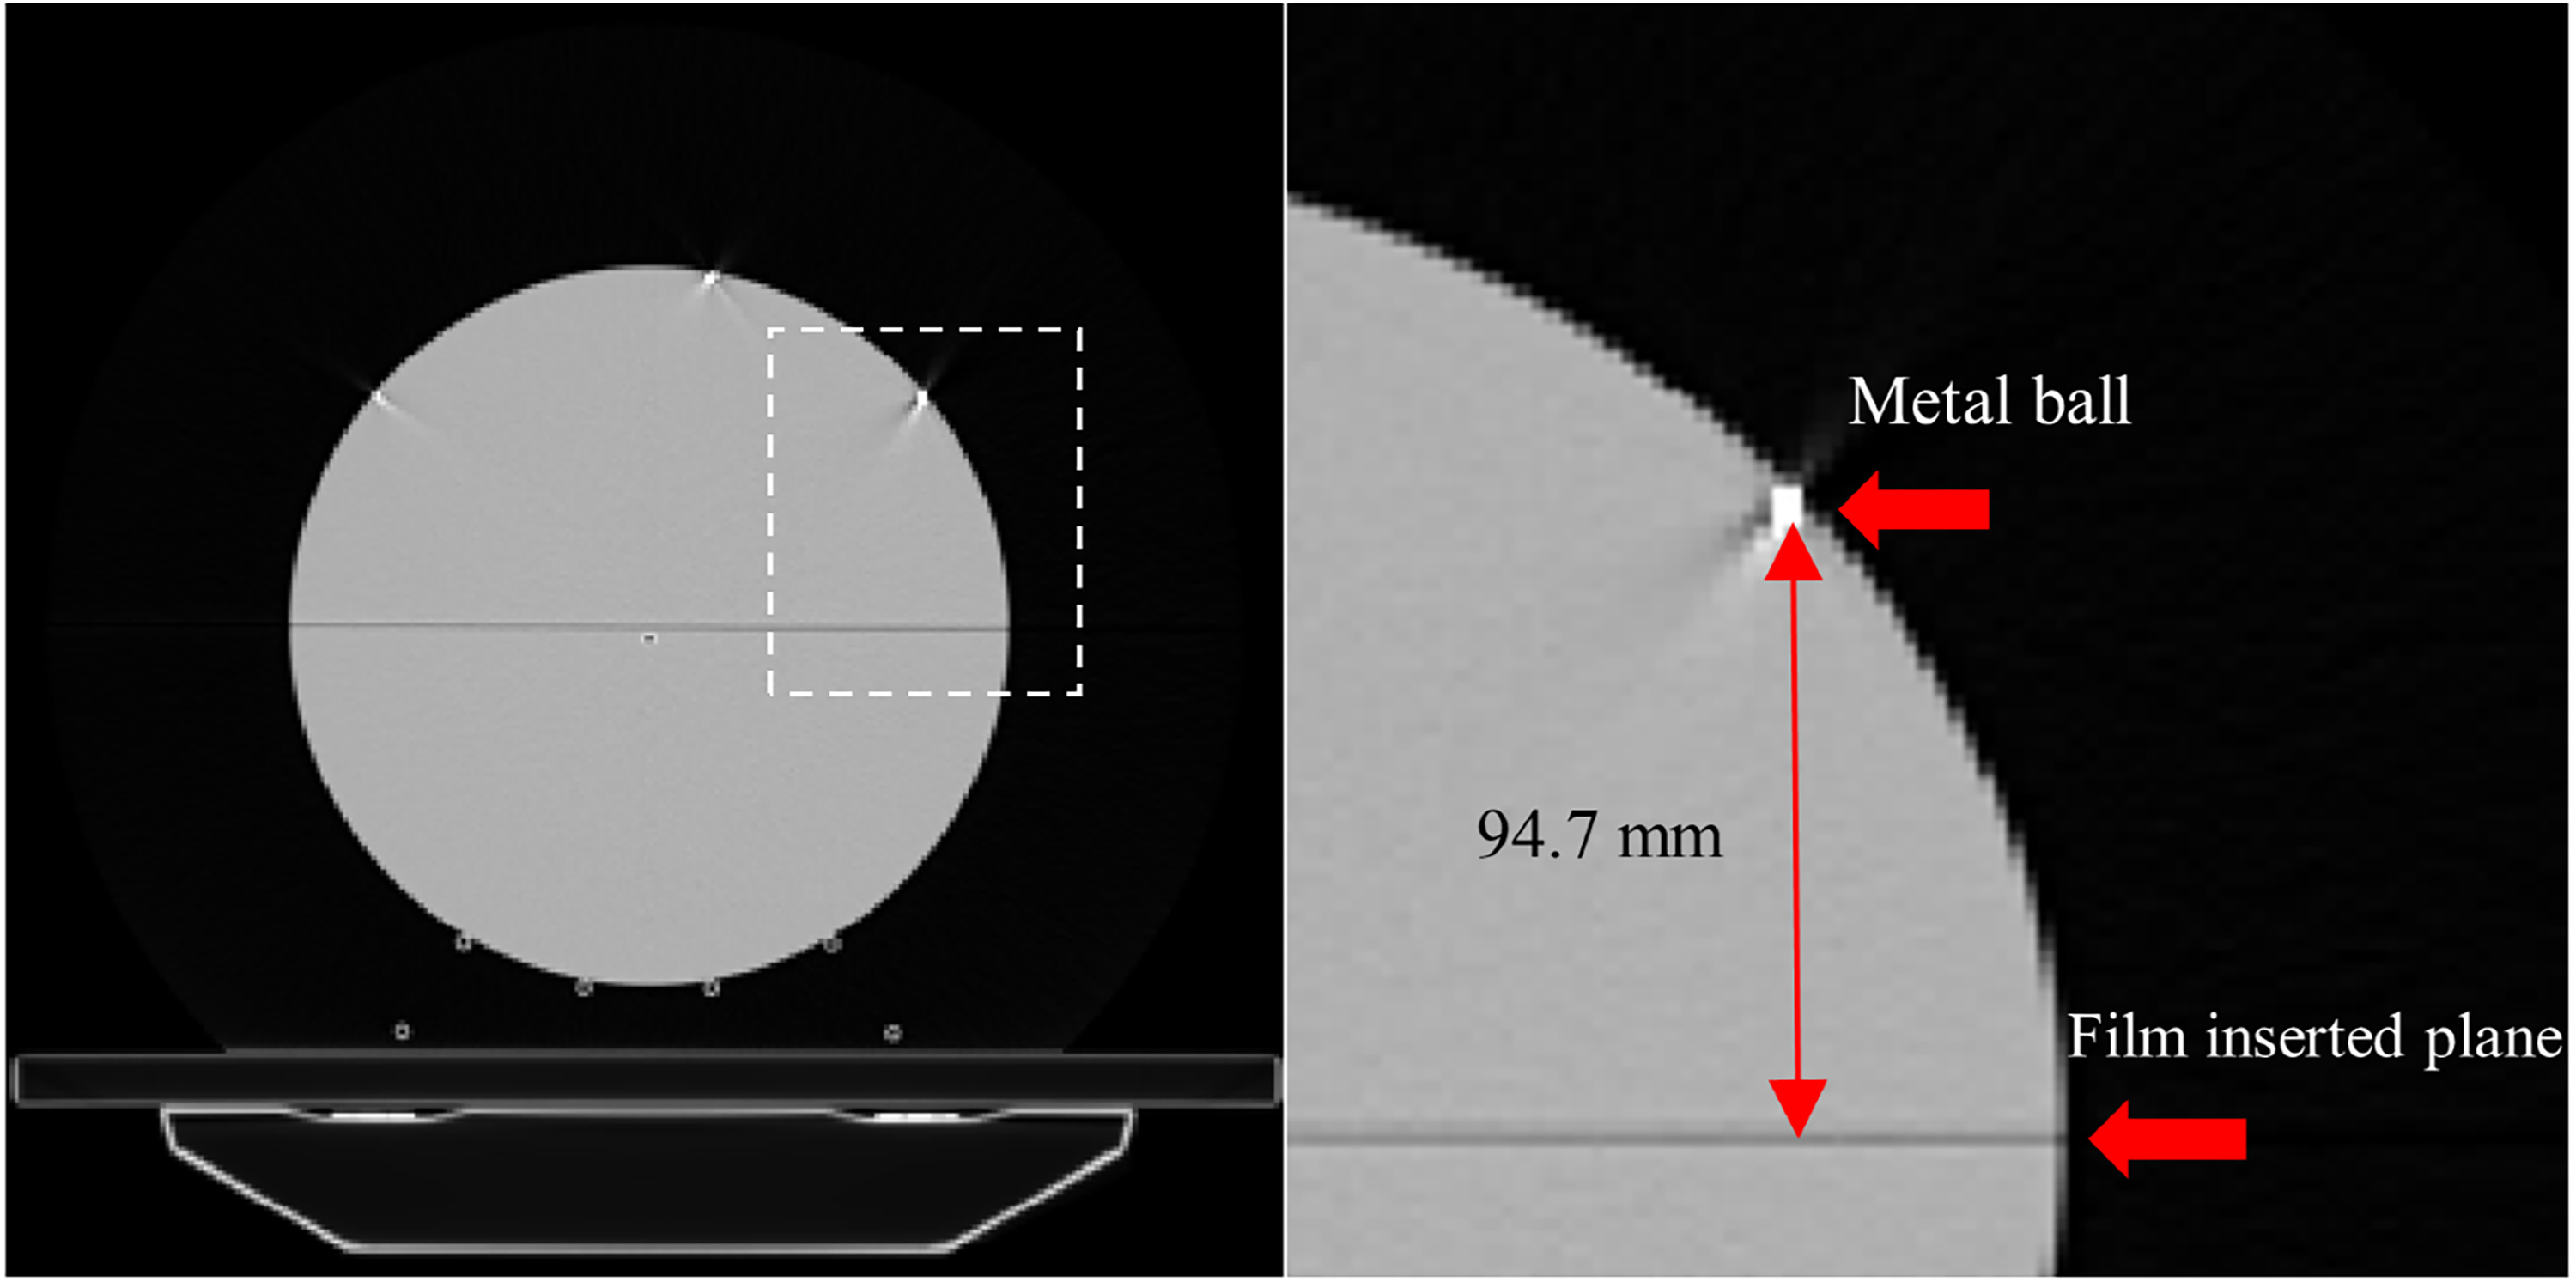
Geometric relationship between the metal balls and film-inserting plan. (a) Axial view of computed tomography (CT) scan of the Cheese phantom, and (b) magnified view of the dashed rectangle region in (a).
Fourth, GPRs were calculated at various film-aligning A-P locations, simulating setup uncertainty in the A–P direction. This perturbation analysis helped assess the setup uncertainty in the film-based measurement. Specifically, GA was conducted with setup uncertainties of −3.0 to 3.0 mm at intervals of 0.5 mm, in addition to the GA performed with the exact A-P film location, calculated in the film alignment process.
As a result of the development of this software, all the institution- and machine-specific GA parameters can be saved as a predefined configuration file. In addition, all of the automated steps can also be manually implemented, if so desired.
Further Details of Gamma Analysis
Film optical density was obtained using VIDAR TWAIN version 5.2 software (Vidar Systems Corporation, Hendon, VA, USA) at red channel and was converted to a radiation dose16–19 using a predefined relationship between the film optical density and the corresponding radiation dose. A 5 × 5 median filter was applied to film-measured dose to reduce noise according to the recommendation by the AAPM TG-218 report. 15
The gamma index was calculated using the formula described in the previous study by Low et al. 7 The GA was performed using a criterion of 90% GPR with a 3% dose difference, and 3 mm distance-to-agreement, as recommended in the AAPM TG-148 report. 14 The percentage dose difference was calculated with respect to the maximum calculated dose (global normalization). The film-measured and computed doses were resampled with a pixel dimension of 1.0 × 1.0 mm2.
Performance Evaluation on Clinical Cases
The performance of the developed in-house software was evaluated for 73 tomotherapy intensity-modulated radiation therapy (IMRT) plans, which were delivered by three tomotherapy machines (Machine 1: TomoTherapy® HD, Machines 2 and 3: TomoTherapy® HDA; Accuray, Inc.). To evaluate the performance of the developed in-house software, the GA results were compared to those obtained using RIT version 6.8, which was in clinical use. The treatment sites of the IMRT plans are summarized in Figure 4. All of the DQAs for these plans were performed using the Cheese phantom with a radiochromic EBT3 film (Ashland Specialty Ingredients, Bridgewater, NJ, USA). The voxel dimensions of the phantom CT images were 1.9 × 1.9 × 3.0 mm3 (machines 1 and 3) or 2.0 × 2.0 × 3.0 mm3 (machine 2).

Treatment sites for 73 treatment plans with the specific treatment machines. Abbreviations: PALN, para-aortic lymph node; PNS, paranasal sinus.
Film calibration was performed monthly using flattening filter-free 6 MV x-ray beams of an Elekta Versa HD linear accelerator (Elekta, Stockholm, Sweden). For the film calibration, several doses ranging from 0 to 18 Gy were delivered to the radiochromic film. The film optical density values were measured 9 h after the beam delivery for full film development. For the IMRT plans under consideration, two film calibration curves were used as films with two different lot numbers were used for the DQAs.
Performance Evaluation on Simulated Error Cases
The performance of the developed in-house software was further explored by introducing artificial errors to the delivery of a patient plan. The capability of the developed software to detect delivery errors was tested by simulating the phantom setup errors of 5 and 10 mm in the anterior and posterior directions; to implement these artificial errors, the Cheese phantom was shifted during the delivery of the patient DQA plan. The GA was conducted using the developed software with the A-P film-alignment uncertainties from −15 to + 15 mm at intervals of 0.5 mm.
Software Installation and Requirement
The in-house GA software was developed using MATLAB v2021 (Mathworks, Inc., Natick, MA, USA) and compiled using the MATLAB compiler to create a standalone executable. Therefore, the software can be run without MATLAB installation and the source codes can be freely downloaded from https://github.com/rising-stocks/AutomoDQA. This software has been tested on Windows 10 professional (build 19041.1415) with a 64-bit operating system.
Results
Development of in-House Automated DQA Software
While the GA using the commercial software took approximately 10 min for each patient, the developed software completed all of the analyses in one minute, requiring minimal user intervention. Figure 5 shows the graphical user interface of the developed DQA software, in which a GA for one patient is displayed. Specifically, the graphical user interface displays various comparisons between the measured and computed doses: (1) the comparison of the two-dimensional dose distributions, (2) the comparison of the doses along two user-specifiable lines (horizontal and vertical), (3) the two-dimensional distribution of the computed gamma index values, and (4) the GPRs calculated with various FSFs and film A-P alignment uncertainties.
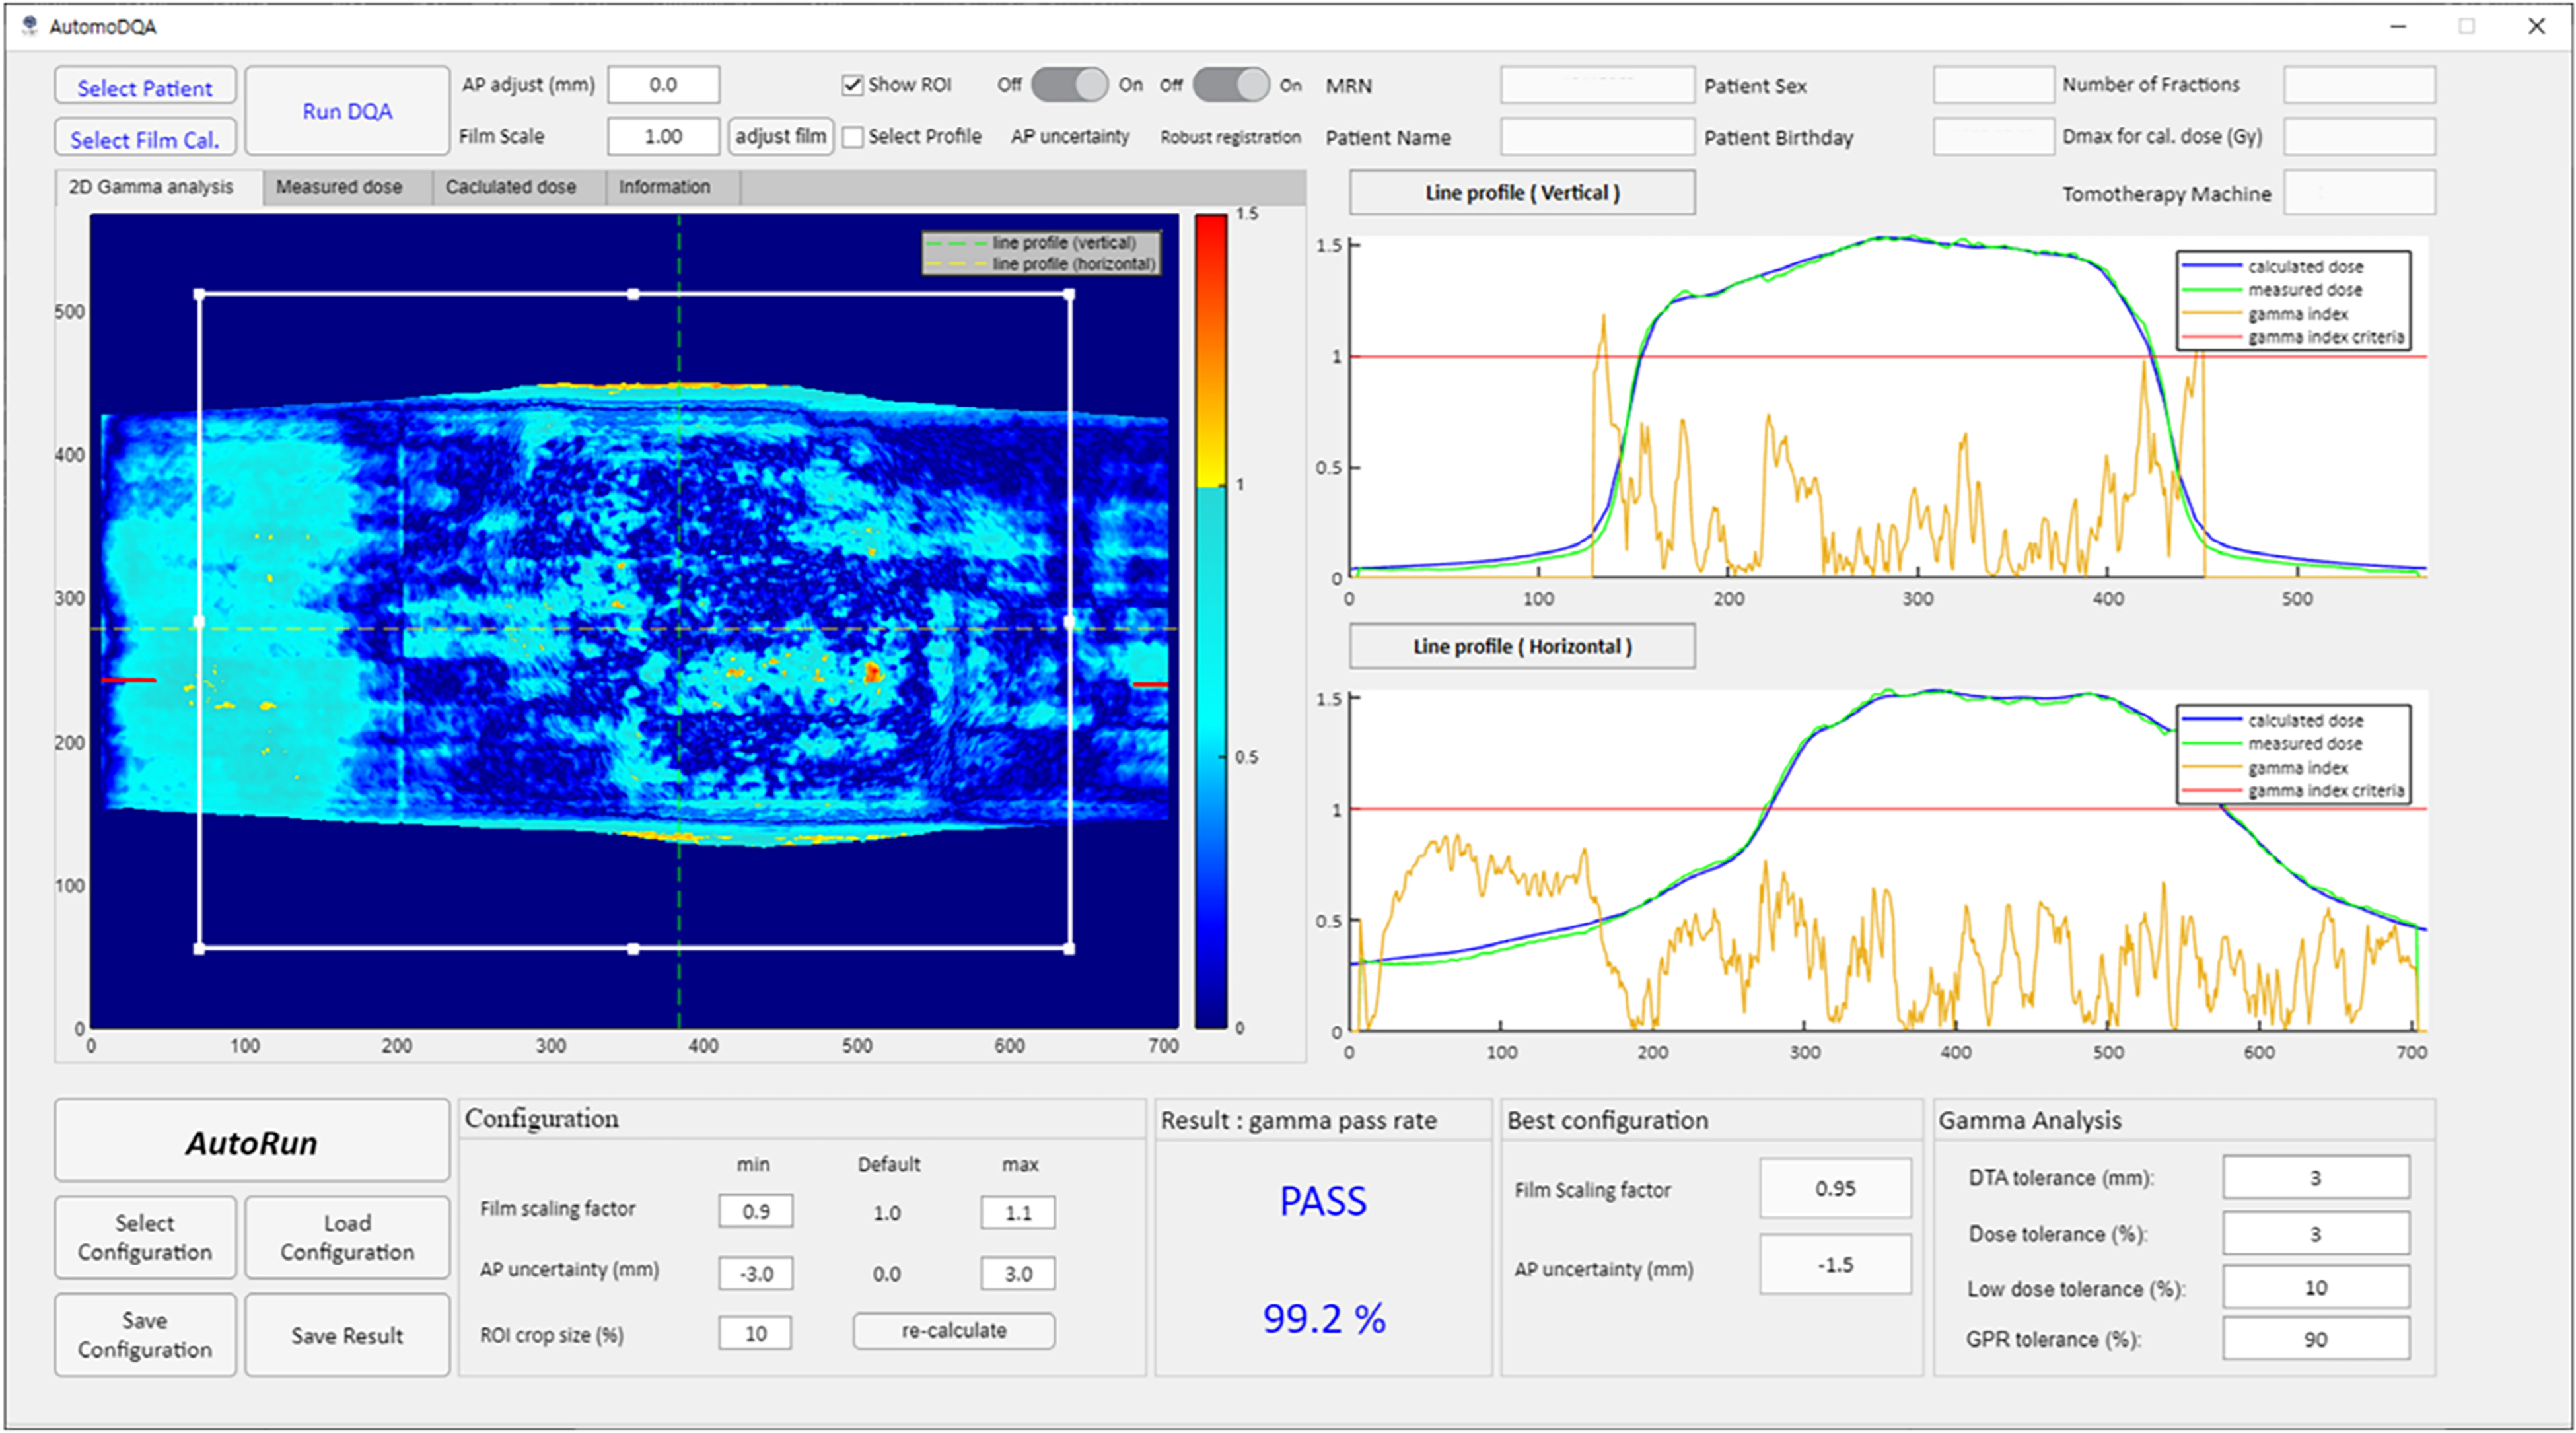
Graphical user interface of the newly developed delivery quality assurance software. Abbreviations: MRN, medical record number; GPR, gamma passing rate; DTA, distance to agreement.
Performance Evaluation on Clinical Cases
Selection of Region-of-Interest
Figure 6 demonstrates the impact of the selected ROI for the GA on the resulting GPR. In Figure 6, the two rectangular regions represent a simulated region (smaller region; represented as red dashed line), which can be defined by field medical physicists, and the auto-selected region (larger region; white solid) by the developed software. The GPR with the manually- and auto-defined regions were 91.7% (pass) and 85.7% (fail).

Illustration of the impact of ROI on DQA gamma analysis results: (a) manually-selected (red dashed) and auto-selected (white solid) ROIs overlayed on the dose distribution, and (b) gamma index distribution with the corresponding gamma passings rates of 91.7% and 85.7%, respectively. Abbreviations: ROI, region of interest; DQA, delivery quality assurance.
Figure 7 shows that the developed software successfully detected the phantom edge. While the GPR was 89.6% without an appropriate exclusion of the phantom edge region (Figure 7(b)), the correct GA in Figure 7(a) resulted in a GPR of 92.7%. Among the 73 patient cases, the phantom edge location was incorrectly calculated by the developed algorithm for only one case.
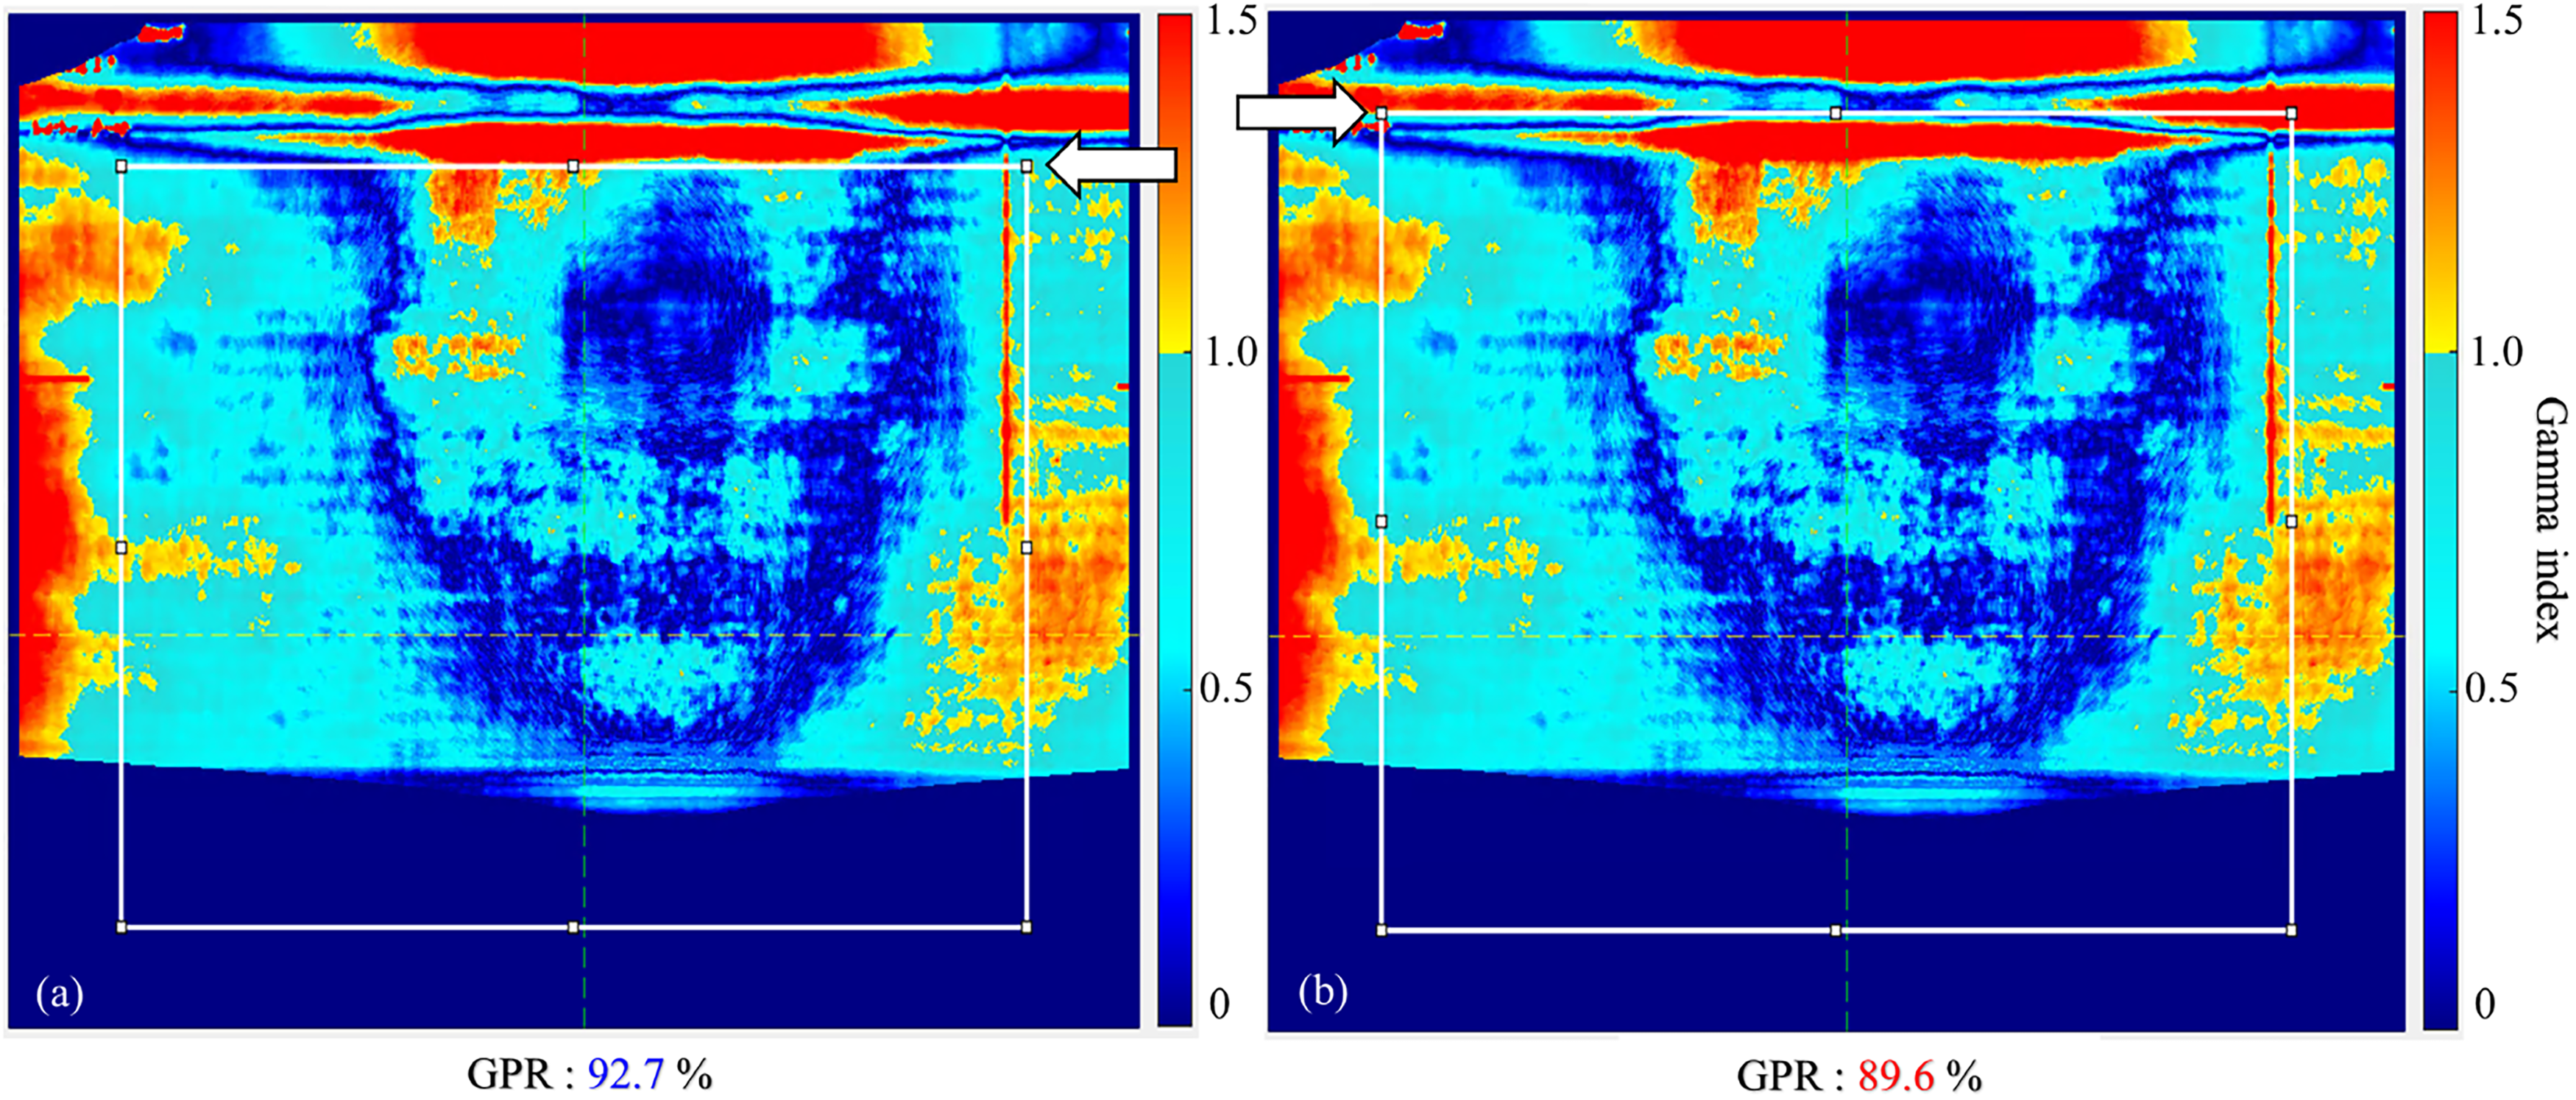
Comparison of the gamma analysis results (a) with a correct exclusion of the near-phantom edge region, and (b) with an incorrect ROI. Abbreviations: GPR, gamma passing rate; ROI, region of interest.
Automatic Determination of Film Scaling Factor
Figure 8 compares the FSFs determined by the medical physicists (RIT) and by the developed software for all the patients; for both analyses, an FSF with a maximum GPR was found. The overall trends of the FSFs obtained by the two analysis methods showed a reasonable agreement across the patient cases. The median (± standard deviation) of the FSF difference between both methods was 0.018 ± 0.021. The FSFs by the gamma analyses using RIT and the developed software for machines 1, 2, and 3 were 0.955 ± 0.030, 0.979 ± 0.030, 0.976 ± 0.027 versus 0.944 ± 0.025, 0.962 ± 0.029, 0.959 ± 0.030, respectively.
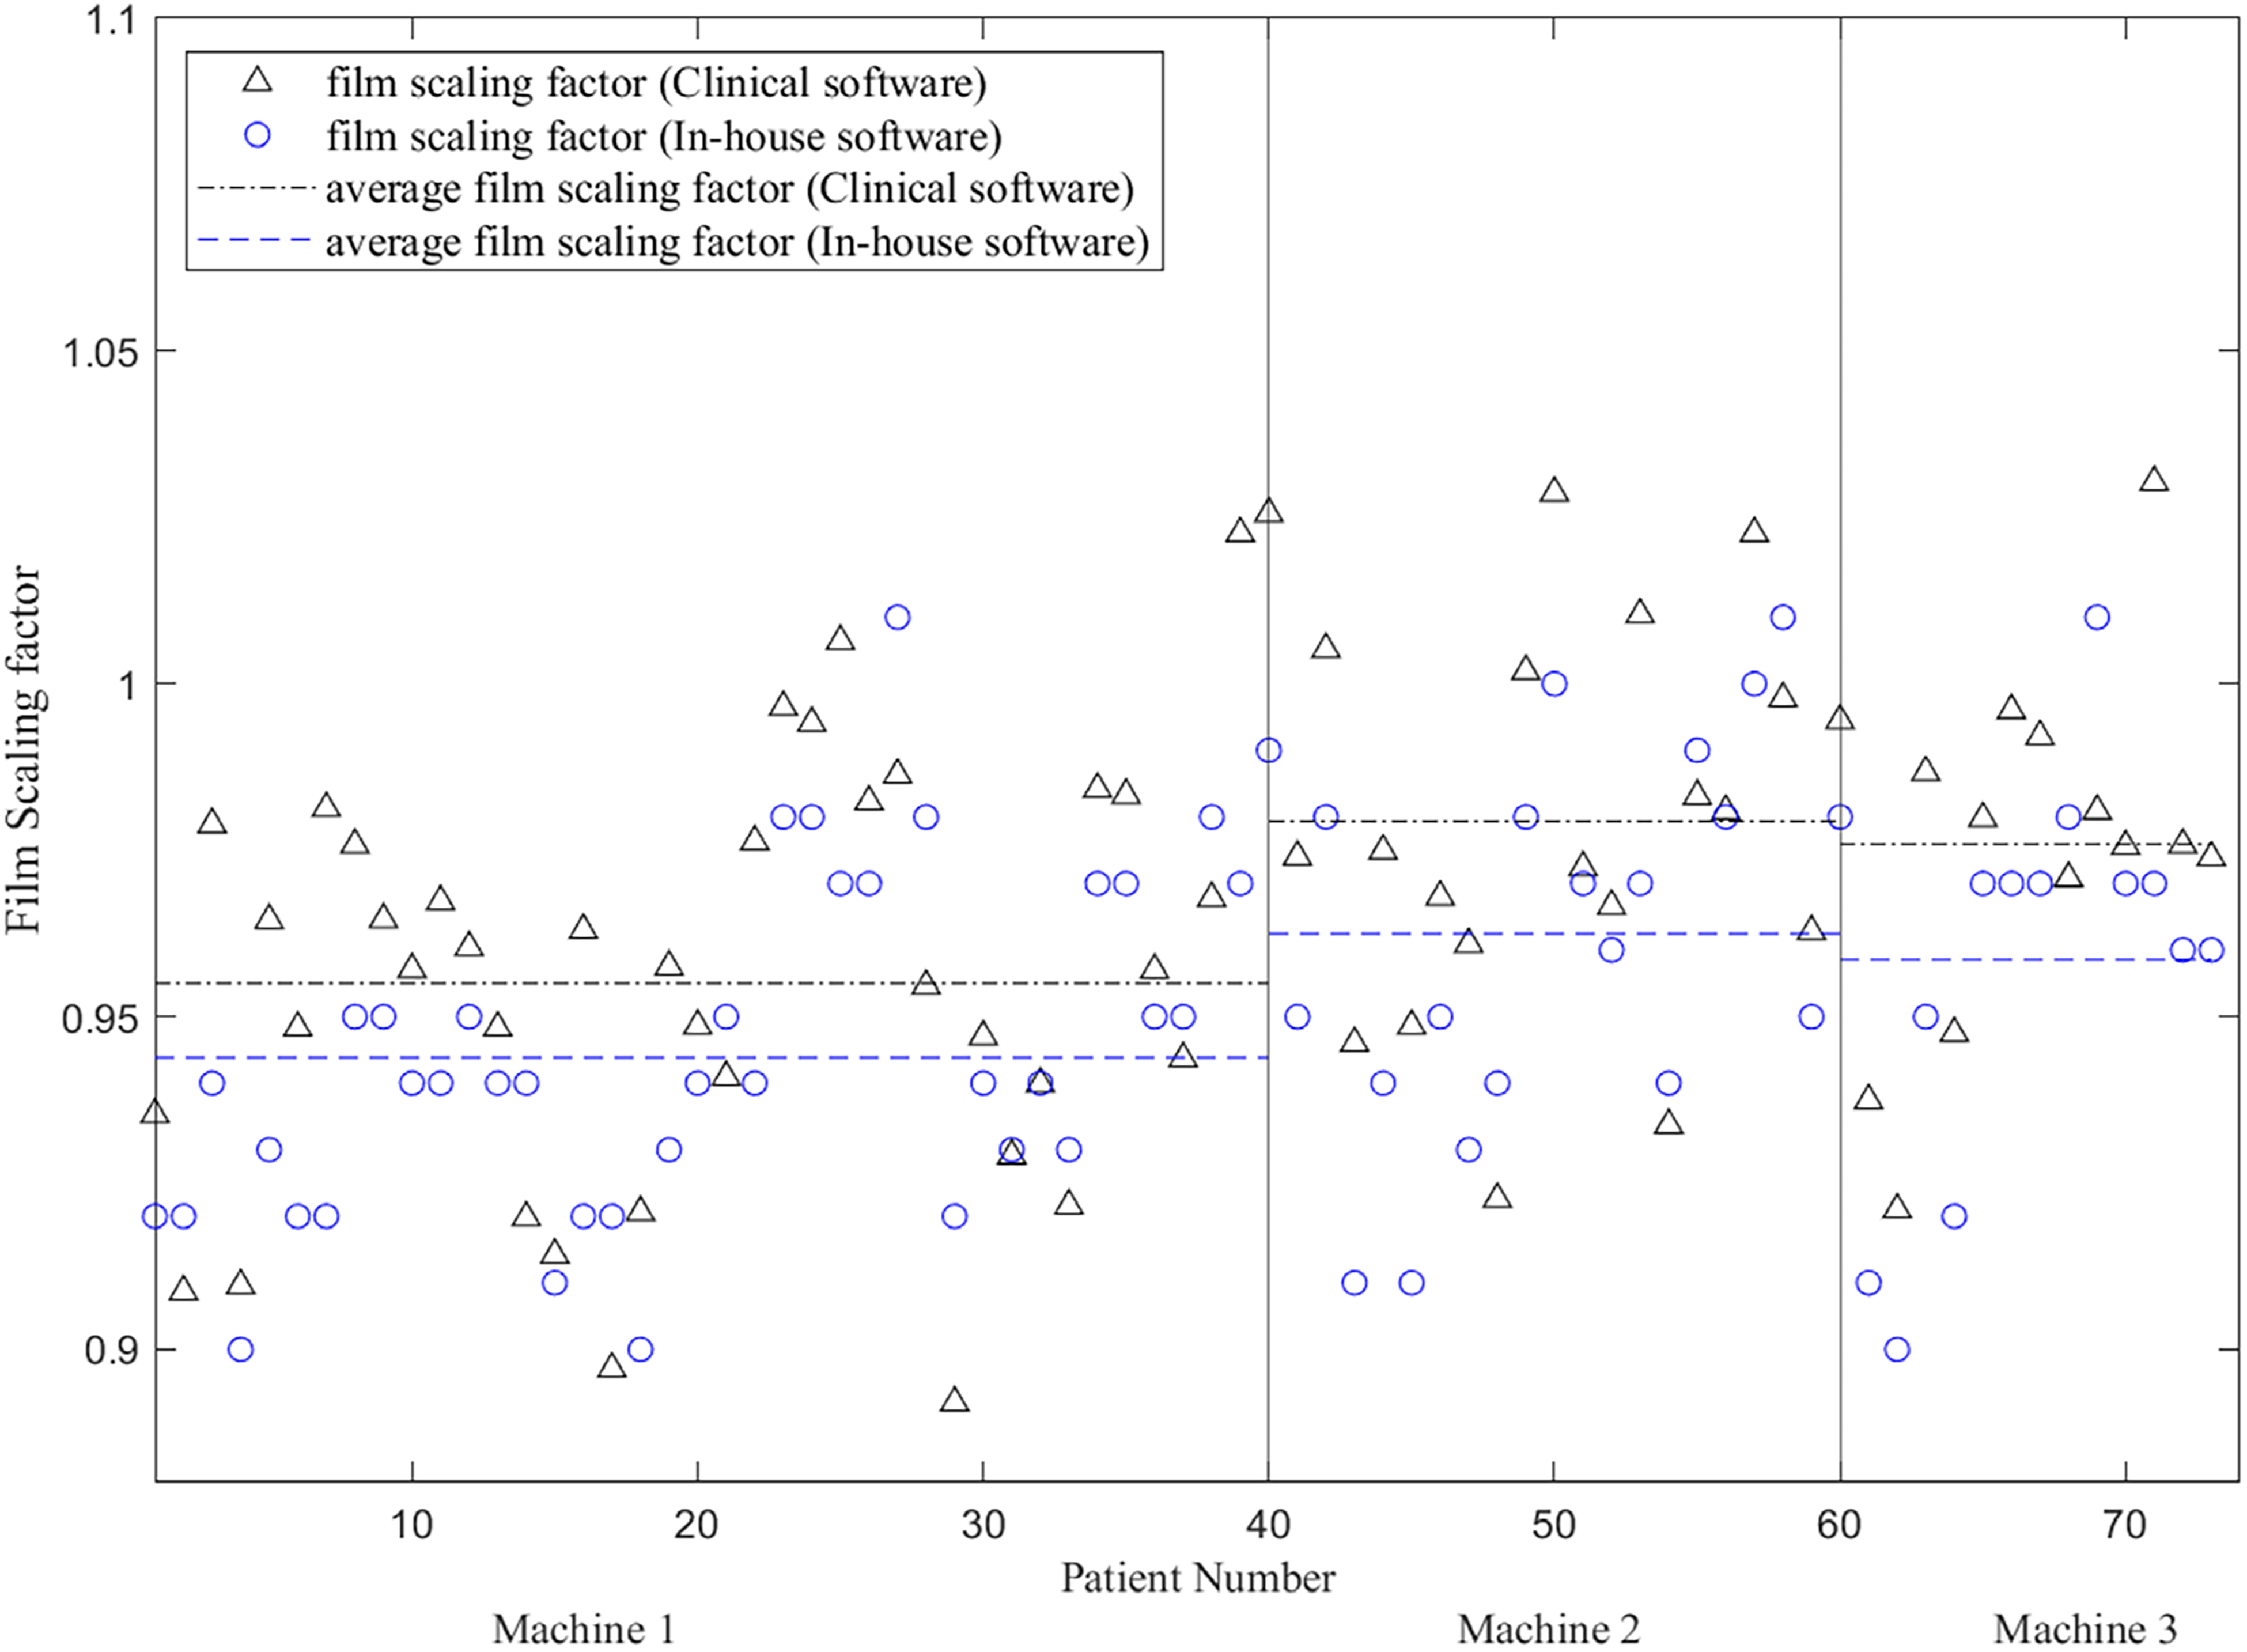
Comparison of the film scaling factors determined using clinical software (radiological imaging technology (RIT)) and the developed in-house software.
Automatic Film Alignment to Calculated Dose
Figure 9 shows an automatic image registration result between the film-measured and computed doses. As demonstrated in small difference values in Figure 9(c), the automatic image registration algorithm reasonably aligned the film-measured dose to the computed dose.

Automatic alignment of film-measured dose to calculated dose. (a) Film-measured dose distribution, (b) registered calculated dose distribution, and (c) the difference between (a) and (b).
Gamma Analysis with Setup Uncertainty
Figure 10 illustrates how the GA results can be affected by the simulated setup uncertainties. With setup uncertainties in the A–P directions of −3.0, −1.5, and 0.0 mm, the resulting GPRs were 88.7%, 92.5%, and 88.0%, respectively.
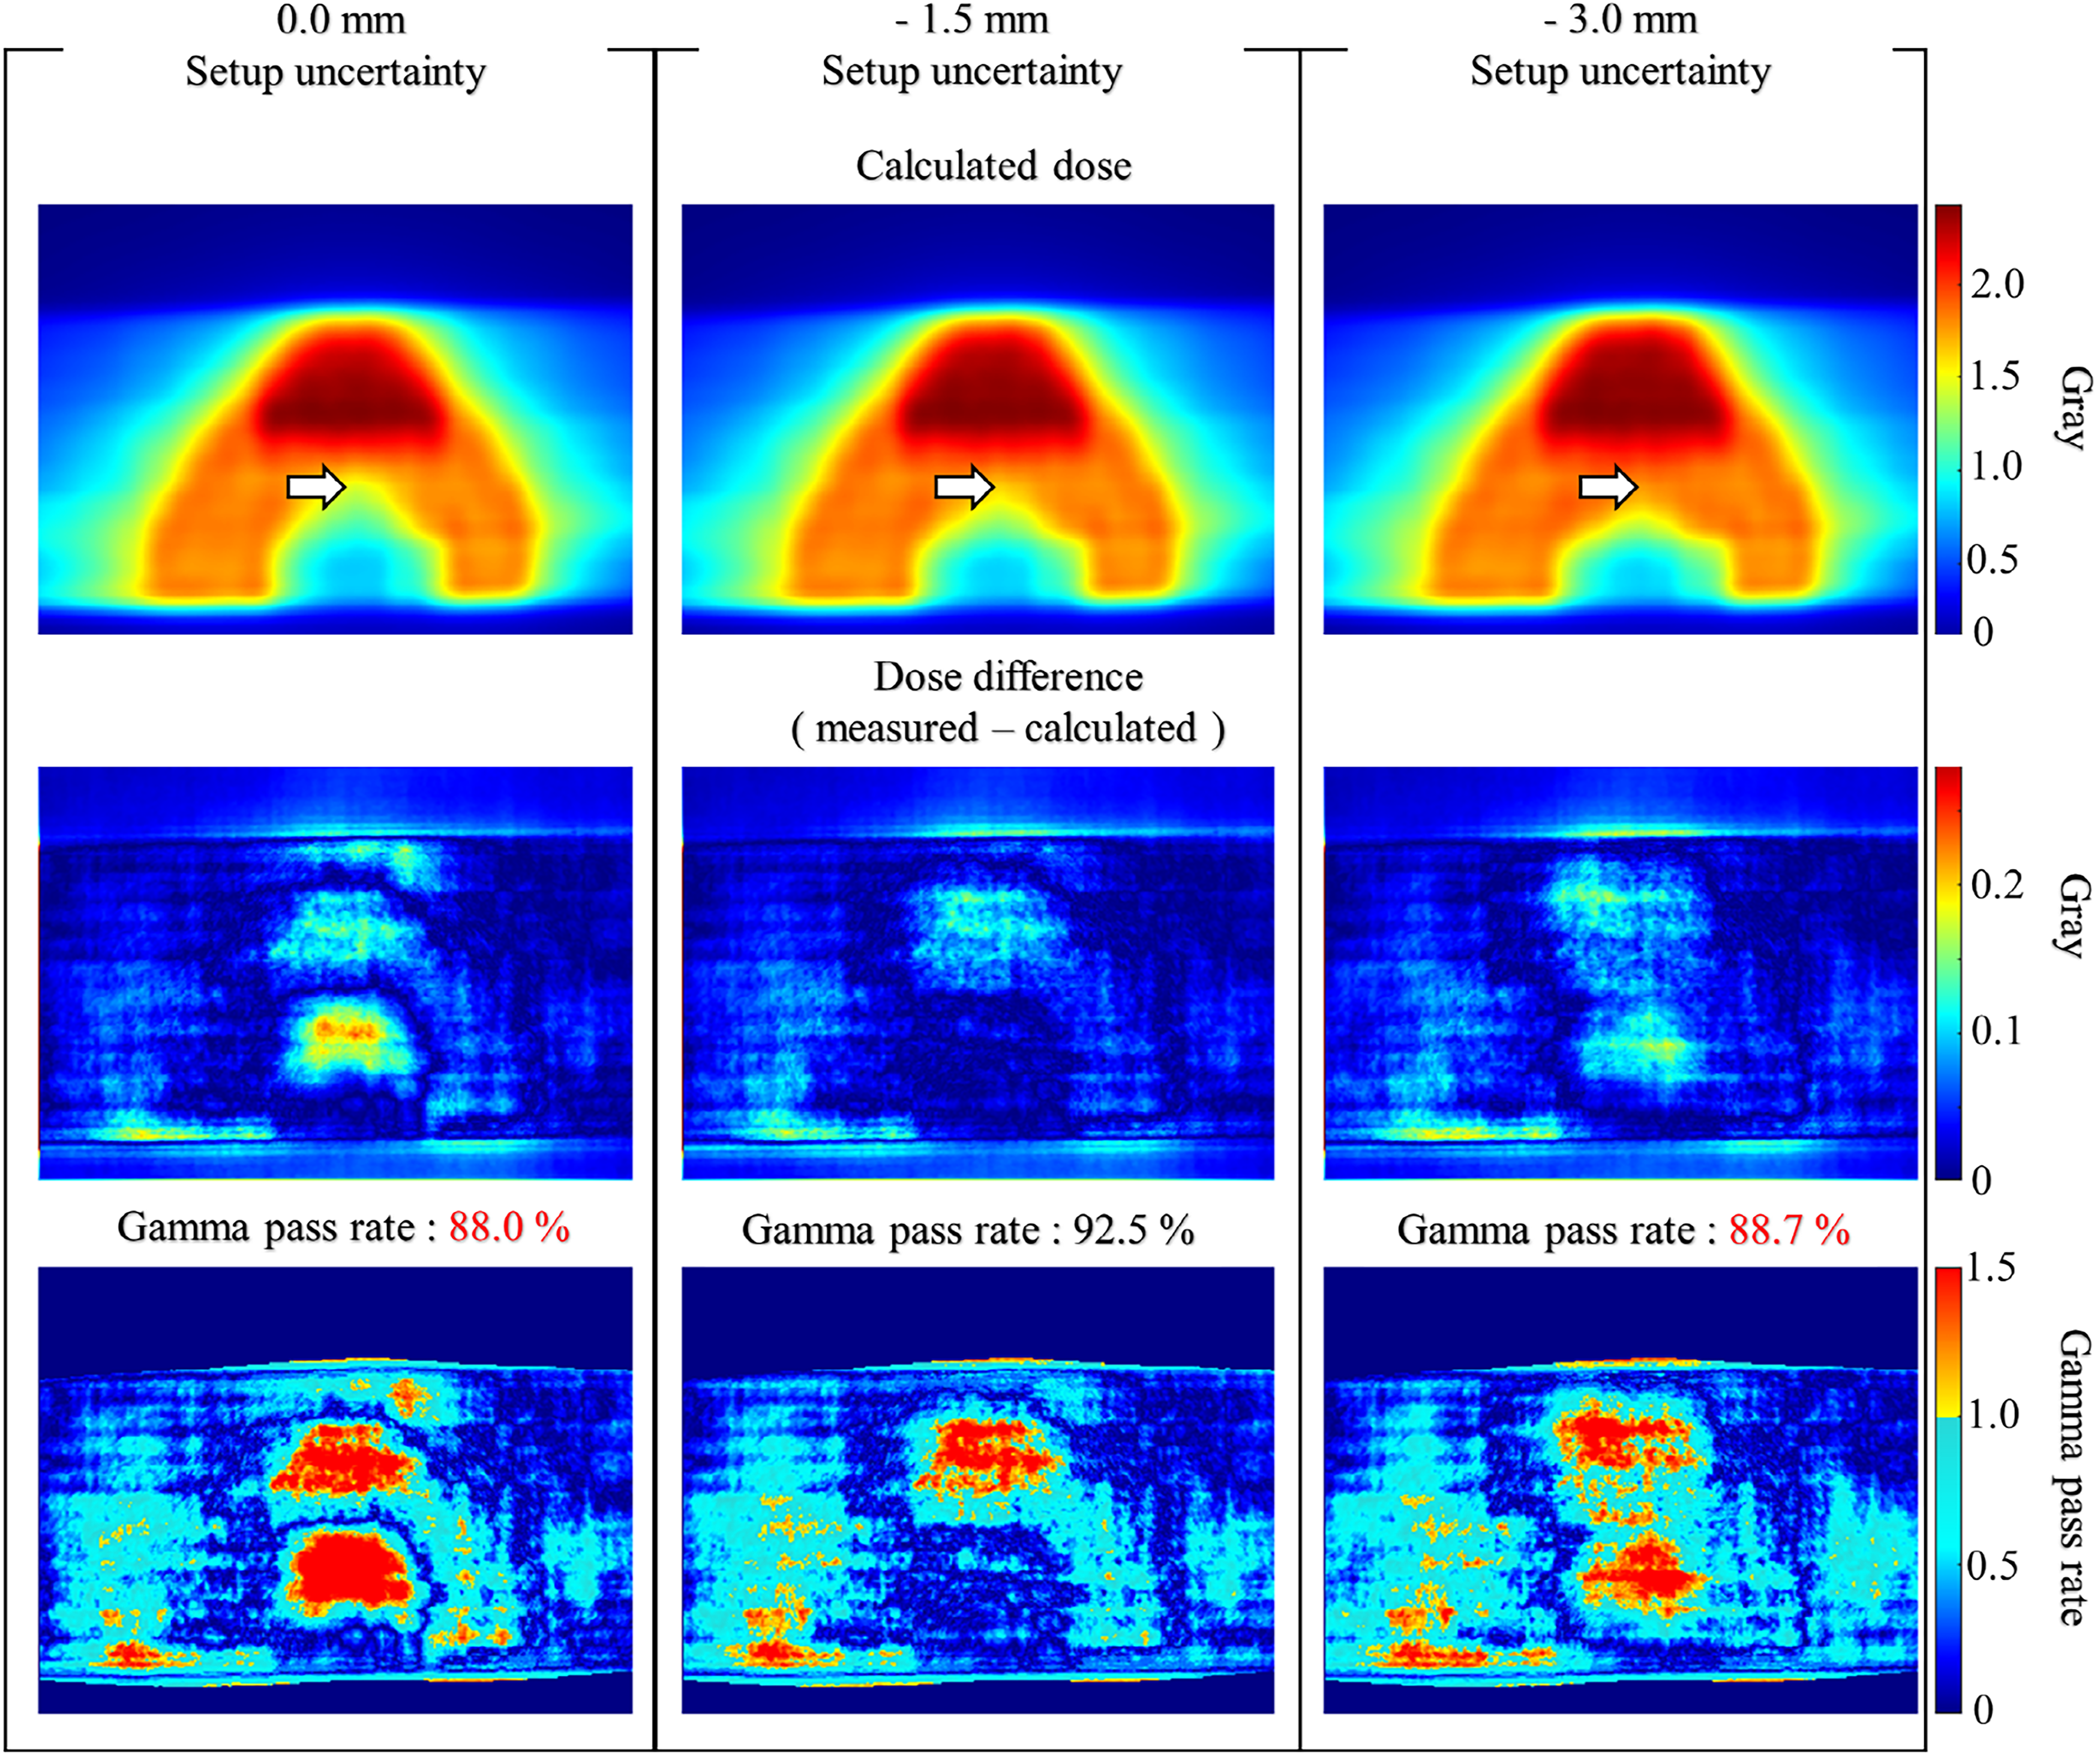
Comparison of the calculated doses (top row), the differences between the measured and computed doses (middle), and the gamma index distributions (bottom) with various setup uncertainties (0.0, −1.5, and −3.0 mm). A region with high dose gradients region is indicated by a white arrow.
Figure 11 presents box plots of the GPRs (maximum values with optimal FSFs) calculated across all patient plans with the setup uncertainties ranging from −3.0 to 3.0 mm at regular intervals of 0.5 mm. In addition, for each of the setup uncertainties, the number of occurrences of the maximum GPR (best GA results across all setup uncertainties) are presented in Figure 12. With setup uncertainties of −1.5 mm, the largest GPRs were calculated for 13 of the 73 plans; this number of occurrences was highest across the setup uncertainties for all machines.
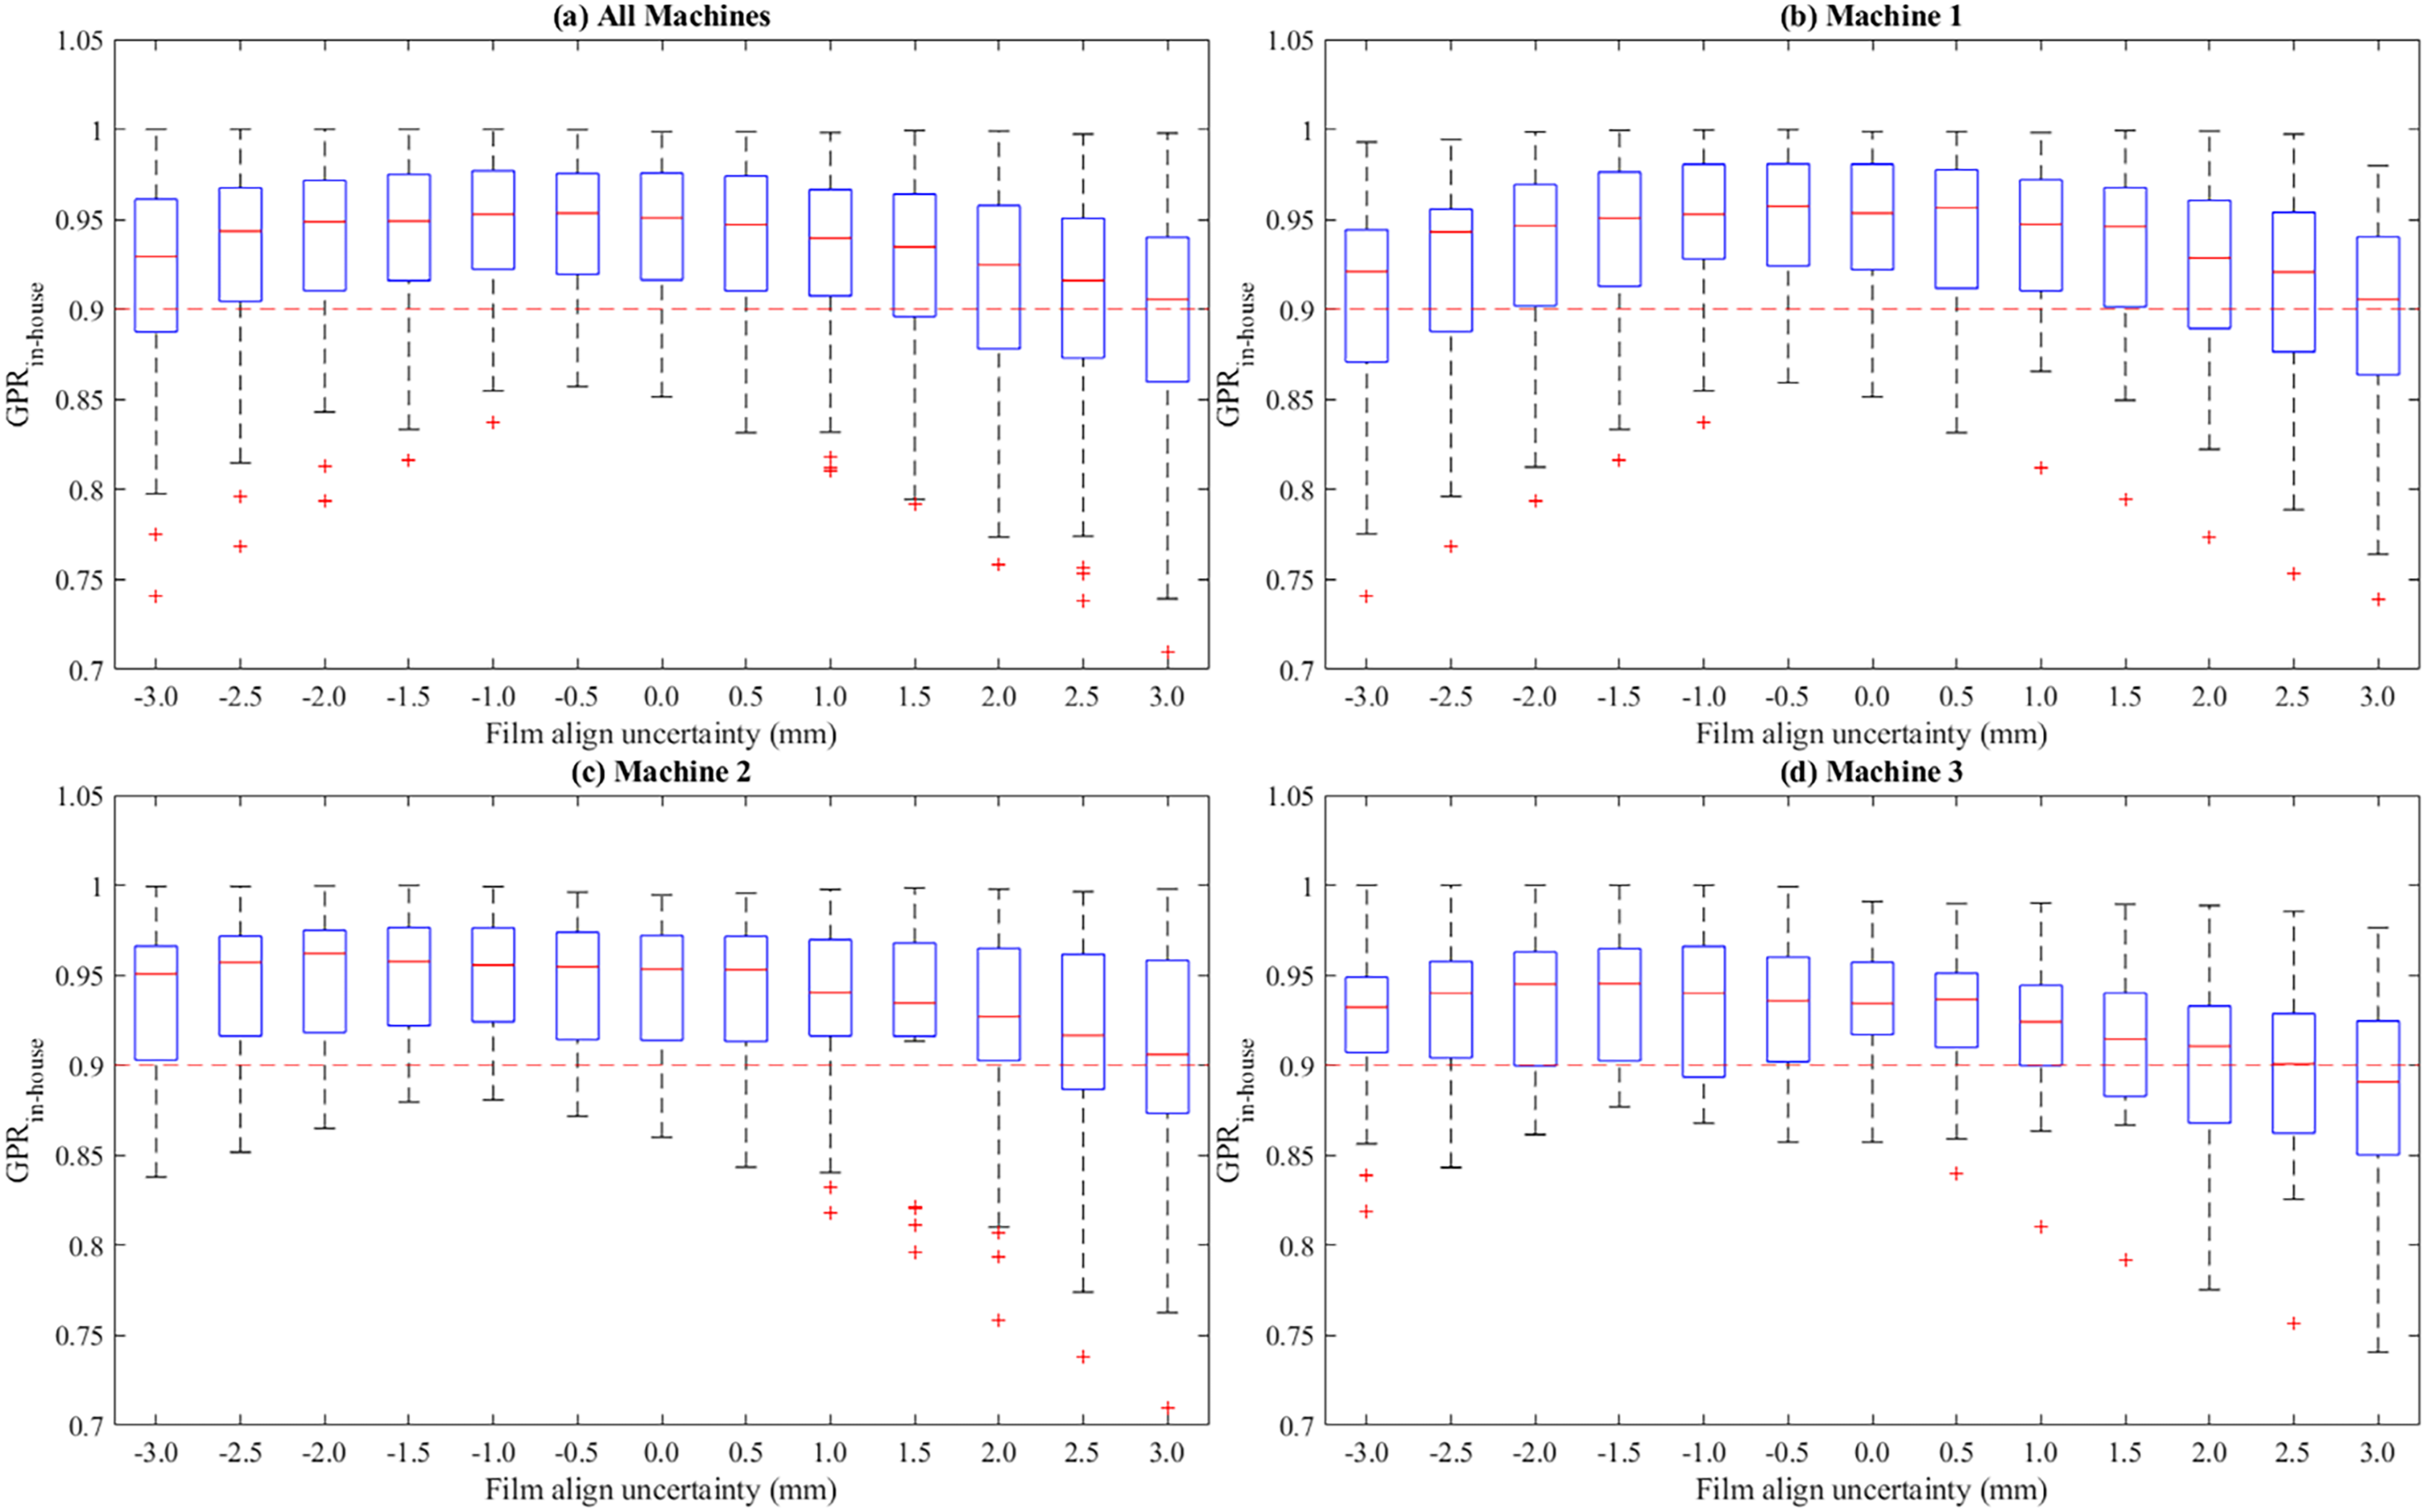
Box plots of the maximum gamma passing rates with an optimal film scaling factor calculated across all patient plans for each of the setup uncertainties ranging from −3.0 to 3.0 mm at regular intervals of 0.5 mm: (a) for all machines, (b) for machine 1, (c) for machine 2, and (d) machine 3, respectively.
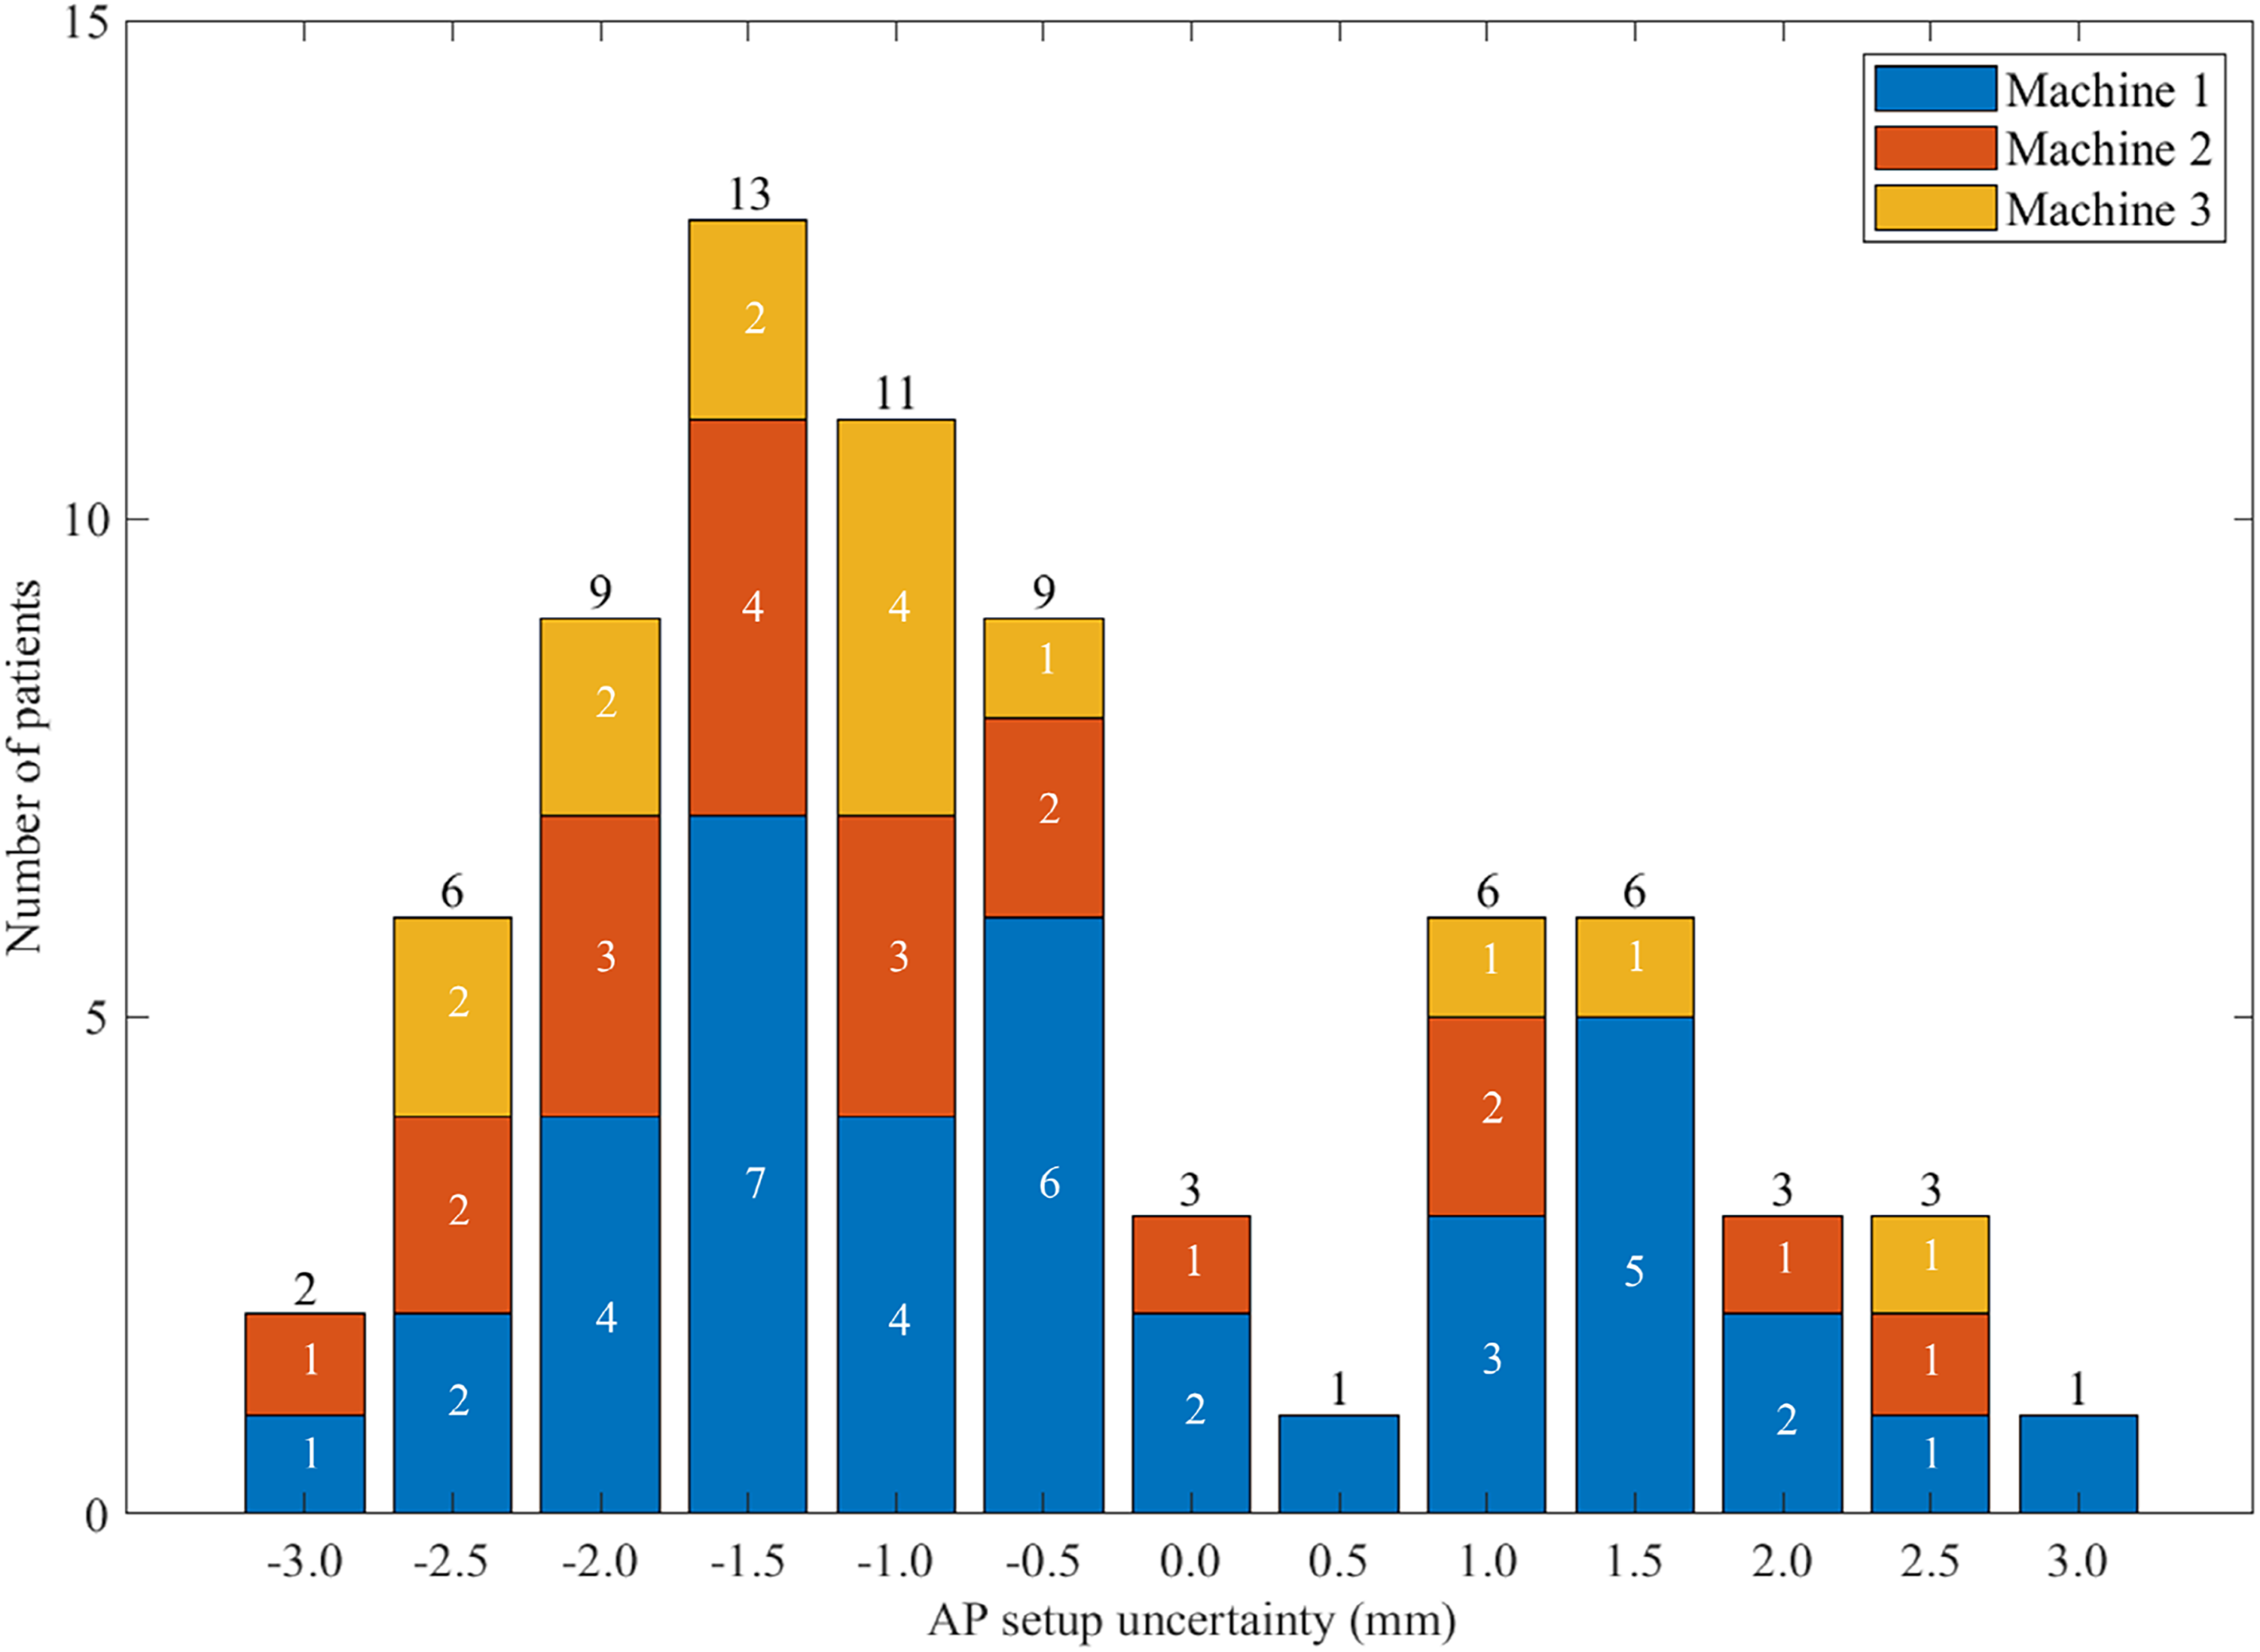
The number of occurrences of the best gamma analysis results across the simulated setup uncertainties for each of the setup uncertainties.
Comparison of Final Gamma Passing Rate
Figure 13 presents a scattered plot of the difference between the final GPR obtained using RIT (manual analysis by the medical physicists) and the newly developed software (automated analysis). On average, the GPR by the analysis using the developed software was 3.0% higher than those of the RIT-based analysis. For 54 of the 73 plans (74.0%), the GPR calculated using the developed software program was higher than that using RIT.

Comparison of the maximum gamma passing rates calculated for all the patient plans using the commercial software (radiological imaging technology (RIT)) and in-house software. Red dashed lines represent the gamma pass/fail criterion (90% in this investigation).
Performance Evaluation on Simulated Error Cases
Figure 14 describes a plot of the GPRs for the film measurements without and with artificial phantom setup errors, which were analyzed with various AP film-alignment uncertainties. Without the AP film-alignment uncertainty, only the film measurement without the simulated phantom setup error passed the GA (GPR = 99.2%) while those with the artificial setup errors resulted in failures in the GA (99.9%, 89.2% for 5, 10 mm in the anterior direction, and 97.8%, 97.8% for 5, 10 mm in the posterior direction). These results demonstrated that the developed software is capable of detecting artificially introduced phantom setup errors. Furthermore, the GA with various AP film-alignment uncertainties successfully calculated the simulated setup errors as demonstrated that the maximum GPRs were found at the AP film alignment uncertainties which were equal to the artificial setup errors for all the simulated error cases.

Gamma pass rates (GPRs) calculated for the film measurements without (original) and with simulated phantom setup errors (5 and 10 mm in the anterior and posterior directions) with various anterior-posterior (A-P) film alignment uncertainties. The data points with the maximum GPR were denoted as asterisk.
Discussion
We developed a novel automated in-house software for DQA GA of tomotherapy radiation treatment plans. Although pretreatment beam verification is essential for the safe delivery of radiation treatment plans, performing GA using commercial software packages, such as Tomotherapy DQA Station and RIT, requires repeated and labor-intensive manual procedures. Therefore, this investigation attempted automating several procedures in the tomotherapy DQA GA, which are both labor-intensive and can be user-dependent. Furthermore, the software adheres to the guidelines provided by the AAPM TG reports. By successfully accomplishing the automation and standardization of the tomotherapy DQA GA process suggested by this study, the authors believe that the following advantages can be achieved. The use of this newly-developed in-house software will improve the clinical efficiency of the tomotherapy DQA process while also enhancing the veracity of the DQA GA. Furthermore, a decrease in the processing time for the GA will allow medical physicists to focus their time on further investigation upon DQA failure. The following three paragraphs will discuss in detail how manual procedures in the tomotherapy GA were automated or standardized in the developed software based on the results presented in this study.
First, the ROI selection was automated and standardized in the newly-developed software as described in the Methods section. The reason why standardizing the ROI selection procedure is important was demonstrated by evaluating how variations in the ROI selection influenced the GA results (Figures 6 and 7). As demonstrated in Figure 6, the GA results can vary depending on the ROI selected by medical physicists. These results indicate that a GA with an inappropriately selected ROI can lead to false positive or false negative results. Furthermore, as shown in Figure 7, the ROI selection without an appropriate removal of the near-phantom edge region resulted in an incorrectly low GPR. As demonstrated in the results, the automated ROI selection (including the phantom edge detection), implemented in the newly-developed software, successfully prevented these errors due to incorrect ROI selections by employing a standardized definition of the ROI for the analysis. In addition to the standardization, since the ROI selection was fully automated, the GA using the developed software did not require any manual procedures such as the selection of a rectangular region, excluding a region near the phantom edge. It is noted that, without this automation of excluding a region near the phantom edge, clinical physicists need to manually select ROI for each GA using currently available commercial software packages including RIT and TomoDQA station.
Second, the procedure of finding an appropriate FSF was automated in the developed software. As shown in Figure 8, the developed software successfully calculated optimal FSFs which are similar to those found manually by medical physicists. These results indicate that the developed software can find appropriate FSF values, mimicking the “trial and error” process, in which medical physicists test various FSFs during GA. The developed software also provided the GA results for various FSFs, which can be useful to medical physicists.
Third, in the developed software, both automatic alignment of the film-measured dose to the computed dose and perturbation analysis with simulated setup uncertainties were implemented. As demonstrated in Figure 9, the film-measured dose was successfully aligned to the calculated dose by an automatic image registration algorithm. Furthermore, as shown in the simulated error tests, the developed GA software successfully detected the artificially introduced phantom setup errors by performing automated analysis with various A-P film alignment locations. For these simulated error tests, the GA by the developed software also provided detailed information on the magnitude and direction of the simulated phantom setup errors. By these capabilities in the developed software, the labor-intensive alignment procedures were eliminated, and the setup uncertainty in the A-P direction was automatically assessed.
This study demonstrates that the developed GA software shows comparable performance to that of the commercial software and can replace the software in typical clinical use. This was proven by the results that the GPRs obtained by the developed software were higher than those obtained by medical physicists, on average. More importantly, one false negative error was detected by the developed software, despite its higher average GPR. These results demonstrated that the developed software facilitated standardized GA procedures with an appropriate accuracy and an enhanced capability to detect clinically feasible errors.
For the patient plans considered in this study, maximum GPRs were typically found with setup uncertainties in the anterior direction. These results indicated that, on average, the phantom was positioned anteriorly with respect to the planned position. In other words, the results of the perturbation analysis provided additional information that the delivery of DQA plans at the authors’ institute had a systematic setup error.
Although the developed software proposed a clinically efficient GA for the tomotherapy PSQA method via standardization and automation, this study has several limitations as follows. First, the AAPM TG-218 report 15 recommended a tighter pass/fail criterion (GPR with 3%/2 mm ≥ 95%) than that used in this investigation (GPR with 3%/3 mm ≥ 90%). 14 However, users can customize the gamma criteria when using the developed GA software.
Second, other setup uncertainties beyond the setup uncertainty in the A-P direction, such as the rotations (pitch, roll, yaw), and the setup uncertainties in the superior-inferior and left-right directions, were not considered for the development of the suggested software. In the developed software, only the A-P setup uncertainty was considered for the perturbation analysis based on the authors’ clinical experience. Depending on the users’ experience, the scope of the perturbation analysis can be modified as the source code for the suggested software is publicly available.
Third, relative dose agreement was evaluated for the film dosimetry in this study while absolute dosimetry was recommended by the AAPM TG-218 report. However, an absolute dose verification using an ionization chamber was performed, complementing the relative dosimetry using film. At the authors’ institution, a relative dose agreement for the film dosimetry was investigated for clinical efficiency while film calibration was performed monthly. Although absolute dose verification is desirable for film dosimetry, absolute dosimetry using film requires time-intensive procedures for appropriate calibration and its maintenance.20,21 In addition, using the developed software in case of performing an absolute dose verification using film can be still beneficial as the GA results without film scaling can be obtained by the developed software.
Lastly, calculating the film-inserting plane location using the red laser coordinates from DICOM RT plan files may introduce uncertainties, as the red laser is manually located by dosimetrists (or medical physicists) when creating a phantom plan. However, based on the experiences of author's institution, this localization error may be relatively small compared to the setup uncertainties, although users should be aware of this possible alignment error due to manual localization.
Conclusions
The developed in-house software successfully automated and standardized several manual procedures in the GA for the tomotherapy DQA. This will improve the clinical efficiency of the tomotherapy PSQA process while enhancing the veracity of the GA results. The GA results with various FSFs and setup uncertainties can provide useful information for further investigations that need to be performed by medical physicists upon DQA failure.
Footnotes
Declaration of Conflicting Interests
The author(s) declared no potential conflicts of interest with respect to the research, authorship, and/or publication of this article.
Ethical Approval
This retrospective study was approved by the institutional review board of Severance Hospital, Seoul, South Korea (4-2022-0310). The need for written consent was waived owing to the retrospective nature of the study.
Funding
The author(s) received the following financial support for the research, authorship, and/or publication of this article: This work was supported by the National Research Foundation of Korea (NRF) grant funded by the Korea government (MSIT) (No. 2020R1A4A1016619), the Ministry of Trade, Industry and Energy(MOTIE) and Korea Institute for Advancement of Technology(KIAT) through the International Cooperative R&D program (Project No. P0019304), the National Research Foundation of Korea(NRF) grant funded by the Korea government(MSIT) (No. 2022R1A2C2008623) and a faculty research grant of Yonsei University College of Medicine (6-2021-0132).