
Abstract
Keywords
Introduction
There are several methods available to treat liver cancers, including surgery, drugs, radio frequency ablation, and radiotherapy. A significant number of patients with large sizes or/and multiple locations of liver tumors can have difficulty benefiting from being treated by the first 3 of 4 modalities listed above. The stereotactic body radiation therapy using external photon beams achieved therapeutic efficacy with good local control on patients with a small size of liver tumors in recent years. 1 The multifocal pattern of photon irradiations resulted in large regions of normal liver tissues receiving low dose for patients with large liver tumors. To reduce large areas receiving low dose, the radiotherapy using carbon ion or proton beam has better dose conformity, and can retain norm liver tissue without receiving unnecessary dose. However, the displacement of liver's tumors (DLTs) can introduce large deviation of delivered doses to have a significant negative impact on the treatment outcome, due to breathing during the dose delivery of each treatment field.
Large DLTs were observed and reported in superior–inferior (SI) direction with a range from 5.0 to 50.0 mm.2–4 Tsai et al. 5 reported that a greater than 5.0 mm displacement of tumor induced by a respiratory motion of the lung resulted in a significant impact on the delivered dose distribution to the liver's tumor for each fraction of treatment. A motion management of DLT using either breathe tracking or breath hold technique can reduce significantly an DLT induced by respiratory. The utilization of motion management techniques can solve respiration-induced treatment uncertainties. It allows reducing the planning margin around a treated tumor. The motion management techniques strongly rely on utilized methods of motion monitoring and motion mitigation. The motion monitoring methods include estimating the tumor motion from some internal or external surrogate. The methods also include directly observing the tumor motion. The motion mitigation could be conducted to deliver doses only on specified conditions of estimated tumor motion by an external surrogate. The external surrogate contains active breathing coordinator (ABC)6, 7 over volumes of breathing and an optical surface imaging system (Catalyst™ system) 8 over changes of skin surface. The motion mitigation can also be conducted by utilizing a beam gating to deliver doses on a range of phases on directly observed tumor motion by tracking an internal implanted marker. The internal implanted markers are to track internal implanted markers 8 using real-time fluoroscopic kV imaging to observe locations of gold markers at tumor or perfused iodine oil in liver. According to our clinical experience of using external surrogate, we found that the motion pattern of observed external surrogate did not always correlate with the direction or/and the magnitude of DLT. Although the use of internal markers combined with the tracking of external substitutes can greatly improve the tracking of tumor movement, the implantation of internal markers will bring high risk of infection to patients and may cause psychological trauma.
With the clinical application of respiratory beam gating in our high-photon linear accelerator and carbon ion and proton beam lines, we only applied appropriate beam gating phase in our linear accelerator based on the directly observed tumor movement. The observation of tumor motions was done by the x-ray fluoroscopy to assure the tumor's locations within limited phases of acquired four-dimensional computed tomography (4DCT) after positioning each patient by the cone beam CT (CBCT). There were many difficulties to track the location of liver's tumor using x-ray fluoroscopy without initial positioning by CBCT in our carbon ion beamline for treating patients with liver cancer. Although the contraction and relaxation of the diaphragm was mainly a physiological muscle movement of breathing motion, the respiratory cycle changed the shape and volume of abdomen which induced the motion of liver tumor near the diaphragm. 9 The induced liver tumor motion could result in difficulty to verify the tumor's location by the x-ray fluoroscopy tracking. To overcome the limitation on the utilization of beam gating for treating patients with liver cancer in our carbon ion beamline, a prediction model to provide a proper margin of internal target volume (ITV) for each treated patient during our study of motion management was utilized. The utilization of 4DCT imaging shown in the publications5, 10 was an important of constructing appropriate ITV volume to ensure dose coverage and reduce the doses to normal tissues.
The transmit change of diaphragm shape was one of the root causes to introduce an elastic dampening of liver during a respiratory cycle. A position change on the top of diaphragm in SI direction, referred to as DM in this study, to present the transmit change of diaphragm shape was used. Although the point at the top of diaphragm might not present the overall shape or volume changes of lung or/and liver, the top of diaphragm presented the maximum indicator of motion as a good surrogate. The dampened liver resulted in a displacement of tumor location within the liver. Therefore, the accordance between the position changes on the top of the diaphragm and DLT over 23 patients in this study was investigated carefully. It was hypothesized that a linear relationship between DM and DLT for patients having intrahepatic liver cancer. Based on this hypothesis, a prediction model for DLT by a linear relationship between observed DM and DLT in 23 pairs of primary planning and reviewing 4DCT for each patient was constructed. Another 37 pairs were obtained for statistical regression analysis to test the linear model. The receiver operating characteristic (ROC) to test the accuracy of linear model on the prediction of DLT was used. Based on the linear model with its statistical accuracy, the goal of this study is to provide a guidance to predict the DLT by utilizing the DM in x-ray fluoroscopy tracking for patients with intrahepatic liver cancer who underwent carbon ion radiotherapy (CIRT). We may be able to reduce the PTV by observing DM by x-ray fluoroscopy tracking through the course of treatment for a treated patient.
Materials and Methods
This study was conducted in accordance with the Declaration of Helsinki and approved by the Ethics Committee of Shanghai Proton and Heavy Ion Center Institutional Reviewer Board (approval No. 220608EXP-02). Consents were obtained that patients/participants provided their written informed consent to participate in this study. The reporting of this study conforms to the Strengthening the Reporting of Observational Studies in Epidemiology (STROBE) guidelines. 11 We have de-identified all patient details to ensure the confidentiality of patient information.
4DCT Image Acquisition and Planning Target Volume (PTV) Margins
This is a retrospective study. A total of 23 patients (median age: 59 years) with liver cancer treated in our institute was included. The 23 patients diagnosed as liver cancer in our institution from May 1, 2020 to September 31, 2021 were reviewed consecutively. An institutional review board approval to collect patients’ imaging data to waive the requirement of informed consent of each patient was obtained. The demographic information of studied patients was summarized in Table 1. Each patient with a vacuum pad and thermoplastic mask (made by CIVICO™) was immobilized. To assure the DLT within ± 5.0 mm clinical acceptable magnitude and to set the threshold of respiratory waveform for the treatment beam-gating phases, the 4DCT image set 12 to evaluate the magnitude of DLT for each treated patient was utilized. The Siemens SOMATOM Definition AS CT simulator to acquire the 4DCT imaging for each patient at head first at a supine position was used. An external pressurized respiratory-gating device to generate the respiratory waveform was used. The 5 phases of equally divided amplitudes for either exhale or inhale cycle 9 as shown an ideal waveform in Figure 1 were used to reconstruct each 4DCT set during its acquisition. Each reconstructed CT set corresponded to 1 of the 10 phases over 5 exhale phases 0%, 20%, 40%, and 80% (Ex0, Ex20, Ex40, Ex60, and Ex80) and over 5 inhale phases 20%, 40%, 80%, and 100% (In20, In40, In60, In80, and In100). 13 The name of each respiratory phase identifies the percentage of full inhalation reached, as well as whether the phase occurs during inhalation or exhalation. The Ex20 phase occurs when the patient is exhaling and reaches 20% of full exhalation as shown in Figure 1.

Shows a whole cycle of respiratory waveform with phases of exhale (Ex) and inhale (In).
Demographic Information of Study Patients.

Abbreviations: ECOG, Eastern Cooperative Oncology Group; KPS, Karnofsky Performance Status; T stage, tumor stage; tumor size, the size of the tumor refers to the longest diameter of the tumor in both longitudinal and transverse directions to measure the size of the tumor; tumor location, tumor located in the left or right lobe of the liver; 4DCT, four-dimensional computed tomography.
The WAVE DECK type ANZAI respiratory-gating device to provide the beam-gating trigger was utilized. A gating window of Ex20-Ex0-In20 to avoid large residual motion and uncertainties during the dose delivery of each field was used. To have a proper planning CT to correlate with the beam-gated delivery, we reconstructed an averaged CT between phases Ex20-Ex0-In20 out of 10 phases to be used in the Syngo PT treatment planning system (TPS) of Siemens Medical Systems, Heidelberg, Germany. Before performing the planning optimization, the clinician performed and approved a proper clinical target volume (CTV) and organs at risk (OAR) contours on the planning CT for each patient. The three-dimensional movements of CTV within Ex20-Ex0-In20 phases over 4DCT of each patient to construct an internal target volume (ITV) with proper margins in all directions were evaluated. Then, a PTV with 5 mm and 7 mm in lateral and longitudinal directions of beam path, respectively, for each field was constructed. The margins of PTV took account of uncertainties of positioning and beam range. 14 We optimized a treatment plan using the required clinical goals of CTV, and PTV and the limited doses to specified OARs for each patient. Besides the planning 4DCT imaging for each patient, a total of 60 pairs of primary planning and reviewing 4DCT sets over 23 patients for this study was acquired. The number of pairs acquired for each patient was not evenly listed in the table.
Data Processing for Obtaining Magnitudes of DM and DLT
An averaged CT set for each either planning or reviewing 4DCT within the typical treatment respiratory-gated phases between 20% of exhale and inhale; that is, Ex20-Ex0-In20 as described above was constructed. A rigid registration between the averaged CT of planning and reviewing 4DCT by aligning the bony structures with the point of interest with specific anatomy land marks 15 was performed. With the registration, the position change on the top of the diaphragm in SI direction between 2 CTs of each pair to present the DM was obtained. The location of the top of the diaphragm was determined at the visual most superior point in each phase of 4D imaging. Although each phase of 4D imaging has lower image quality than regular CT, the visualization of the diaphragm was still good for this study. After the registration, the centroid of liver tumor in each pair was matched. A translational vector in SI direction from the matching to present DLT for each pair was obtained. Using the DM only in SI direction in our linear model, the DLT of our linear modeled could predict over anterior–posterior (AP), left–right lateral (LR), and SI directions. During the initial phase of this study, the magnitudes of DLT for liver tumor in AP or LR direction was typically at ½ of the magnitude in SI direction were observed. In addition, the DLT in SI direction was always perpendicularly to each field while the AP or LR in DLT could be along the beam path over 1 or 2 of the used 3 co-planner 3 fields of carbon ion. The dose variation induced by DLT in either AP or LR direction was smaller than we focused on the DLT in SI direction in this study. With the success of our linear model on the SI direction, we could investigate the DLT in AP and LR direction in a later study. Twenty-three pairs out of 60 acquired pairs to build the linear model were used. The data of 23 pairs was the training set to build the linear model while the data of 37 pairs was the testing set to validate the performance of the linear model through a statistical regression analysis.
The Linear and Distance Models
The DM as the only proxy variable in this linear model to predict the response variable of DLT was used. A linear equation of DLT = a * DM + b with constant coefficients of a, and b was described the correlation between DM and DLT. We obtained 2 constant coefficients to fit the correlation between DM and DLT over 23 pairs of the training set. Instead of correlating the DLT directly with DM, a distance model utilized a polynomial fit on the cumulative probability distribution (CPD) of DM or DLT separately as a function of magnitude of DM or DLT, respectively. It was found that a second-order polynomial could describe well on obtaining the CPD of either DM or DLT. In this distance model, 16 on the assumption that the same magnitude at the CPDs of DM and DLT should correlate with the different magnitudes (ie, the distances) of DM or DLT, obtained relationship between DLT and DM in the distance model could be used to predict the mean and standard deviation for the set of DM over 60 pairs of 4DCT. Predicted mean DLT and its deviation was compared with the predictions of linear model.
Statistical Regression Analysis to Test the Prediction Accuracy of Used Linear Model
Because the numbers of data points are significantly different at various values of DM/DLT, a simple analysis such as the squared error may result in a false confidence of our linear model outside the range of collected data. Therefore, a statistical regression analysis with quantitative measures 17 could be more reliable to test the accuracy of prediction using this linear model, that is, the performance of this model. Based on a selected statistical measure as described in the publication by Steyerberg et al., 18 the performance of our linear model performance was validated. We utilized the statistical package of SPSS version 19.0 (SPSS Inc.) to design the validation of our linear model. In our validation, a binary logistic regression analysis for the regression analysis on 2 variables used in the linear model was performed. In this statistical analysis to validate the performance of our linear model for various magnitudes of DM, we could investigate any aspect of diaphragm dynamics that may influence the state of treatment, that is, the magnitude of DLT during the course of treatment for each patient. The diaphragm dynamics as a covariate and the treatment status as a dependent variable to investigate the statistically significant of this linear model were used. The ROC analysis to evaluate the predictive power of variables was used in the linear mode on the accurate prediction of DLT.
A ROC curve demonstrates the performance of a test to discriminate. It is created by plotting the true positive (TP) rate, or sensitivity, against the false positive (FN) rate, that is, 1-specificity, for different threshold settings of a parameter. For every possible parameter value selected to discriminate between 2 classes or cases, some data will be correctly classified as positive (TP = true positive) and some incorrectly classified as negative (FN = false negative fraction). Conversely, some data will be correctly classified as negative (TN = true negative), but some incorrectly classified as positive (FP = false positive). Plotting TPR against FPR generates a curve in which each point represents a sensitivity/specificity pair corresponding to a particular threshold. The area under the ROC curve (AUC) is a measure of accuracy, in the sense of the ability of an algorithm to distinguish between 2 classes or groups. Based on the ROC analysis, we used the DM as a test variable to determine actual observed DLT. An AUC describes the discriminating ability of a model. The gain and intercept of the model calibration were calculated. Each result with P < .05 were as significant. 19 Based on this principle, we calculated the AUC as well as the corresponding P-values, and the best critical values for selecting the test variables, corresponding to the maximum Youden index (ie, sensitivity + 1-specificity) in the data.
Results
The Linear Model for the Correlations Between DM and DLT
Over 23 pairs in the training data, the mean value with its standard deviation was (4.5 ± 3.3) mm with a range from 0.4 to 11.3 mm, and (2.2 ± 1.6) mm with a ranging from 0.3 to 5.2 mm for DM and DLT, respectively. We established a linear model using a linear equation of DLT = 0.46*DM + 0.12 as shown in Figure 2. The fit of training data as shown points by the linear equation has a high value of 0.991 for R2. A high R2 value indicates a highly reliable prediction ability to correlate linearly from DM to DLT in the training data. The average magnitude of predicted DM by the linear model was (2.2 ± 1.5) mm. The difference between predicted and obtained DLT was (0.31 ± 0.30) mm.
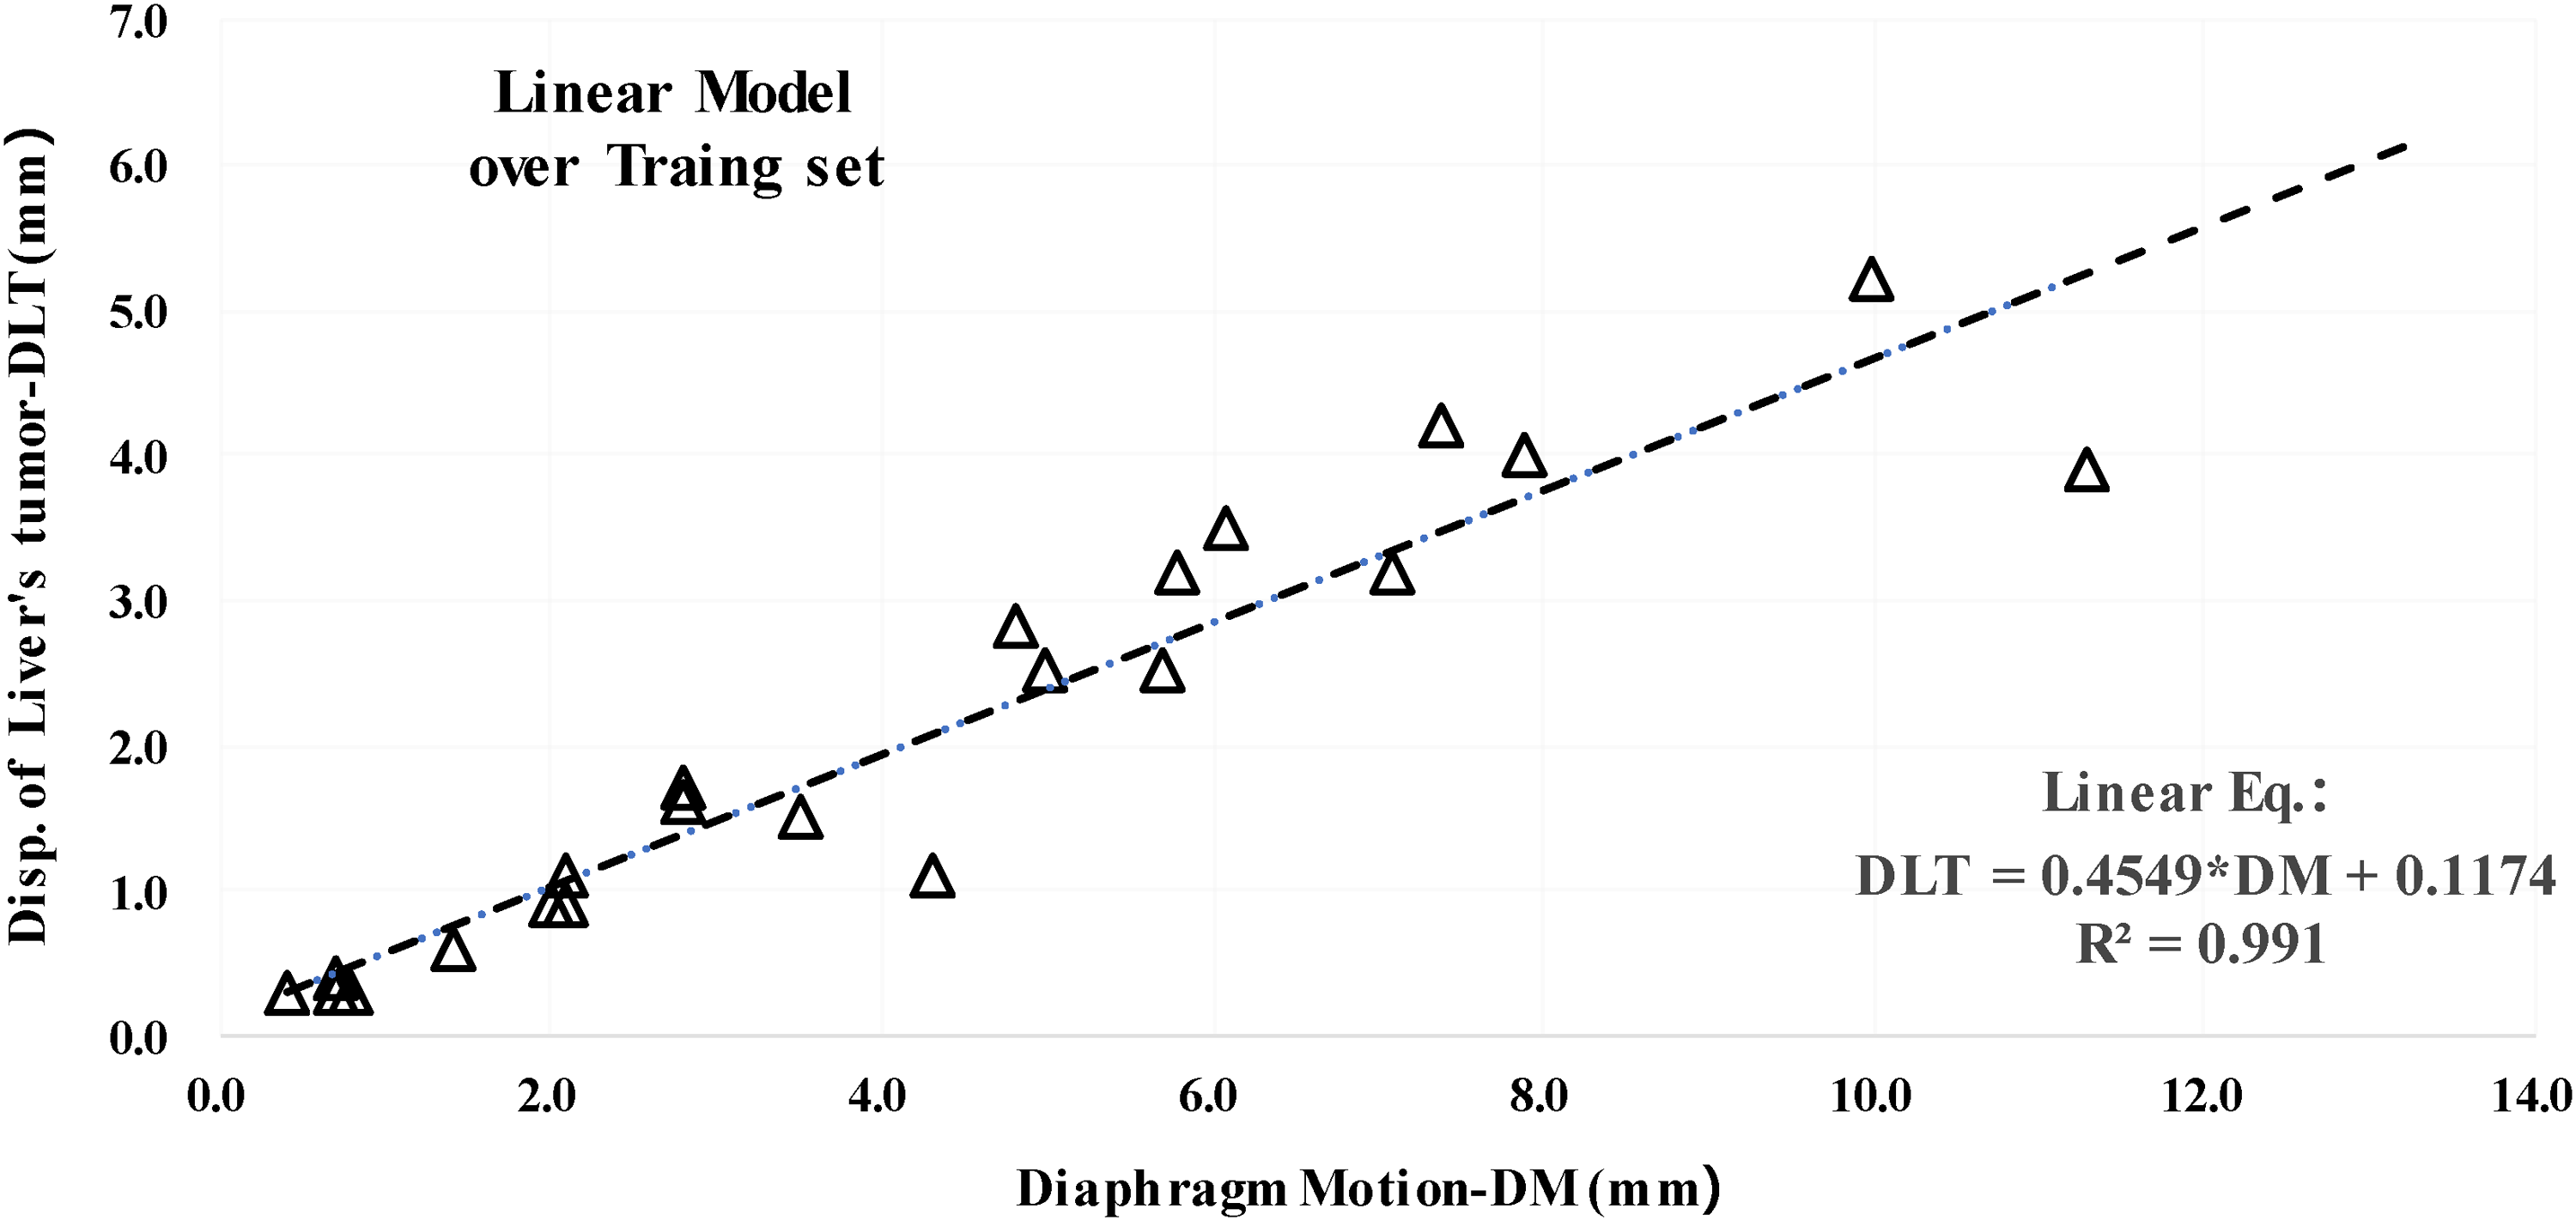
Shows a constructed linear model with 0.991 of R2 that indicates a strong linear relation between the diaphragm motion (DM) and the displacement of liver's tumor (DLT).
Accuracy of DLT Predictions Between the Linear and Distance Models
Scatter plot in Figure 3 showed obtained CPDs of DM and DLT over total 60 pairs used for the distance model. In the distance model, a second-order polynomial equation; CPD = A + B*x + C*x^2, with constant coefficients of A, B, and C could describe well on obtained CPD distributions of DM and DLT with high values of 99.3% and 99.6% for R2, respectively. It was also shown as a scatter plot in Figure 3 for the CPD distribution of predicted DLT values over 60 pairs of obtained DM using the linear model over 60 pairs. A second-order polynomial equation described the CPD of predicted DLT with a high value of 99.3% for R2. The CPD of predicted DM within 5.0 mm is only 60.7%. It meant that almost 40% patients still had DM more than 5.0 mm. Almost 40% of DM more than 5.0 mm might need to consider the margin of PTV additionally in our planning protocol. However, 93.7% CPD of the predicted DLT within 5.0 mm in the distance model was similar to 94% of the data points in the linear model, and the DLT trend predictd by the two models was similar. The CPD of DLT was more than 90%, and the use of 5.0 mm should meet the needs of the most patients with the uncertainty of the setting described above. The relationship between DM and DLT obtained in this study could be utilized to set appropriate DM limits during treatment planning. In addition, during the treatment planning, it was necessary to study the influence of tumor size and its position/extension relative to the diaphragm as well as the uncertainty of setting, residual motion and image registration on the DM set value.

Shows the cumulative probability of diaphragm motion (DM) and displacement of liver's tumor (DLT) over 60 pairs of CT set for observed DM and DLT and the predicted DLT of linear model.
The Regression Analysis with the ROC Curve
Square points in Figure 4 showed obtained and predicted DLT over 37 pairs in the testing sets. The dashed line represented the identity line. The dashed line represented a linear relationship between the predicted and observed DLT. The square points distributed evenly around the dash line indicating a good agreement between obtained and predicted DLT. Overall accuracy of our linear model was good for DLT within 5.0 mm. However, the spreading of points seemed to be larger for the DLT larger than 5.0 mm.

Square points in Figure 4 shows obtained and predicted displacement of liver's tumor (DLT) over 37 pairs in the testing set. We used these data for further validation of our linear model. The dashed line represents the identity line.
To perform the regression analysis for further validating the performance of our linear model, we used the best-fit variables of linear model with the sensitivity and 1-specificity of the ROCs for the predicted DLT as shown in Figure 5. The P-value by comparing the 4DCT image information planning and reviewing was calculated. The P-value for this binary logistic regression analysis was .045. The ROC curve was located to the upper left of the reference line demonstrating the diagnostic value of diaphragmatic motion for estimating tumor motion. The results of the ROC analysis with a P-value of .005 demonstrated a significant predictive value in predicting tumor motion using the linear model.

Receiver operating characteristic curve (ROC) of the linear models. Area under the curve was 0.982.
The AUC of 0.982 indicated that the accuracy of the model prediction was 98.2%. The calculated maximum Youden index was 9.65. The cut-off point of DM corresponding to this index was 9.65 mm. At this cut-off point, the sensitivity and specificity were 0.947 and 1. This indicated that if the magnitude of all obtained DM within 9.65 mm on the pretreatment planning 4DCT image, the probability to predict a magnitude of DLT within 5.0 mm by our linear model was 94.7%. Otherwise, when a magnitude of DM within 5.0 mm was greater than 9.65 mm, the probability to predict a magnitude of DLT more than 5.0 mm was 100%. However, the prediction of DLT within 5.0 mm was treatable as an indicated TP in the regression statistical analysis. Conversely, a prediction of DLT more than 5.0 mm was untreatable as an indicated TN in the statistical analysis.
Discussion
One must utilize a proper technique of motion management to allow for correctly treating a dynamic tumor with significant inter-or/and intra-displacement. It is significantly important for particle radiotherapy. The particle radiotherapy faces the nature of a sharp dose gradient at the distal edge of Bragg peak. It could result in large dose deviations on dynamic tumors. The technique of motion management such as a breath holding or a respiratory beam gating during the dose delivery requires a consistent correlation between DM and DLT. The study by Zhao et al. 9 showed a good correlation between the diaphragm motion DM and the displacement of tumor. The study by Yang et al. 4 demonstrated a strong linear correlation between DM and the displacement of tumor through image registration. We’d like to notice that our linear model focused on inter-fractional anatomical changes, but not on any intra-fractional respiratory-induced changes. In addition, the effects of liver tumor location/extension with respect to the diaphragm need to be further investigated. In this study, we found that there was a similar linear correlation between DM and DLT with R2 of 0.991 to establish our linear model. However, the correlation of DM and DLT is not identical due to the nonrigid structures for both lung and liver in the anatomical of view. To test the stability of geometric correlation between DM and DLT for both nonrigid structures, our linear model by the test set with 4DCT imaging acquired after few fractions of treatments of each patient was applied. The regression analysis of using the testing set proved that the performance of our linear model was excellent when the magnitude of DM was within 9.65 mm, that is, the magnitude of DLT was within 5.0 mm.
The comparison between the linear model and distance model shows that the precision of the linear model is (0.3 ± 0.3) mm between the obtained DLT and the predicted DLT. With our validated linear model excellent prediction values of AUC and P value, we can further explore to utilize obtained DM as a proxy variable for a label-free, real-time tracking of DLT during the course of treatment for each patient. For the respiratory beam-gated CIRT in our institute, the phases used for the gating window is determined by the unique respiratory pattern of obtained the trend of DM on each patient. Our linear model with the accurate prediction of DLT allows us to select a general appropriate beam-gating window for each patient with obtained DM in acquired 4DCT imaging. Predicted DLT of our linear model could allow us to design a personalized PTV margin during the treatment planning of beam-gating CIRT to reduce radiation toxicity and to conduct safely on a dose escalation. In addition, the usage of x-ray fluoroscopy to observe the DM with predicted DLT during the treatment of each fraction may allow further reducing the doses to OARs near the liver's tumor. However, our linear model, generated by different locations of tumors in the liver of different patients, must be further developed into patient-specific model by considering the location/shape of liver tumor or/and the extended distance to the observed DM point, rather than using the general model to guide the treatment of each patient as described above. At this stage of our study, the predicted DLT of our linear model could allow us to design a generalized PTV margin for the treatment planning of beam-gating CIRT to reduce radiation toxicity and to conduct safely on a dose escalation. In addition, the usage of x-ray fluoroscopy to observe the DM with predicted DLT during the treatment of each fraction may allow further reducing the doses to OARs near the liver's tumor. I’d like to point out that only patient-specific models including the tumor size/location with its extended distance to DM can optimally relate the DM and DLT consistently.
Many studies had reported and utilized the linear relationship between DM and DLT of liver cancer for patients who underwent the photon beam radiotherapy. Few studies had focused on particle radiotherapy, especially for beam-gated CIRT. Only 3 institutions, namely the Heidelberg Ion Therapy Center in Germany, the Marburg Ion Therapy Center, and the Shanghai Proton and Heavy Ion Hospital in China are in the whole world. They have the Siemens proton and carbon ion system to provide the beam-gated radiotherapy using pencil beam scanning carbon ions. Although our linear model has been successfully utilized to set the proper beam gating in our clinical application, we faced a heavy burden in the clinical operation to perform the acquisitions of a few 4DCT set on each treated patient. The possibility to utilize the images acquired in the IGRT patient positioning such as 2 orthogonal planner 2D imaging, CBCT, or an in-room CT without a 4D capability were explored. Without the capability of CBCT for the IGRT positioning in our carbon ion beamline, we first attempted using 2 orthogonal planner 2D imaging to obtain the trend of DM or/and DLT during the treatment course of each patient in comparison with the predicted relationship between DM and DLT in our linear model. During the reviewing of planner imaging, the magnitude of DLT induced by respiration over large liver tumors with irregular shapes could not be determined accurately. Fortunately, the in-room CT imaging system was available for the past 2 years in the room of our carbon ion beam. The in-room CT image sets without a 4D capability to develop the proper method of accurately determining the magnitudes of averaged DM and DLT was collected actively. Once the average DM and DLT of each fraction in the treatment process of a group of patients, our developed linear model with a specific characteristics of liver cancer patients in clinical application will be able to verify. In future, we may be able to validate fully on our linear model to predict the DLT by comparing it with detected DLT in magnetic resonance imaging (MRI)-guided radiotherapy once it is in the routine clinical application.
Conclusion
We found a linear correlation between DM and DLT by 4DCT imaging that indicated the DM could be a potential and reliable variable to predict the DLT. And the linear model utilizing DM to predict DLT was established and validated successfully at our carbon ion beamline. In the IGRT procedure at each fractional treatment, bone registration is verified with kV x-rays for subsequent treatment. The DM, that is, the change on the top of the diaphragm, is visible by the x-ray imaging. The magnitude of DLT cannot be well determined due to respiration. To explore a proper process of x-ray fluoroscopy imaging in future study, the tumor motion can be estimated and proceed quickly using the linear model between the DM and DLT.
Footnotes
Abbreviations
Acknowledgments
The authors would like to thank members of the physicist group for their continuous support in the treatment planning environment. We also acknowledge the support from the Shanghai Proton and Heavy Ion Center (SPHIC) clinician and therapist groups.
Data Availability Statement
The raw data supporting the conclusions of this article will be made available by the authors, without undue reservation.
Declaration of Conflicting Interests
The authors declared no potential conflicts of interest with respect to the research, authorship, and/or publication of this article.
Ethical Approval
Our study was approved by Shanghai Proton and Heavy Ion Center Institutional Reviewer Board (approval No. 220608EXP-02). All patients provided written informed consent prior to enrollment in the study.
Funding
The authors received no financial support for the research, authorship, and/or publication of this article.
Correction (April 2023):
Article updated to correct a sentence in Section The Linear and Distance Models.