
Abstract
Introduction
Stereotactic body radiotherapy (SBRT) with excellent 3-year survival rates (50%-80%) has been established as a standard treatment for non-small-cell lung cancer in early-stage and solitary lung metastasis.1–5 It is recommended for patients who are unfit for surgery or who decline to take a surgery. Using a high fractional dose and tight planning target volume margin, it is critical to accurately locate the tumor, and control the respiratory motion in lung SBRT. 6
Four-dimensional computed tomography (4DCT) 7 has become the ground truth in determining intrapulmonary movement since 4DCT has the ability to provide images of moving targets. Nevertheless, 4DCT is an expensive tool and not available in every hospital, especially in those remote hospitals in developing countries. This limits the use of SBRT or reduces the SBRT accuracy in treatment. Moreover, the image acquisition of 4DCT requires technicians’ professional operating skills and patients’ compliance. Patients irregular breathing rhythm would reduce the image quality and thus affect the accuracy of target contouring. These factors further limited the application of 4DCT. Thus, cone beam computed tomography (CBCT), which is more cost effective, easily accessible, emerged as an alternate imaging tool to improve the current situation.
CBCT is a medical imaging technique that is routinely incorporated into the radiation therapy clinical workflow. The image quality of CBCT has recently been significantly improved with the rapid development of medical technologies, 8 both in hardware and software.9–11 It quickly rotates around the patient's body (usually 1 min), with tumor motion within 10 respiratory phases been captured. CBCT and 4DCT are CT scanning techniques with time information included, thus there is a possibility to delineate the tumor margin in the averaged CBCT images. Wang (2013) reported that CBCT is adequate and suitable for lung cancer treatment by providing imaging guidance through 4DCT and CBCT image set. 12 The authors’ results suggest that CBCT and 4DCTMIP images are equivalent in determining an ITV’s position in the phantom. Dumas (2019) studied 9 patients and found that the Dice similarity coefficient (DSC) and mean center of mass (COM) is similar for avgCBCT and 4DCT. 13 Thus, we want to use a deep learning-based method to predict the ITV in CBCT and evaluate the accuracy against 4DCT delineation in this study. 4D-CBCT was not used in the current study because 4D-CBCT images also suffer from reduced image quality because of deficient projections in each phase bin after phase-sorting. The angular under-sampling can lead to streak artifacts, resulting in uncertain tumor localization and patient setup. Moreover, the disagreement between the external surface and actual tumor motion, especially tumors close to the diaphragm, would also result in inappropriate binning, inaccurate tumor location, and noticeable imaging artifacts.8,13
In recent years, deep learning has been widely applied in medical image processing to increase the accuracy, reproducibility, and consistency of tumor contouring; among them, convolutional neural network (CNN) is the dominant method for image classification, target detection and segmentation owing to its ability to extract the representative features that enable to solve most challenging tasks.14–17
Mask R-CNN is a simple, flexible, and commonly used framework for object instance segmentation. 18 It was developed based on CNN and Faster R-CNN. It extends Faster R-CNN 19 by adding a branch for predicting a segmentation mask in a pixel-to-pixel manner parallel with the existing branch for bounding box recognition. Mask R-CNN only adds a small overhead to Faster R-CNN. This enables a faster system and more efficient experimentation, efficiently identifying specific objects while creating a high-quality segmentation mask for each instance simultaneously. Overall, it is an excellent tool for object detection and segmentation, and it won first place in the COCO (Common Objects in Context) 2016 Challenge. Mask R-CNN is also popular in medical image processing. Zhang et al 20 fine-tuned Mask R-CNN using weighted voting of ensemble learning which incorporates multiscale models for lung tumor candidate detection on PET images. This strategy showed good effectiveness and accuracy in tumor identification. Kompella et al achieved better results using a pretrained network with both COCO and ImageNet dataset when segmenting the cartilage and even better accuracy after image preprocessing, 21 indicating the importance of image preprocessing. Cai et al successfully used Mask R-CNN to detect pulmonary nodules with high accuracy, which indicates the potential of 2-stage object detection on medical image classification and detection. 22 Jeong et al proposed a 3D Mask R-CNN with deep attention integrated to highlight features and achieved similar results with U-Nets and V-Nets in the task of brain tumor segmentation even though the dataset is small. 23 All these previous studies show great promise of Mask R-CNN in object detection and segmentation for future clinical use in medical images. Given the great potential of Mask R-CNN in tumor detection and segmentation, this research aimed to explore the feasibility of using Mask R-CNN to predict the tumor ITV in CBCT. Therefore, we proposed an improved Mask R-CNN by integrating the convolutional block attention module (CBAM) with Mask R-CNN. This modified model focuses better on the foreground and thus improves the detection and segmentation accuracy.
To the best of our knowledge, this is the first study reporting on the ITV prediction in CBCT images using deep learning method for lung SBRT. The aim of this study is to (1) explore the feasibility of contouring ITV using CBCT images and (2) automatically improve the ITV contouring using an improved deep learning model considering manual contouring as standard of reference.
Materials and Methods
Data Acquisition
Phantom and Patient Data
This study employs a Quality Assurance System for Advanced Radiotherapy (QUASARTM), Programmable Respiratory Motion Phantom (Modus Medical Devices Inc.) for lung respiratory movement simulation (Figure 1). The volume of the phantom body is 30 × 20 × 12 cm3. A white ball with a diameter of 3 cm and a volume of 14.14 cm3 was used to simulate a lung tumor. The QUASAR software controls the white ball movement along the superior–inferior (SI) axis. Both computer-generated and patient-specific breathing patterns were used in this study. For the 2 breathing patterns, the white ball reached the peak amplitudes at each extreme. The computer-generated waveform is set to be sinusoidal and patient-specific waveforms from real patients are captured using the Real-time Position Management (RPM; Varian) system and uploaded using MATLAB script. The respiratory frequencies of sinusoidal waveforms are set to be 15/20/25/28/30/33 breath per minute, and the amplitudes along the SI axis are set to be 3/5/8/10/12/15/18/20 mm during phantom imaging acquisition. Frequency and amplitude were randomly selected for each computer-generated breathing pattern to simulate different tumor motion speed and magnitude. The frequency of actual patients’ respiratory waveform ranges from 9.5 to 27.2 breaths per minute, and the tumor motion amplitude ranges from 0.5 to 1.8 cm. About 78 phantom cases were acquired in both 4DCT and CBCT for subsequent studies.

(a) QUASARTM phantom with a ball inside simulating the tumor; (b) RPM system.
About 156 patients who underwent lung SBRT in Huadong Hospital with lung tumor ITV size larger than 2 cm3 between 2019 and 2021 were retrospectively enrolled in this study. The median patient age was 68 years old (range: 55-86 years).
Image Acquisition
All the phantom cases and patients received a 4DCT and a series of CBCT scanning. The 4DCT for patients was acquired with the assistance of RPM system accurate treatment planning. Multiple CBCT scans for position verification were conducted during the lung SBRT treatment. The CBCT images acquired at the first time were used for tumor delineation in case the patient body shape and tumor volume change during SBRT treatment. Patients were trained to keep consistent breathing during 4DCT and CBCT acquisition.
The 4DCT images were acquired on a Siemens Somaton Definition AS CT scanner with a pitch of 1.5 and a slice thickness of 1 mm. Free-breath CT (4DCTFB) was acquired with the white ball moving smoothly in phantom or patients breathing calmly during scanning. Averaged CT (4DCTAVG) is the averaged scan based on all phases of the 4DCT. MIP images (4DCTMIP) are maximum intensity projection images with all the tumor motion trajectories been projected onto one CT image series.
The CBCT image acquisition was performed in a CBCT system embedded in the Varian Vital Beam Linear Accelerator. The tube exposure setting of CBCT was 100 kVp and 100 mAs. It rotates 360° around the phantom at a speed of 6 degrees per second. Within about 1 min scanning, all the target motion trajectories were captured.
Image Processing
Tumor Delineation
Contouring of phantom ITV in CBCT, 4DCTMIP, 4DCTAVG, and 4DCTFB images were completed using the Auto Threshold tool in TPS (Eclipse, Varian) with a WW/WL setting of 1600/400 for 4DCT; while in CBCT images were contoured using a WW/WL setting of 1500/450 because of the degraded contrast in CBCT images. Two experienced physicians delineate the tumor margin of CBCT, 4DCTMIP, 4DCTAVG, and 4DCTFB in patient images. To ensure the delineation quality, one physician (3 years of experience) delineated all the cases and the other professional physician (10 years of experience) review and modify (only when needed) the delineated contours. The WW/WL setting was adjusted for each patient case until the margin of the lesion is clear in both CBCT and 4DCT.
Image Alignment
The phantom CBCT and phantom 4DCT images were aligned using Python. The central point inside the ball was found in the axial, coronal, and sagittal planes. The coordinate difference between CBCT and 4DCT images was calculated and then ITV contours in 4DCT were aligned to CBCT images by adding the coordinate difference. All the alignment results were checked and modified by a physician when needed.
The alignment of patient CBCT images with corresponding reference 4DCT images was conducted in TPS (Eclipse, Varian) by physicians manually. The CBCT images were registered to the 4DCT image using automatic and manual registration to improve the registration accuracy. The 2 image sets were matched using WW/WL settings of 1200/−200 (4DCT) and 1100/−250 (CBCT). The tumor in CBCT was aligned to the 4DCTMIP by visually matching the center of the tumor and ensure that the 4DCTMIP contour fully encompassed the CBCT. 24
Noise Reduction in CBCT Image
A large amount of nonlinear attenuation is recorded by the CBCT area detector and the scattered photons contribute to image degradation or noise. The scatter-to-primary ratios are 0.05 to 0.15 for fan-beam acquisition geometry and may be as large as 0.4 to 2.0 for cone-beam.
25
Gaussian noise and Poisson noise in the CBCT images noise needs to be suppressed before training. To reduce the noise and improve the image quality, we applied a simple Gaussian filter. The Gaussian kernel is shown below

Pre-processing and Post-processing
An extended cubic box was generated around the tumor to improve the detection accuracy. The box size is twice the tumor size. In the post-processing, the holes and cavities inside the margin were removed. Morphological dilation and erosion are used for smoothing the tumor margin.
Experiment Design
Figure 2 shows the flowchart of this experiment. After delineating the tumor on the phantom image of CBCT, 4DCTMIP, 4DCTAVG, and 4DCTFB, DSC evaluation was performed to observe the matching degree among these 4 image sets and this result would be used as the following experiment evidence (Figure 2(a)). High DSC values imply a high similarity between CBCT and 4DCT image sets, which means using CBCT to contour the ITV is possible.
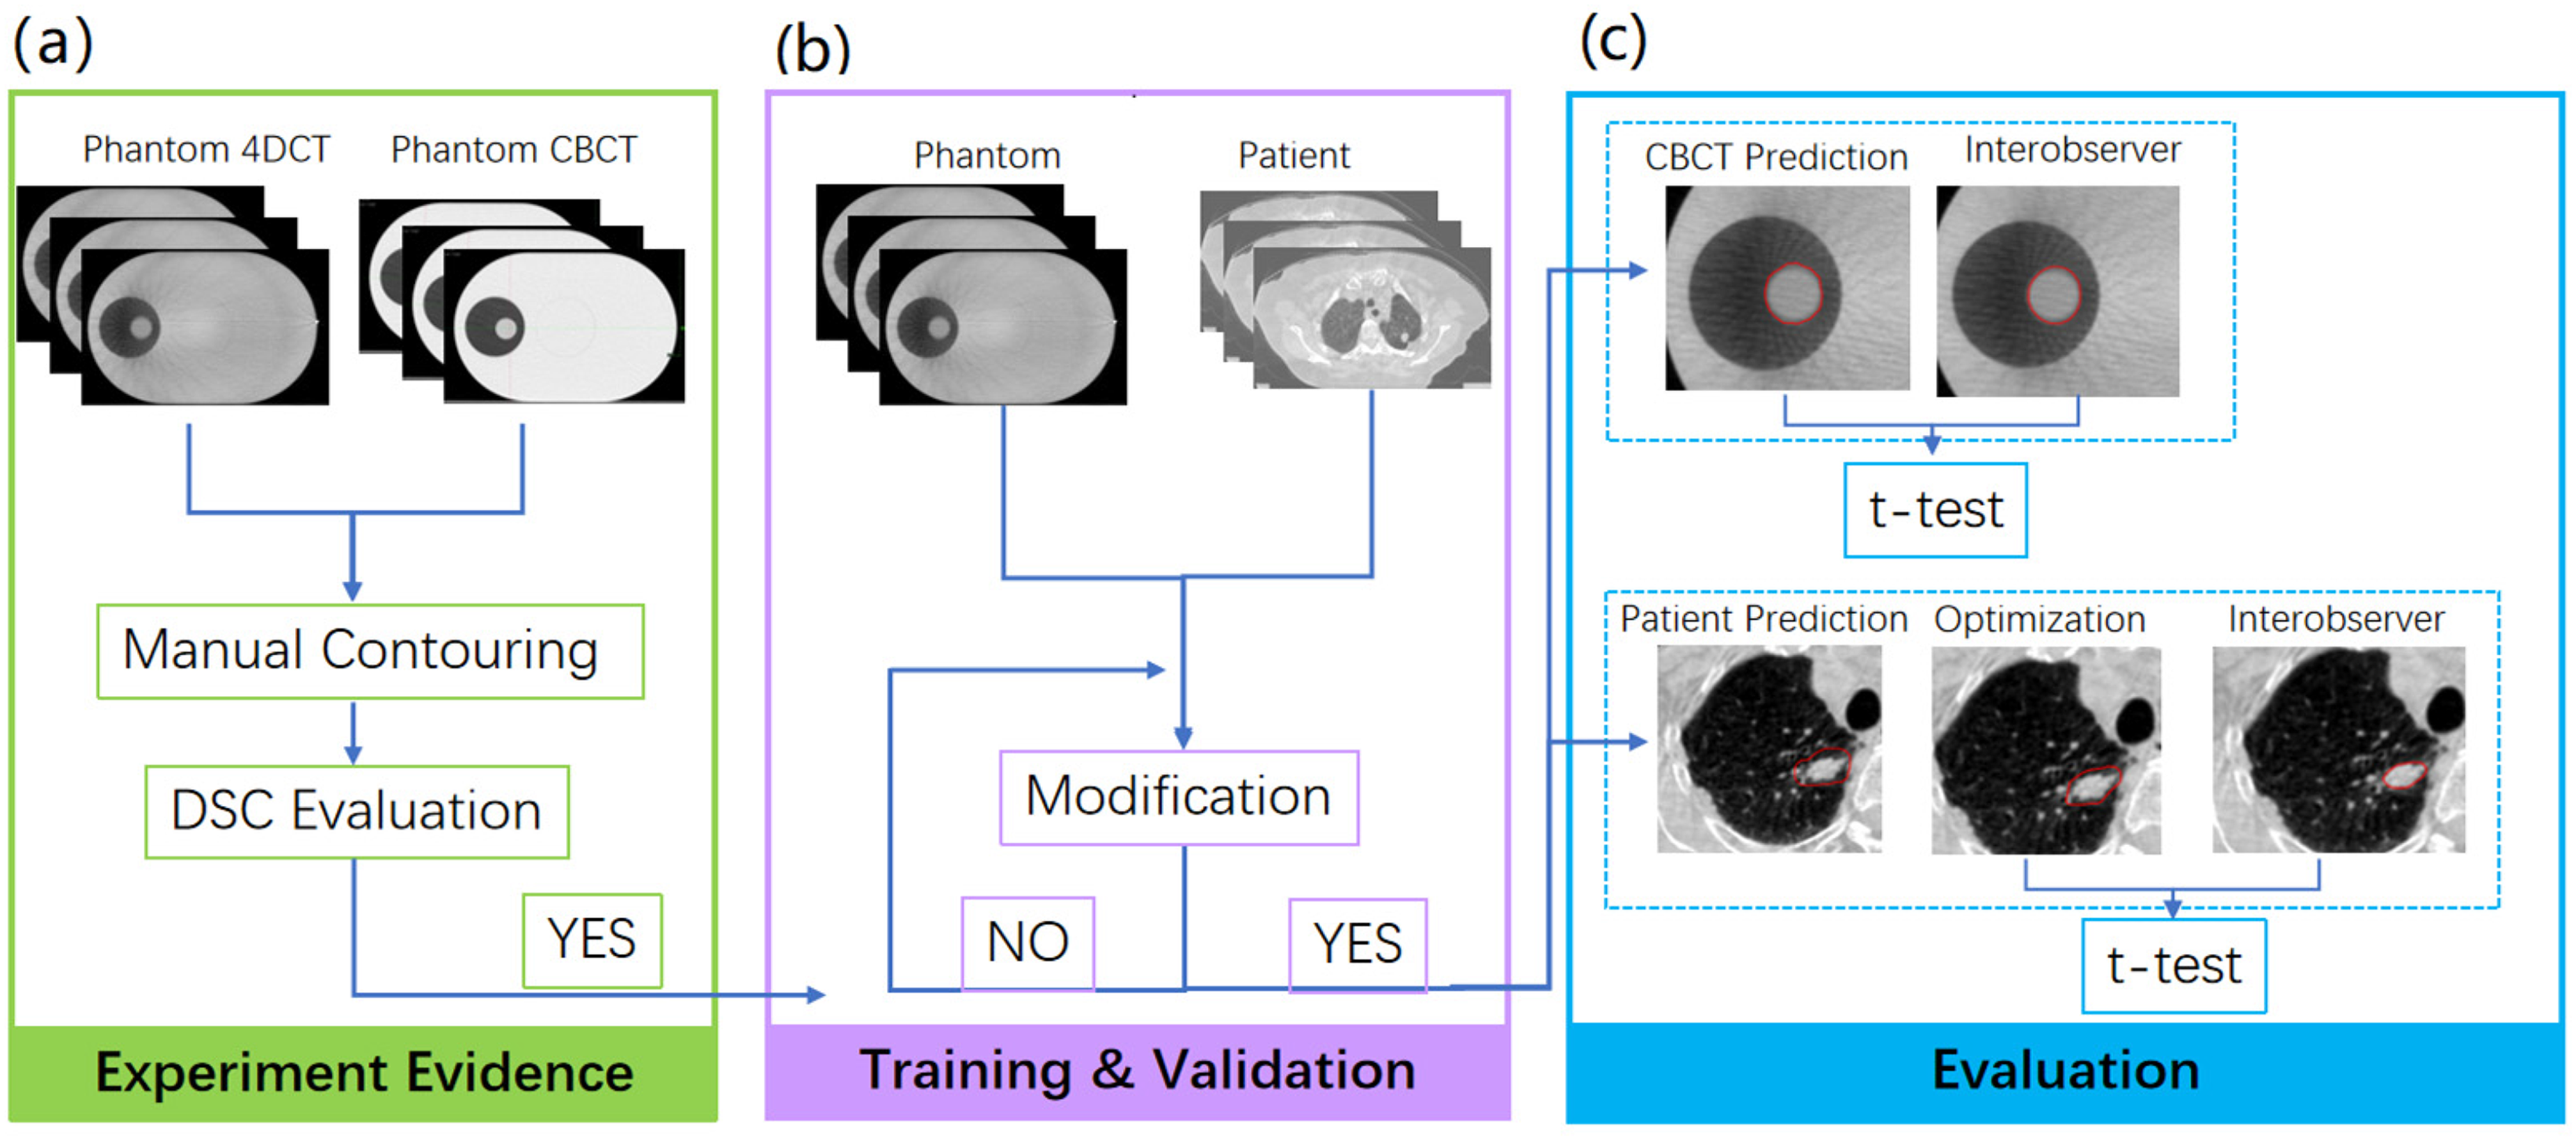
Phantom Dice similarity coefficient (DSC) results were the essential experiment evidence for this experiment (a). 80%, 10%, and 10% phantom and patient cases were randomly allocated for training, validation (b), and evaluation (c).
In the training and validation stage (see Figure 2(b)), a Mask R-CNN model, released by Matterport under an MIT License, is used for both phantom and patients. About 80%, 10%, and 10% cases were randomly allocated for training, validation, and evaluation, respectively. In our experiment, 62 and 8 phantom cases are used for training and validation, respectively, while 8 phantom cases are used for evaluation. Among the total 156 patient scans, 124, 16, and 16 cases were used for training, validation, and evaluation, respectively. The sample size calculation was conducted in G*Power 3.1 to determine a sufficient sample size. Using a two-sided t-test with a 0.05 significance level and a 0.9 power, the calculation yielded 16 as the minimum required sample size for the test.
Mask R-CNN Model
Architecture of Mask R-CNN
We implemented the Mask R-CNN, a deep neural network aiming to solve instance segmentation in machine learning and computer vision. In this study, we use it to predict the tumor ITV in CBCT images. There are 2 steps of Mask R-CNN. First, it generates proposals of those regions where a lung tumor might be based on the input CT image. Second, it predicts the class of the object, then refines the bounding box, and generates a mask in pixel level of the tumor based on the proposal created in the first step. Both steps are connected to the backbone structure. This study used the Resnet-101 network model as a backbone since it provides better accuracy than other backbones. The training process was divided into 2 stages. At the first stage, the model was initialized using pretrained MSCOCO (Microsoft Common Objects in Context) weights and trained for 40 epochs with a learning rate of 0.001. Only head layers were trained in this stage. In stage 2, the learning rate was reduced to 0.0001, and we trained all the layers end-to-end for the remaining 60 epochs. There was no noticeable improvement for additional training epochs. The flowchart of the model is shown in Figure 3.
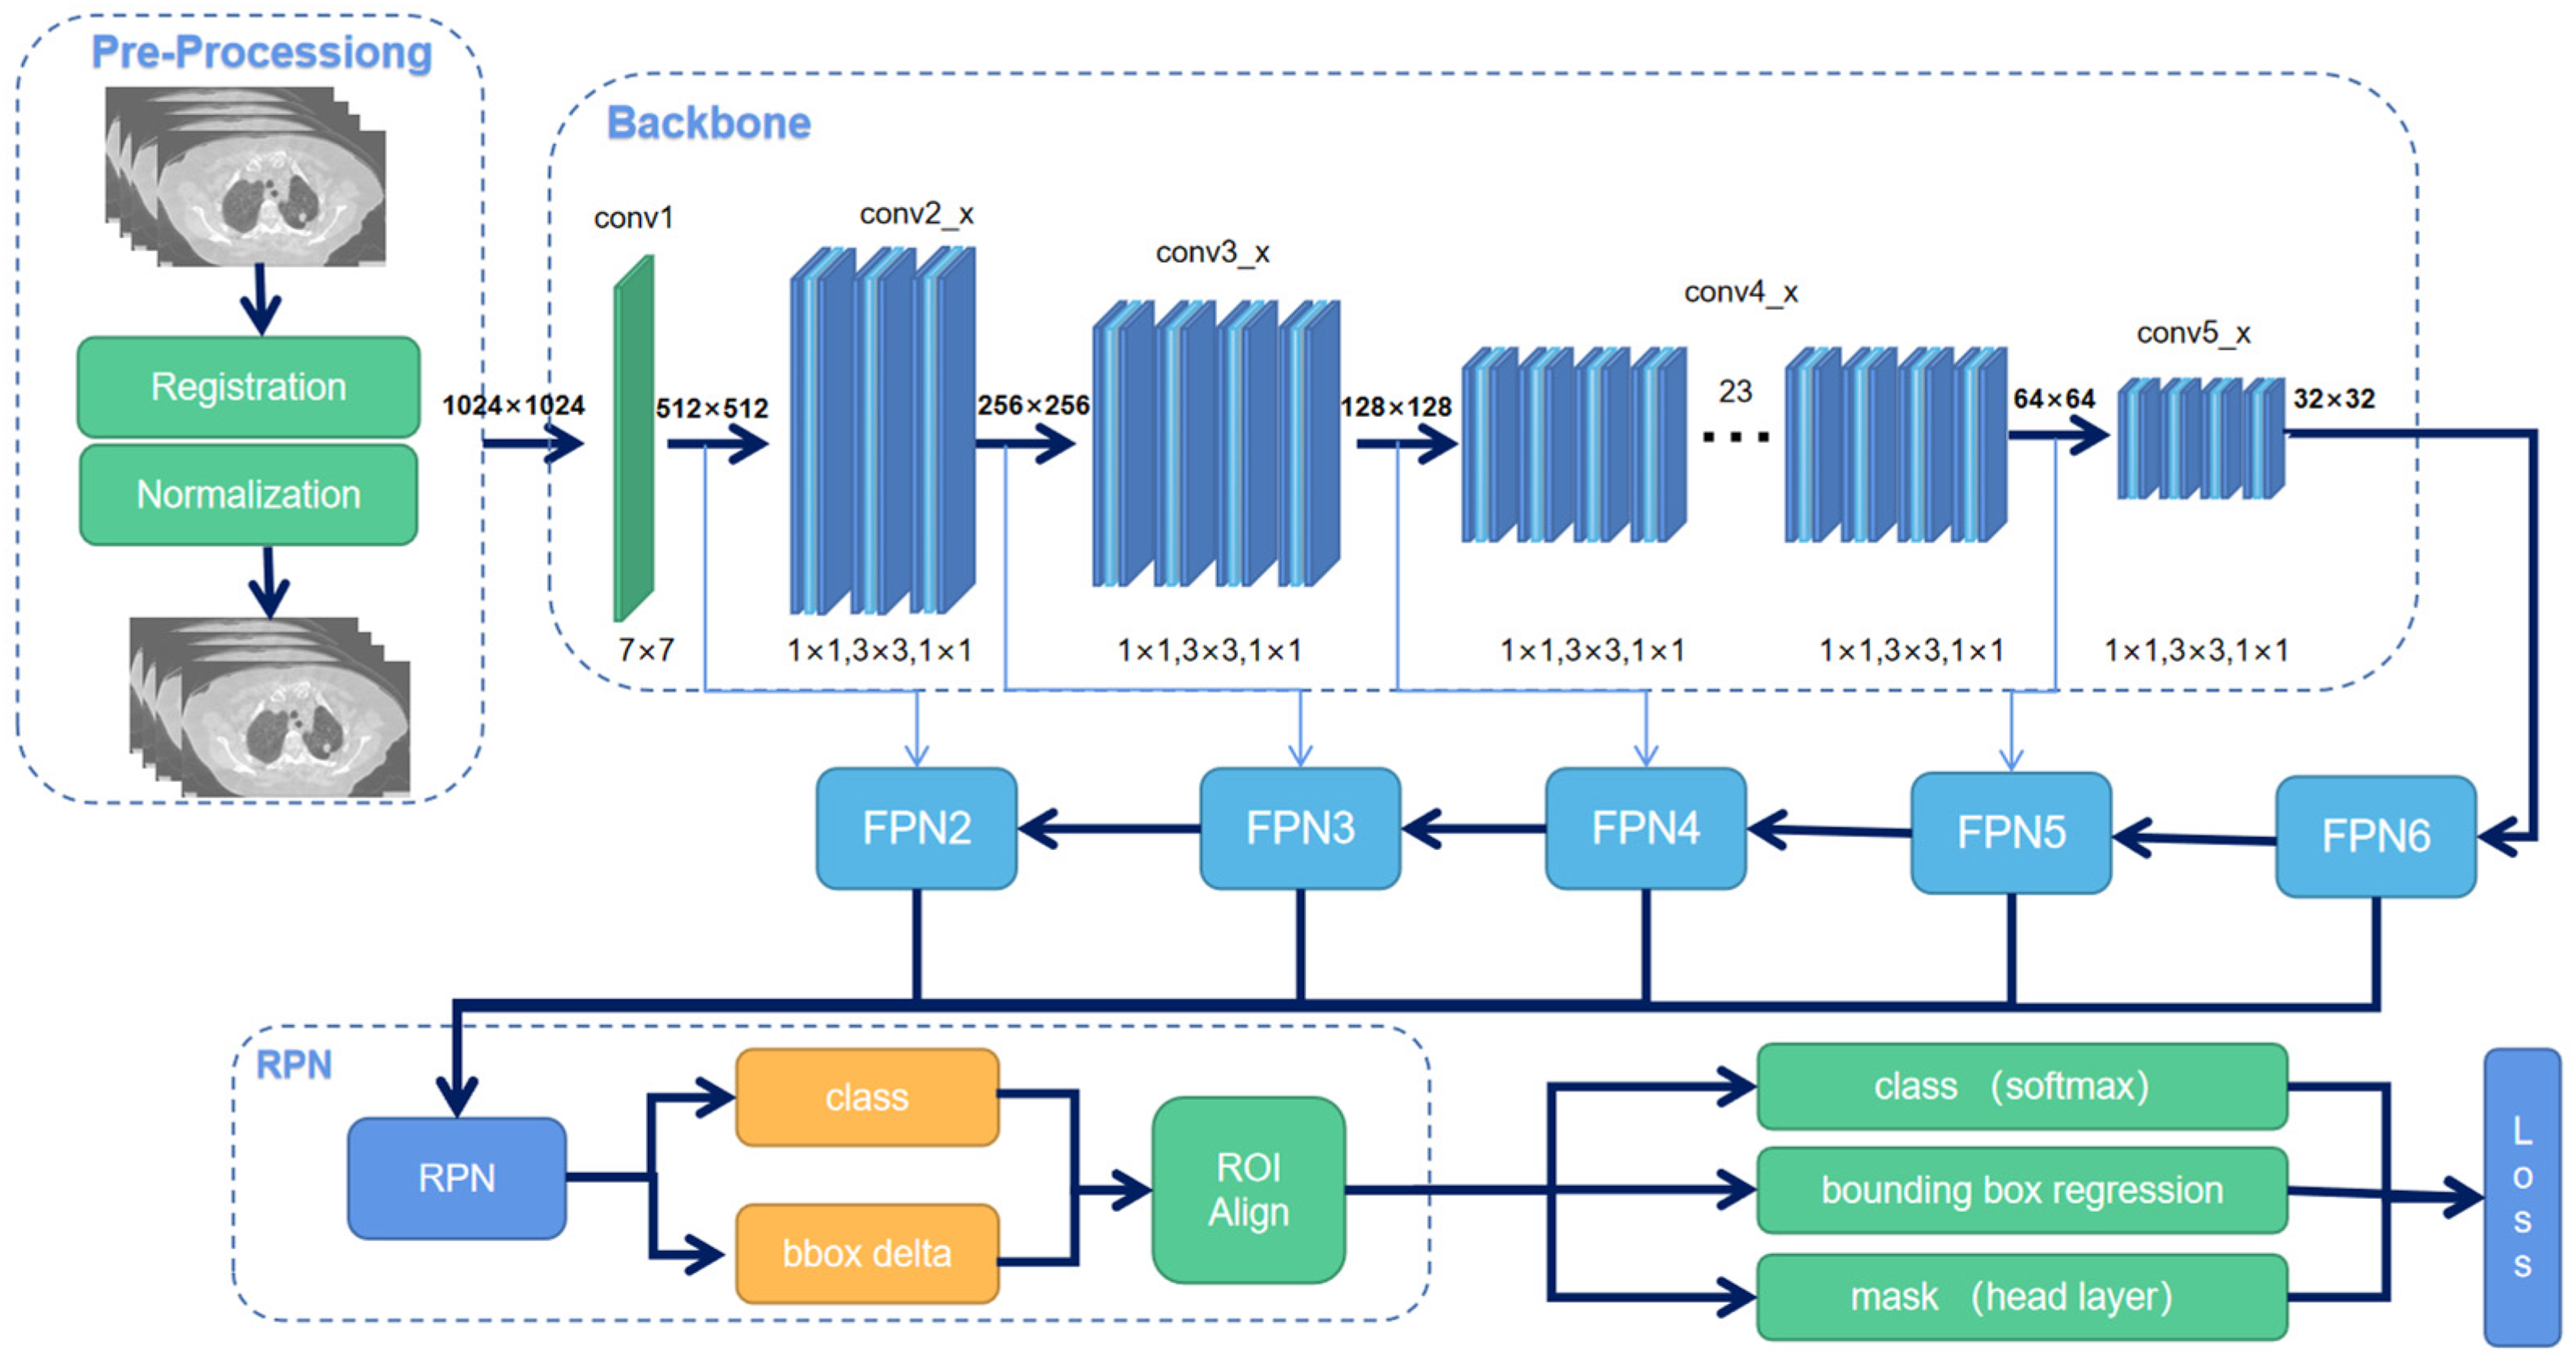
An overview of Mask R-CNN workflow.
The window of HU (Hounsfield Unit) value on CT images was set to [0,1000]. All images were resized to 512 × 512 and scaled to an 8-bit greyscale image. A binary mask was used as ground truth to train the model. Three data augmentation methods were applied before training, which are rotation, flip, and elastic transformation. For the flip, half of the images were flipped horizontally and the other half flipped vertically. For elastic transformation, the pixels were randomly moved around in the images, 26 and for rotation, the images were randomly rotated from 30° to 60°.
CBAM Attention Mechanism
To emphasize the model on the most important features and ignore useless features in tumor segmentation, we integrated CBAM with Resnet-101 as our feature extracting backbone. The workflow of CBAM is shown in Figure 4. The attention mechanism includes 2 modules, the channel-wise module, and the spatial-wise module. The channel attention module applies different weights to each feature channel according to its importance. The module allows the network to perform dynamic feature recalibration. The spatial attention module allocates weights to each pixel to focus on the region of interest. It extracts the features of spatial information to distinguish lung tumors from other organs or backgrounds. The 2 modules are sequentially applied at every convolutional block of Resnet-101 in the channel-first order to achieve better results.
27
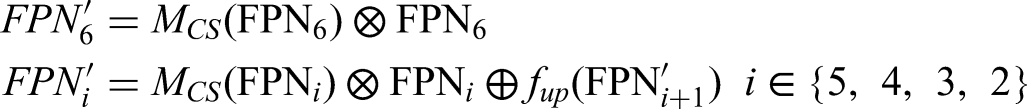
The final output RPN layers are recalculated as:
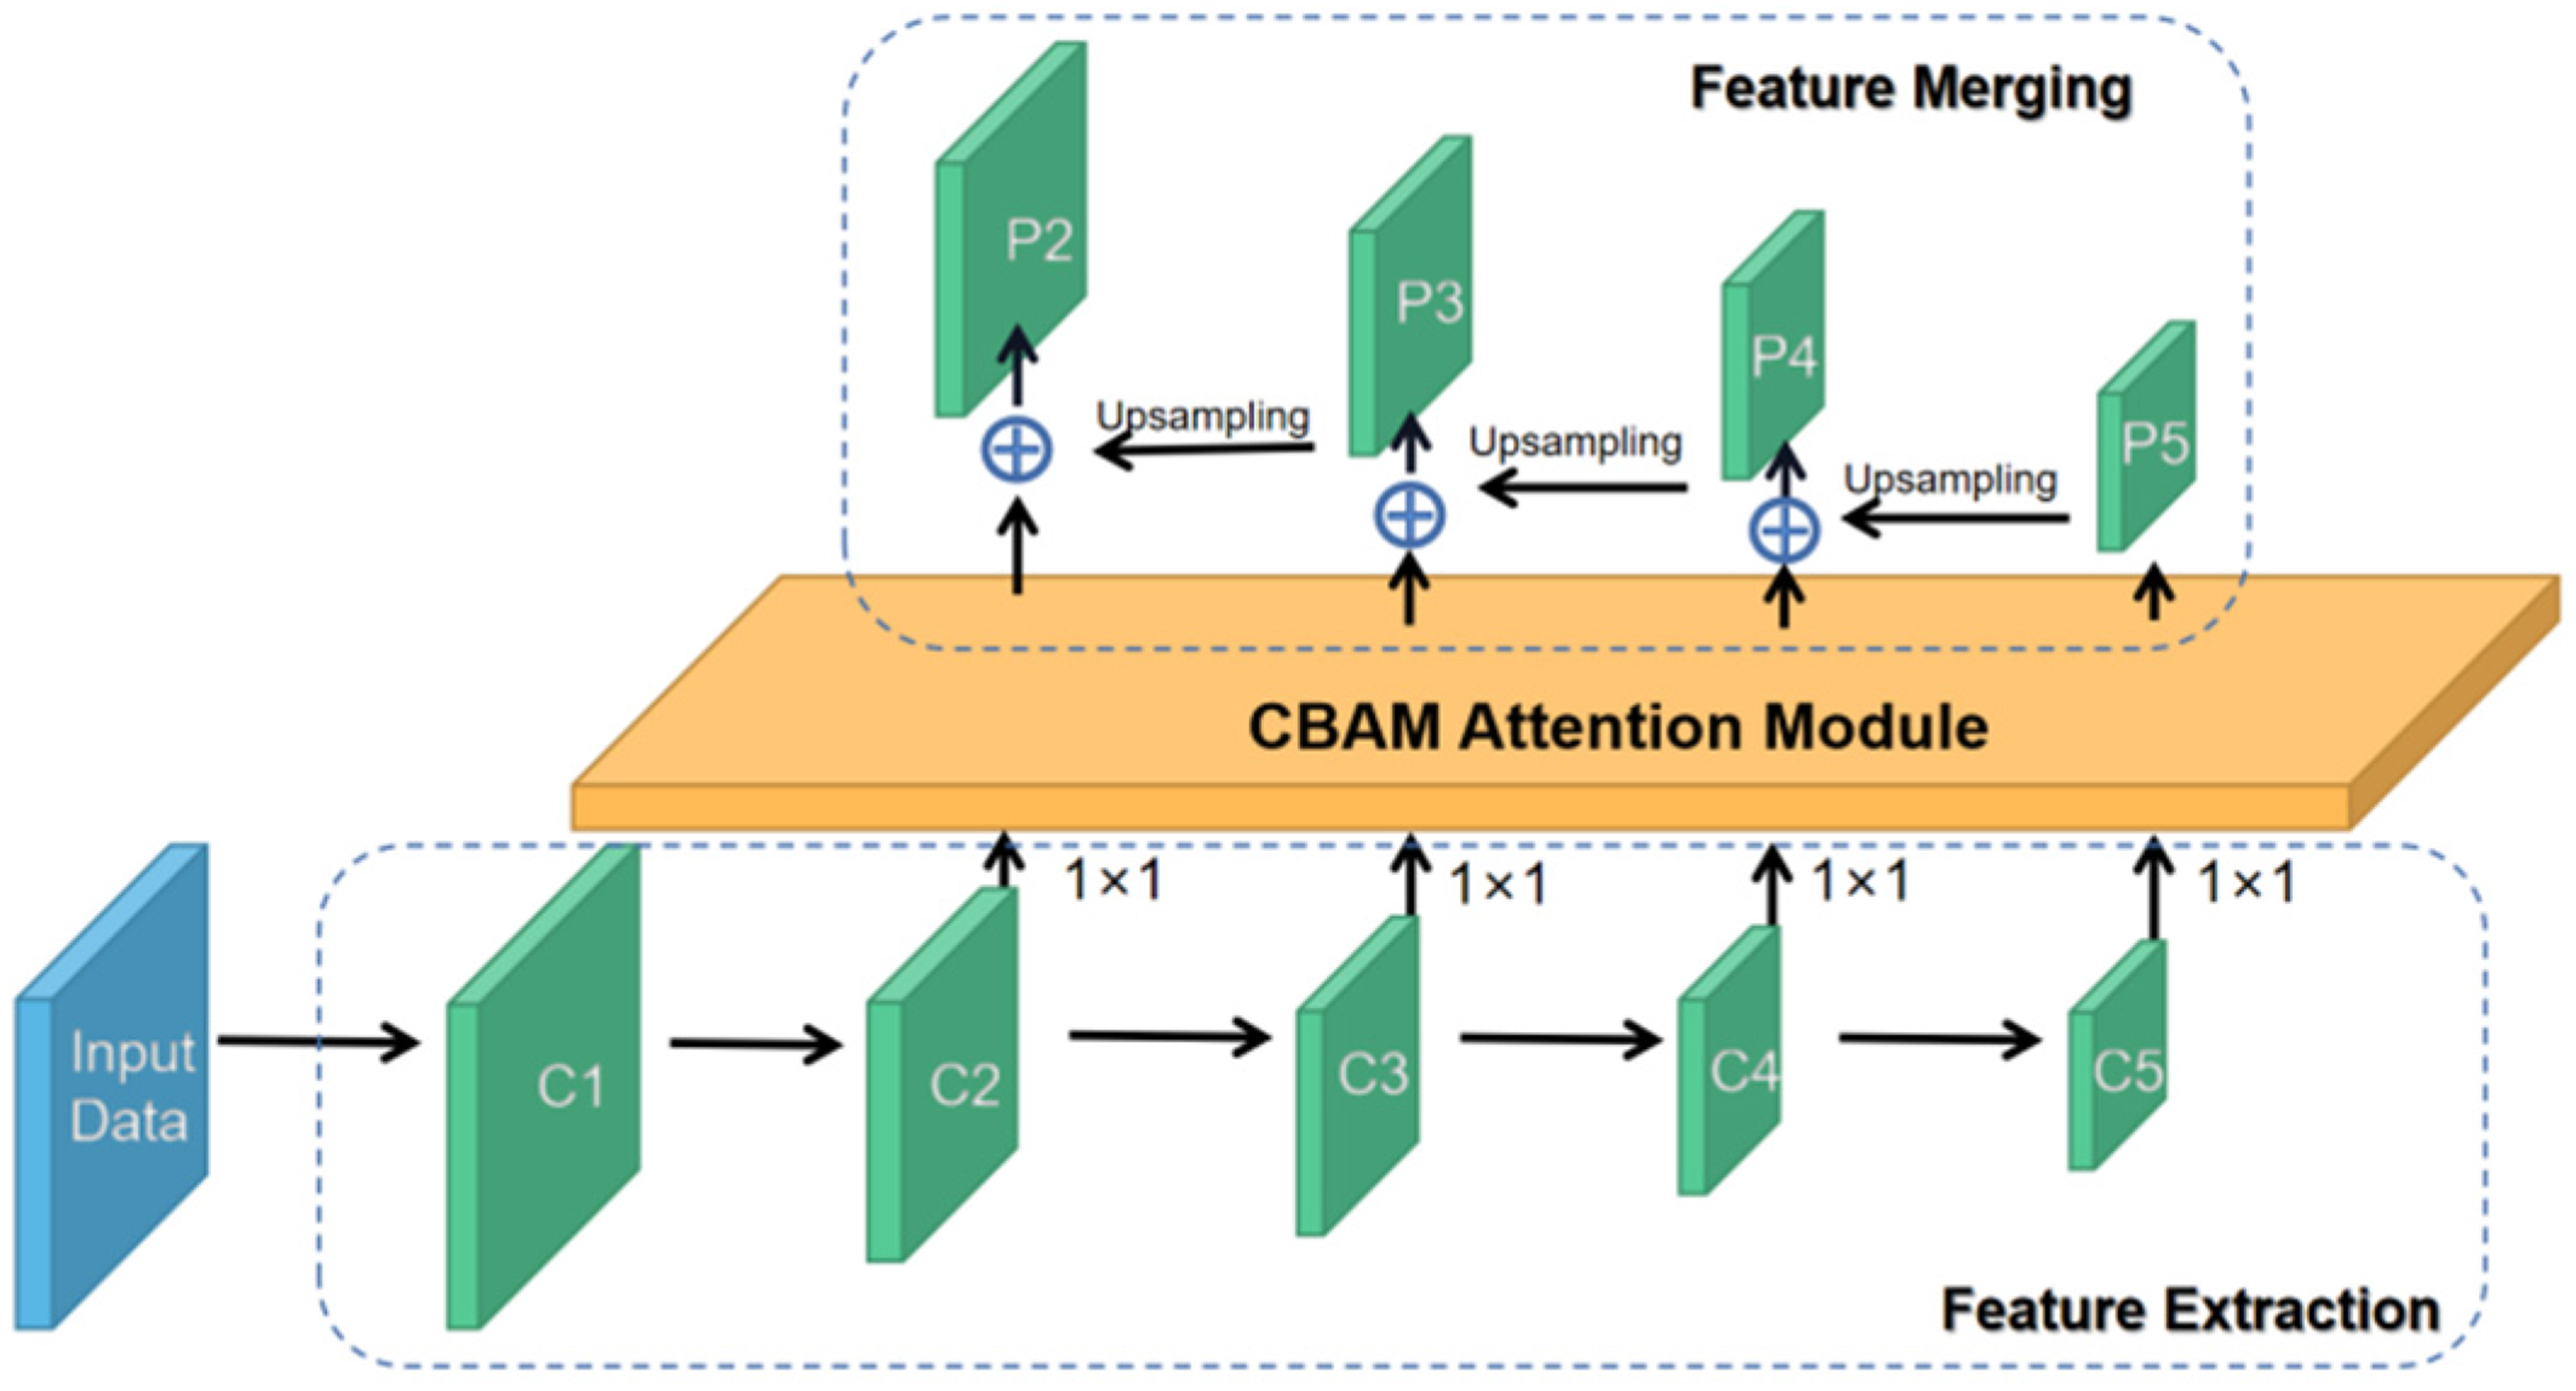
Convolutional Block Attention Module (CBAM).
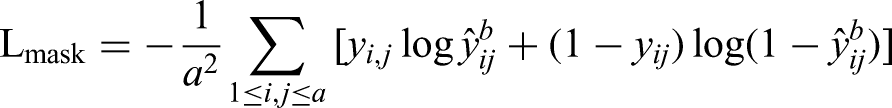
Loss Calculation
The loss function of Mask R-CNN consists of 3 parts, including classification, box localization, and segmentation mask:

Evaluation Parameters and Statistical Analysis
DSC, 3D Motion Range (R3D), relative volume index (RVI), and Hausdorff distance (HD) were calculated to assess the agreement between the predicted ITV and ground truth. Paired t-tests were used to determine whether the differences in the HD, R3D, RVI, values for the deep learning (Mask R-CNN) and manually contouring methods were significant. All statistical tests were performed using SciPy 28 in Python.
Dice Similarity Coefficient
The similarity of tumor ITV on 4DCTFB, 4DCTAVG, or 4DCTMIP and CBCT was compared using a DSC for each phantom case:

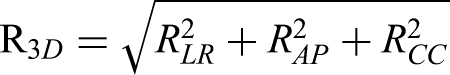
Three-Dimensional Tumor Motion Range (R3D)
The tumor motion range in one direction was designated as the differences of the ITV centroid coordinate between the predicted ITVCBCT and ITV4DCT. Tumor motion ranges in 3 directions were calculated by the difference of COM, including left–right (LR), anterior–posterior (AP), and craniocaudal (CC) orientations. R3D equals 0 if 2 ITVs are perfectly matched.
Relative Volume Index
RVI was defined as the ratio of CBCT volume to 4DCT volume. The value of RVI equals 1 if the 2 volumes are fully matched.

Hausdorff Distance (HD)
The Hausdorff Distance (HD)
29
between 2 finite point sets A and B is defined by,

A and B are the predicted ITVCBCT and ITV4DCT, respectively. HD is 0 if the 2 sets perfectly match each other, and larger HD indicates an imperfect match.
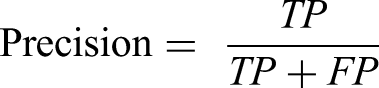
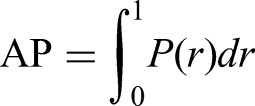
Mean Average Precision
The average precision (AP) is defined as the area under the precision–recall (PR) curve. Precision and recall are defined by

With different predictions, a PR curve
Results
Phantom DSC Result
The DSC values show the tumor ITV similarity among a series of 4DCT images and CBCT images (Table 1). The DSC value between 4DCTMIP and CBCT is 0.86 ± 0.16 and between 4DCTAVG and CBCT is 0.83 ± 0.18. According to the good agreement threshold of the DSC (DSC >0.7),30,31 the DSC values indicate ITVs in 4DCTMIP and 4DCTAVG have a good correlation with ITV in CBCT. Nonetheless, the DSC value for 4DCTFB and CBCT is only 0.58 ± 0.28. Thus, the contours on both 4DCTAVG and 4DCTMIP images are used as ground truth in the following phantom model training.
DSC Value among 4DCT and CBCT in Phantom.

Loss Evaluation
Loss for Phantom
The loss of phantom in validation during optimization process was shown in Figure 5(a). For the CBCT and 4DCTAVG, the loss decreases rapidly in the first stage (0-39 epoch) and gradually become stable in the second stage (40-99 epoch). Finally, the loss approached 0.1 at the end of the optimization. Nonetheless, the loss for 4DCTMIP does not show a significant decrease and fluctuates drastically during optimization. Generally, it drives up and down around 0.3 during the optimization and does not converge in the end. Thus, we only involve 4DCTAVG during patient training.

Loss of validation for phantom and patient. (a) Phantom loss; (b) Patient loss.
Loss for Patient
The loss of patients in the validation stage is shown in Figure 5(b). The loss gradually converges in the initial 60 epochs and slightly fluctuates in the following epochs. The convergence degree is not as good as the phantom.
Model Performance
Phantom
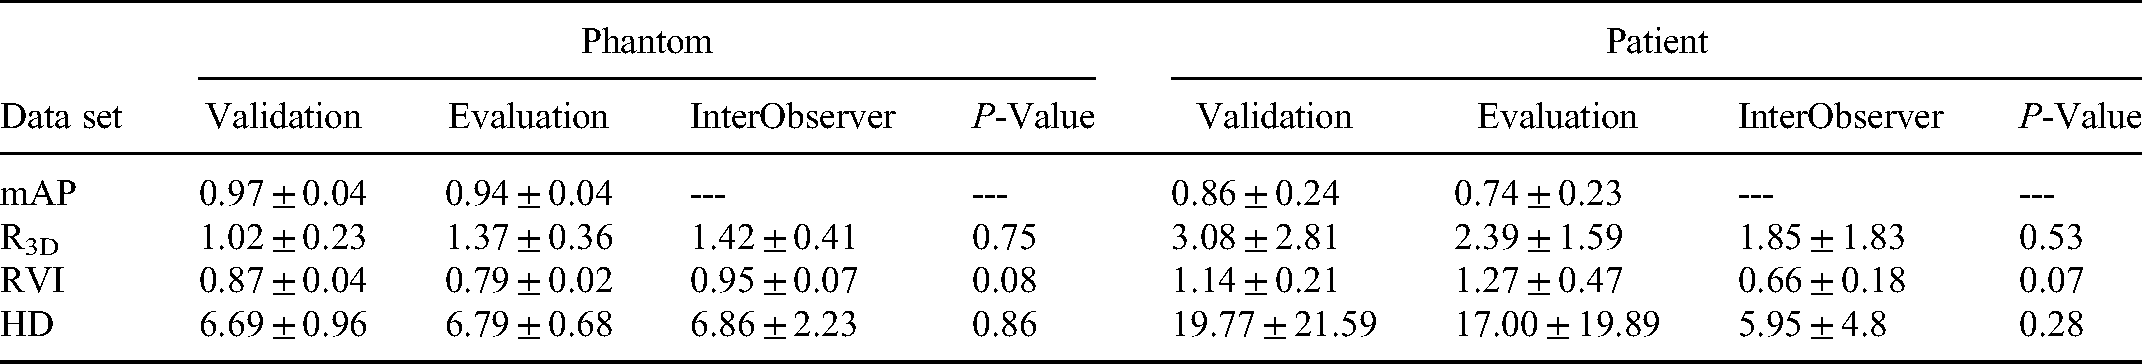
The mAP is a primary metric for the MSCOCO to evaluate the model's performance to correctly identify the target location and categories. The mAP is 0.97 ± 0.04 and 0.94 ± 0.04 for phantom validation and evaluation, respectively. The HD and RVI values are similar for validation and evaluation. The R3D value shows a small difference, with 1.02 ± 0.23 for validation and 1.37 ± 0.36 for evaluation, respectively. These results are summarized in Table 2. The p-values of R3D, RVI, and HD are 0.75, 0.08, and 0.86, respectively. No significant difference was found in these results.
Model Performance of Phantom and Patient.
Patient
The contouring in axial, sagittal, and coronal views well agree with each other, demonstrating a good model in predicting the tumor delineation in CBCT. The mAP achieved in both the validation set and evaluation set are 0.86 ± 0.24 and 0.74 ± 0.23, respectively, as illustrated in Table 2. The R3D, RVI, and HD achieved averaged values for the validation set are 3.08 ± 2.81, 1.14 ± 0.21, and 19.77 ± 21.59, respectively. For the evaluation set, the R3D, RVI, and HD achieved averaged values to be 2.39 ± 1.59, 1.27 ± 0.47, and 17.00 ± 19.89, respectively. Compared to the interobserver results, the p-value can be achieved as 0.53, 0.07, and 0.28, respectively. These p-values show no significant difference between manual contouring and deep learning (DL)-based contouring.
In addition to the quantitative evaluation presented above, we selected 2 cases (one for the phantom and one for a patient) in different views for visual assessment. Figure 6 shows multiplanar reconstruction images for these 2 cases. The model correctly identifies the position of the tumor and contours the tumor margin for both phantom and patient. The contouring is also similar to the physician's contouring. The visual evaluation shows that the results are reasonable.
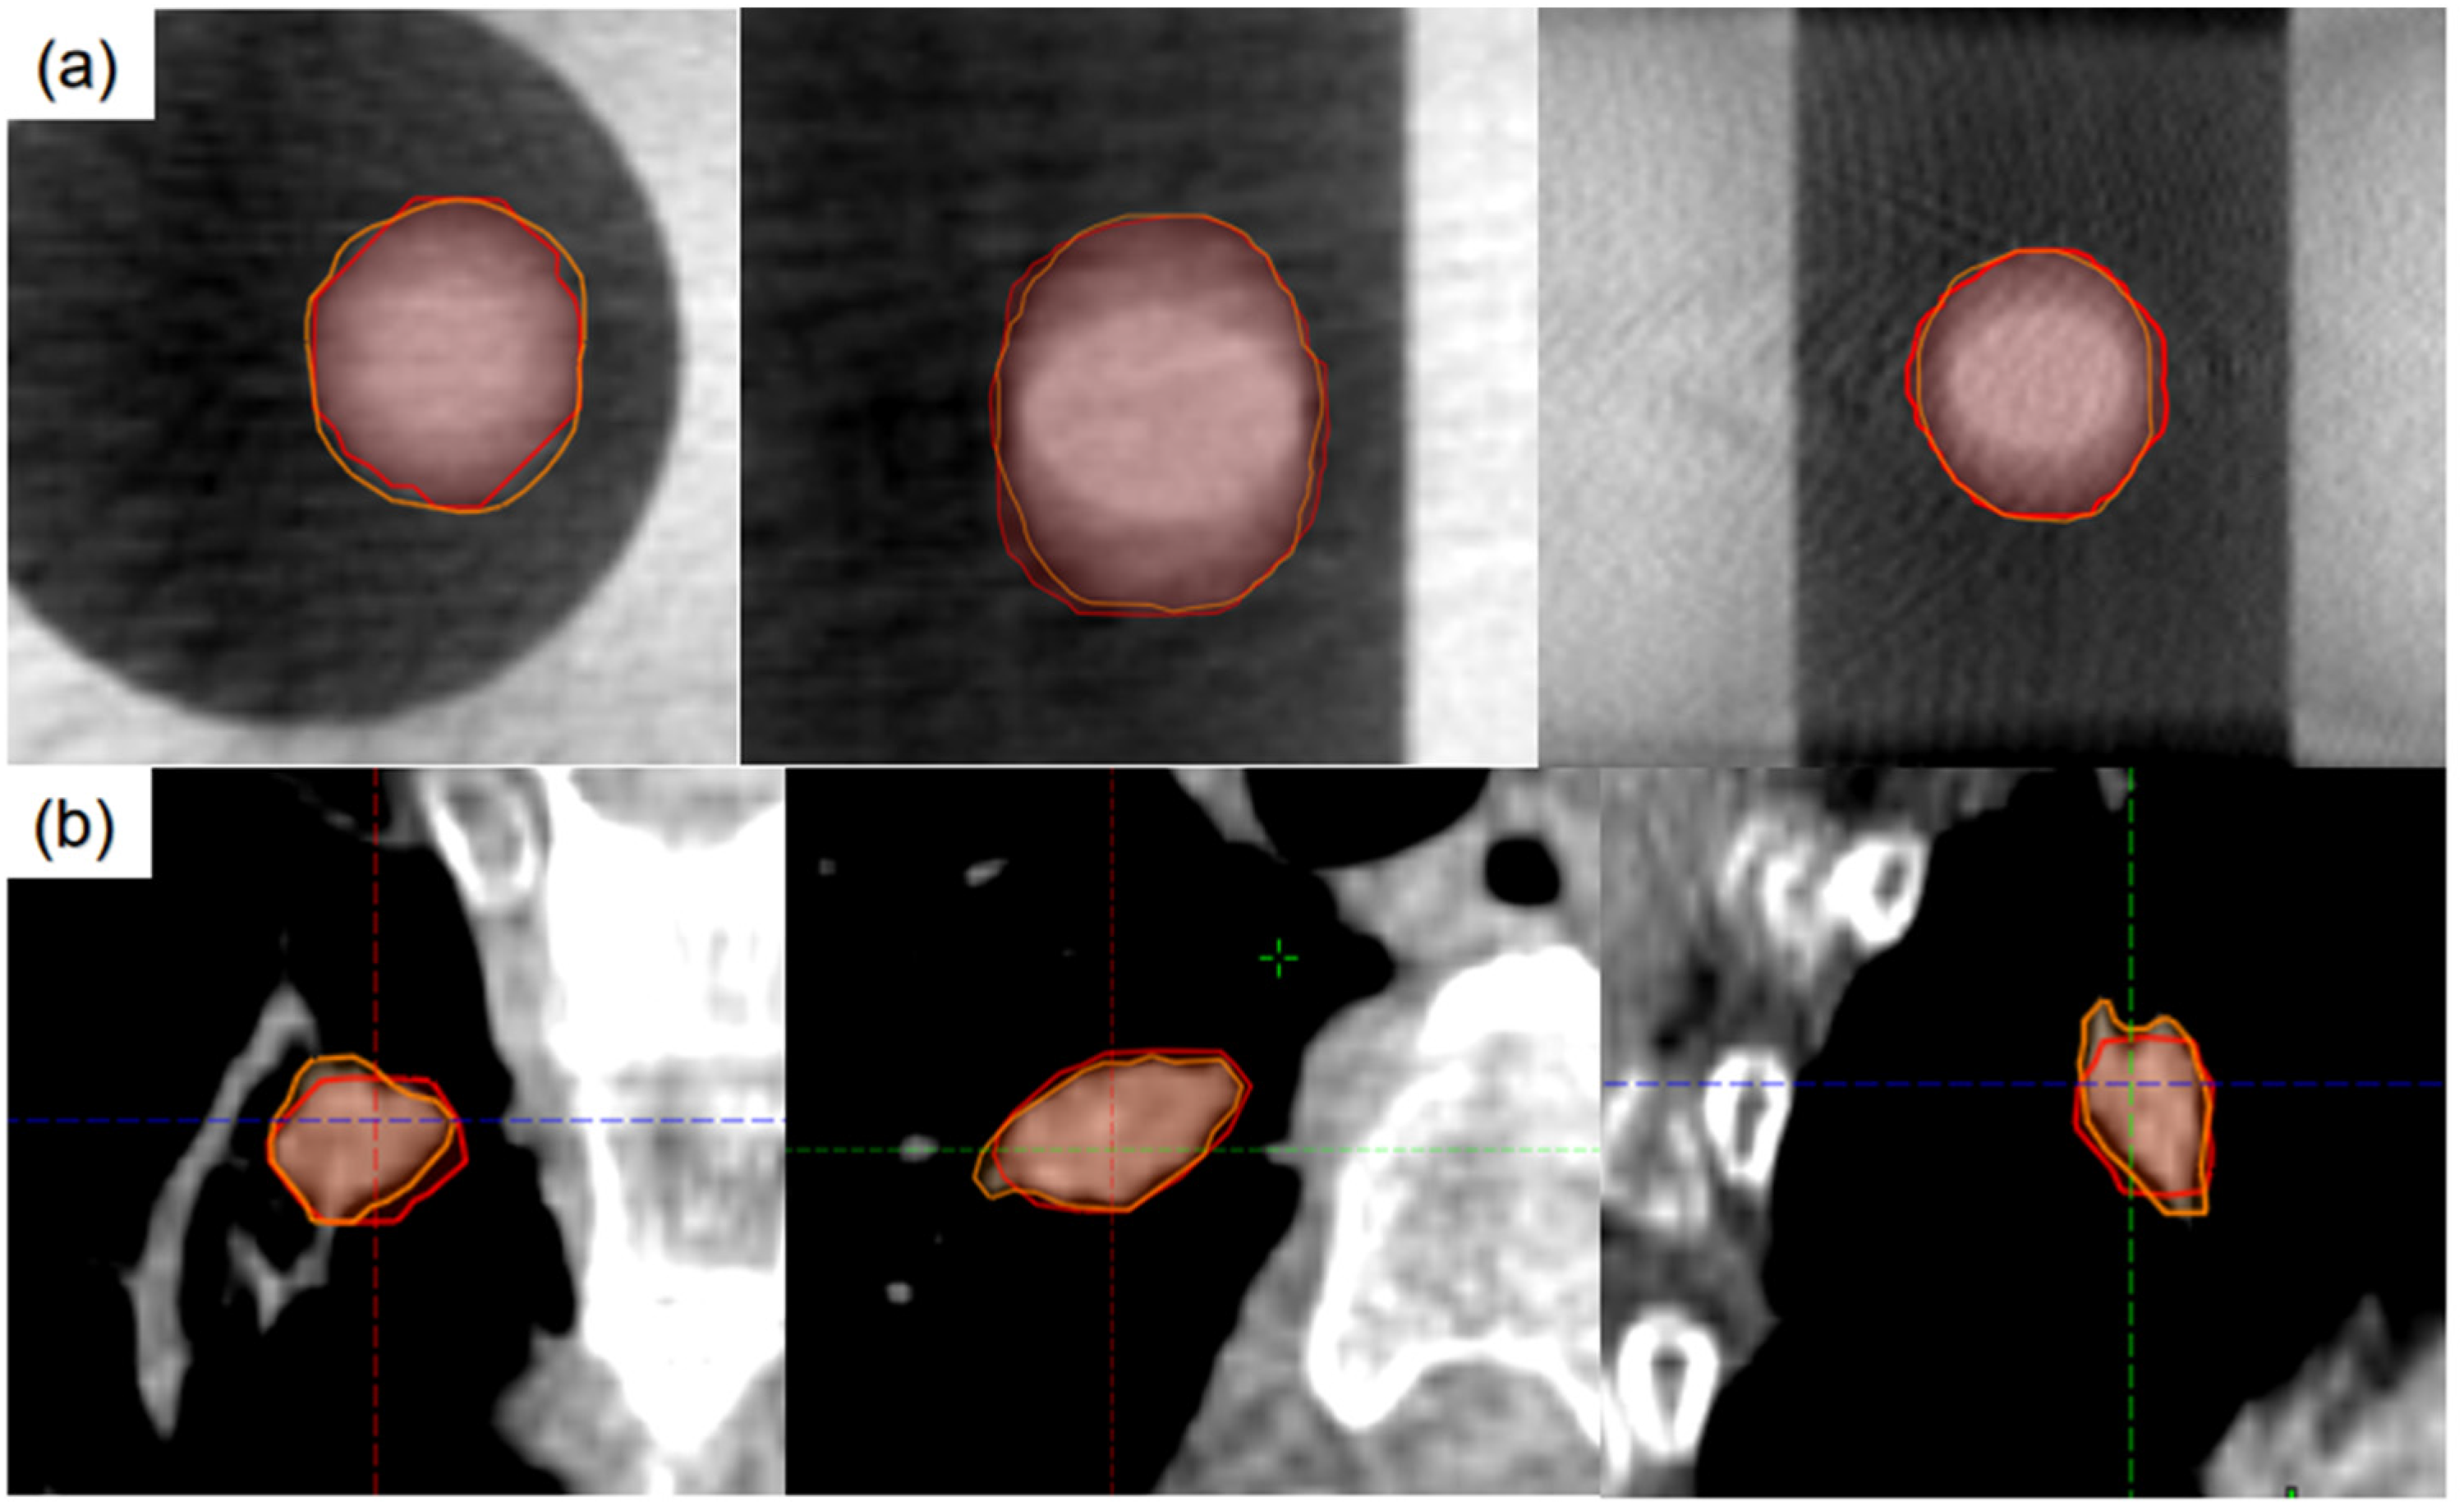
Predicted internal target volume (ITV) in different views of phantom images (a) and patient images (b). Red line: predicted ITV; Orange line: manually contoured ITV.
Discussion
In this study, we proposed an auto-contouring method of CBCT images based on an improved Mask R-CNN model. The results show a good ITV prediction on CBCT images when the data is pre-processed using an extended cubic box from the target. Before training the model, we conducted a phantom study to evaluate the tumor ITV similarity among 4DCTFB, 4DCTAVG, 4DCTMIP, and CBCT. The result shows a good match between 4DCTMIP and CBCT with a DSC of 0.86 ± 0.16, and a DSC of 0.83 ± 0.18 for 4DCTAVG and CBCT, respectively. The possible reason is that CBCT, 4DCTAVG, and 4DCTMIP all include the target motion information in all respiratory phases. This preliminary result paves the way for the following study and demonstrates the feasibility of using CBCT images to predict tumor ITV.
The averaged mAP for phantom evaluation and patient evaluation are 0.94 ± 0.04 and 0.74 ± 0.23, respectively, where the phantom result is better than the patient. This is reasonable, as the complicated vessels and structures in the lung and irregular tumor shapes make tumor segmentation in patients more challenging. The RVI evaluation presents good results for both 2 sets, with 0.79 ± 0.02 for the phantom and 1.27 ± 0.47 for the patient. The results demonstrated that the model could predict the tumor contouring with good accuracy.
The network is pretrained with COCO dataset. In this study, the CBCT image size was rescaled to 1024 × 1024 and the anchor sizes were set to be 8 × 8, 16 × 16, 32 × 32, 64 × 64, and 128 × 128. The decreased anchor size and increased image size can improve the bounding box detection precision. In the training process, we used a two-stage training process. In stage 1, only head layers with RPN are trained, the tumor regions are determined in stage 1. In stage 2, the masks are trained. The two-stage training process can increase the training efficiency. Inspired by the work of CBAM, 27 we propose spatial attention module and channel attention module, which are used as plug-and-play modules in the network. Attention is required to be focused on the tumors and ignore the cluttered and complicated background in the lung.
However, there are several limitations to this study. Firstly, the accuracy of the model is largely affected by the image quality of the CBCT. Thus, a series of rigid and eligible CBCT scanning parameters should be evaluated and validated before CBCT image acquisition. In this study, we use a Gaussian filter and PWLS algorithm to suppress the image noise. More scatter correction methods can be considered in future studies to reduce the artifacts and improve CBCT image quality.32,33 Secondly, we found that the predicting accuracy largely decreased when the ITV of the tumor was smaller than 3 cm3. The mAP, R3D, RVI, and HD are 0.70 ± 0.34, 4.29 ± 2.83, 0.86 ± 0.39, and 25.47 ± 25.13, respectively. A potential reason can be that in the current data, most patients have tumors with tumor volumes larger than 3 cm3. During the training stage, the model learned from much more relatively large volume tumors than small tumors. Thus, this model tends to be more precise for large tumor volumes. Therefore, further tests are needed for future study with more patients’ data spread in a more uniform distribution of tumor volumes. Thirdly, the image data set for training is only 124 in this model, limiting the accuracy of the model. Thus, the accuracy of the results can be ensured by enrolling more patients in future studies. For the potential method to increase the sample size, ensemble learning 20 and the combination of axial, coronal, and sagittal slices 34 can be used in the future.
Unlike the conventional end-to-end fully convolutional network, the improved Mask R-CNN first finds the tumor location and creates a box to limit the tumor area before training and then segment the object via the features extracted from convolutional layers. Therefore, the improved Mask R-CNN can eliminate useless features from the nontumor region and thus tackle the challenges during segmentation.
The deep learning-based model can be considered as an effective tool when 4DCT is not available in the hospital. This work demonstrated the potential value for CBCT as an alternative imaging method in ITV contouring. Moreover, the model can predict ITV in less than 1 min with a GPU of GTX1080. Thus, it can significantly increase the efficiency in clinical work. Another potential application can be real-time ITV evaluation using weekly CBCT images during treatment since the tumor shrink quickly after accepting radiation. 35 This evaluation would offer valuable ITV information for physicians and allow them modify the plan when necessary timely. This model also has a great potential to be applied to non-SBRT lung cancer patients in the future.
Conclusion
In this study, an improved Mask R-CNN-based neural network model was proposed to perform the ITV prediction in CBCT. The predicted results showed a good agreement with physicians’ manual contouring in 4DCTAVG. Our preliminary results demonstrated that the improved Mask R-CNN model could accurately complete the ITV prediction in CBCT after image pre-processing. With the good ITV prediction, the current model has excellent potential for clinical application. It can be satisfactorily adopted in institutions with no 4DCT to improve the SBRT treatment accuracy under the supervision of experienced physicians.
Footnotes
Abbreviations
Ethics Approval and Consent to Participate
All the medical images were obtained with the informed consent of all participants. The institutional review board of the Fudan University approved the protocol of Deep Learning-Based Internal Target Volume (ITV) Prediction Using Cone-beam CT Images in Lung Stereotactic Body Radiotherapy, code 2019K025.
Declaration of Conflicting Interests
The authors declared no potential conflicts of interest with respect to the research, authorship, and/or publication of this article.
Funding
The authors disclosed receipt of the following financial support for the research, authorship, and/or publication of this article: This work was partially supported by the National Natural Science Foundation of China (Grant Nos. 11505029 and 81472794), Shanghai Municipal Commission of Health (Grant Nos. 2018BR23 and 20184Y0099), and Shanghai Municipal Science and Technology Commission (Grant No. 18441904400).