
Abstract
Purpose:
Large tumor motion often leads to larger dosimetric variation, especially in lung tumors located in lower lobe and adhered to chest wall or diaphragm. The purpose of this work is to discuss the impact of the time proportion of each respiratory phase on dosimetry in stereotactic body radiation therapy with lung cancer tumor close to chest wall or diaphragm.
Methods:
Participants include 14 patients with lung cancer located in the lower lobe. Each patient received treatment planning 3-dimensional computed tomography and an additional 4-dimensional computed tomography simulation under free-breathing condition. The percentage of time intervals for each respiratory phase in a whole respiratory cycle was calculated from respiratory motion curves recorded during 4-dimensional computed tomography scanning. Treatment plan was made upon treatment planning 3-dimensional computed tomography and then transformed onto each image of 4-dimensional computed tomography. The transformed doses on each image of 4-dimensional computed tomography were accumulated with equal weight or with weight of time proportion for each respiratory phase.
Results:
Compared to treatment planning 3-dimensional computed tomography dose, the mean dose of tumor, affected lung, contralateral lung, bilateral lungs, and V20 of affected lung decreased by 2.7%, 4.5%, 1.5%, 1.2%, and 4.1%, respectively, after equal-weighted accumulation, while mean dose of heart increased by 3.6% (P < .05). Accumulated dose with weight of actual time proportion decreased in the mean dose of tumor, affected lung, contralateral lung, bilateral lungs, and V20 of affected lung by 2.37%, 5.19%, 3.61%, 3.46%, and 5.08%, respectively compared to treatment planning 3-dimensional computed tomography dose, but mean dose of heart increased by 5.12% (P < .05).
Conclusions:
Doses received by tumor, lungs, and heart changed more significantly after time-weighted 4-dimensional accumulation than equal-weight 4-dimensional accumulation. Utilizing 4-dimensional computed tomography and deformable image registration to introduce time proportions of each respiratory phase to dose distribution evaluation is of significance for accuracy in lung cancer during stereotactic body radiation therapy treatment.
Introduction
Radiotherapy, as one of cornerstones of the comprehensive treatment of cancer, plays an important role in the treatment of lung cancer. 1 Radiotherapy is required in 50% of patients with locally advanced lung cancer in practice. However, 3 factors render lung cancer difficult to treat: respiratory motion, the presence of numerous neighboring organs with a low radiation tolerance, and dosimetric difficulties caused by the presence of tissue inhomogeneities. 2 Tremendous technologic progress in radiotherapy treatment in the past decades is advancing the picture. These advances include radiation delivering technology such as 3-dimensional conformal radiotherapy, intensity-modulated radiotherapy (IMRT), image-guided radiotherapy, stereotactic body irradiation, and proton beam therapy.
Stereotactic body radiation therapy (SBRT) is used to deliver high and ablative doses of radiation in limited number of fractions. The SBRT covers a wide range of tumor types, among which lung cancer accounts for about 90%. 3 The therapeutic effect of SBRT is equivalent to surgery for early-stage non-small cell lung cancer. 4 For elderly and intolerant patients, SBRT is considered prior to surgery. However, during SBRT, high dose is given in a single fraction. Minor dosimetric error can cause failure of the whole SBRT treatment; therefore, SBRT requires higher accuracy of dosimetry. In SBRT treatment of lower lobe lung cancer, considerable error of dose happens due to displacement and deformation of the tumor and surrounding organs along with respiration. 5 It is reported that the displacement of the tumors in liver, lung, and adrenal gland can be up to 34, 35, and 27 mm, respectively, due to respiration, making it difficult to accurately assess the doses received by tumor and organs at risk (OARs). 6 -8
Recently, 4-dimensional computed tomography (4DCT) can be acquired during simulation to locate tumor and OARs, and deformation image registration (DIR) technology is used to accumulate doses, better evaluating the effects of respiratory movement on doses received by patients based on the images of all respiratory phases. 5,9,10 The DIR is a method to transform multiple image data sets into 1 coordinate system, making it possible to connect points in images taken under different situation. 11 This technology is widely used in clinical studies, especially in radiation treatment. Dose calculation is based on DIR technology by matching images of 10 respiration phases dot by dot. However, the previous studies did not take the time proportions of each respiratory phase in a whole respiratory cycle into dose accumulation, assuming all phases are equally weighted. But in fact, time proportion of respiratory phases vary greatly between phases and individuals. In this study, the impact of time proportion of respiratory phases due to respiratory movement on dosimetry in SBRT of non-small cell lung tumor located in lower lobe is discussed based on 4DCT and DIR technology.
Methods
Patients Characteristics
Fourteen patients of stage II to III small cell lung cancer in the First Affiliated Hospital of Xi’an Jiaotong University from 2016 to 2018 were randomly selected in this retrospective study. The selection criteria for patients’ enrollment were clear diagnoses of stage II to III small cell lung cancer of the lower lobe and received IMRT treatment. The patients consist of 6 males and 8 females. The age of patients ranged from 25 to 72, with a median age of 64 years. This study is approved by the Medical Ethical Committee of First Affiliated Hospital of Xi’an Jiaotong University. All patients signed the informed consent form.
Computed Tomography Simulation and Respiratory Motion Acquisition
Patients were immobilized in the supine position with arms crossed on forehead and chest fixed with thermoplastic model during scanning. First, axial scan was performed during free-breathing using Brilliance-16 Big Bore CT scanner (Philips Medical Systems, the Netherlands) to produce the treatment planning 3-dimensional computed tomography (TP-3DCT), covering from cricoid cartilage to adrenal gland. Then patients were conducted an additional 4DCT simulation under free-breathing condition. The image layer thickness was set to 3 mm.
During 4DCT scanning, patients’ respiratory signals were automatically recorded by the computed tomography (CT) machine. The 4DCT data were sorted into 10 sequence images of different respiratory phases (0%, 10%, 20%,…90%). The end of inspiration is represented as 0% respiratory phase, while 50% respiratory phase stands for the end of expiration. To mark each respiratory phase, names were given from 0% to 90%: 0RE, 10RE, 20RE,…90RE. The names of each respiratory phase identified the percentage of full respiration reached. In this study, the Quasar Respiratory Motion software (Modus Medical Devices Inc, Ontario, Canada), version 3.3.8, was applied to analyze the respiration curves. Three respiratory cycles were randomly selected from the respiration curves to calculate the maintenance time (△t0-90) of 10 respiratory phases (0RE-90RE) and the time proportion each respiratory phase takes in a whole respiratory cycle (P0-P90).
Manual Contouring and Treatment Planning
Both TP-3DCT and 4DCT were transferred to the Pinnacle Treatment Planning System (version 9.0; Philips Medical Systems, Fitchburg, USA), on which gross tumor volume (GTV), volumes including lungs, heart, spinal cord, and other OARs were contoured by an experienced radiation oncologist. The clinical target volume (CTV) was formed by applying an 8-mm isotropic expansion to the GTV (squamous cell carcinoma, 6 mm for adenocarcinoma). Planned target volume (PTV) was generated via a 3-mm isotropic expansion of CTV. Treatment planning was generated on TP-3DCT images. The total dose planned was 45Gy/3f and then transformed onto corresponding images of 4DCT for further recalculation.
Dosimetry Comparison
The MIM workstation (MIM Software Inc. Cleveland, OH, USA) was used for dosimetric calculation. First, the dose distributions on each respiratory phase of 4DCT were recalculated by accumulating doses of each respiratory phase with the weight of P0-P90 correspondingly. Then, doses of each respiratory phases were accumulated equal proportionally which is the classic method of 4DCT dose calculation. To properly indicate the 2 approaches, the accumulated doses were named as 4D time-weighted dose and 4D equal-weighted dose, respectively. To investigate whether different respiratory pattern could affect dose distribution of 4DCT treatment, 4D time-weighted dose and 4D equal-weighted dose were compared with the original 3D planned dose of the tumor, lungs, and heart.
Statistical Analysis
Quantitative parameters were represented as [
Results
Respiration Curves and the Maintenance Time (△t0-90) of 10 Respiratory Phases
The movement curve of free respiration recorded during simulation is shown in Figure 1A. From Figure 1, it can be concluded that the thoracic movement is neither linear nor sinusoidal, although patients were immobilized with thermoplastic model over their chest, especially the expiration process that shows a smaller slope than the inspiration process. The respiration curves of the patients recorded was fitted into curve shown in Figure 1B. P0-P90, time proportions of each respiratory phase, were calculated in 3 randomly selected respiratory cycles as shown in Figure 1C. The time proportions of respiratory phases are significantly uneven and reaches maximal near the end of exhalation (P40). The P40 can be 8 times as large as P10, which means the dose in P40 period should be 8 times more influential than that of P10 in dose calculation. This conclusion is not only seen in 1 patient; the multiple between the maximum and the minimum time proportion varies from 3.78 to 9.3.
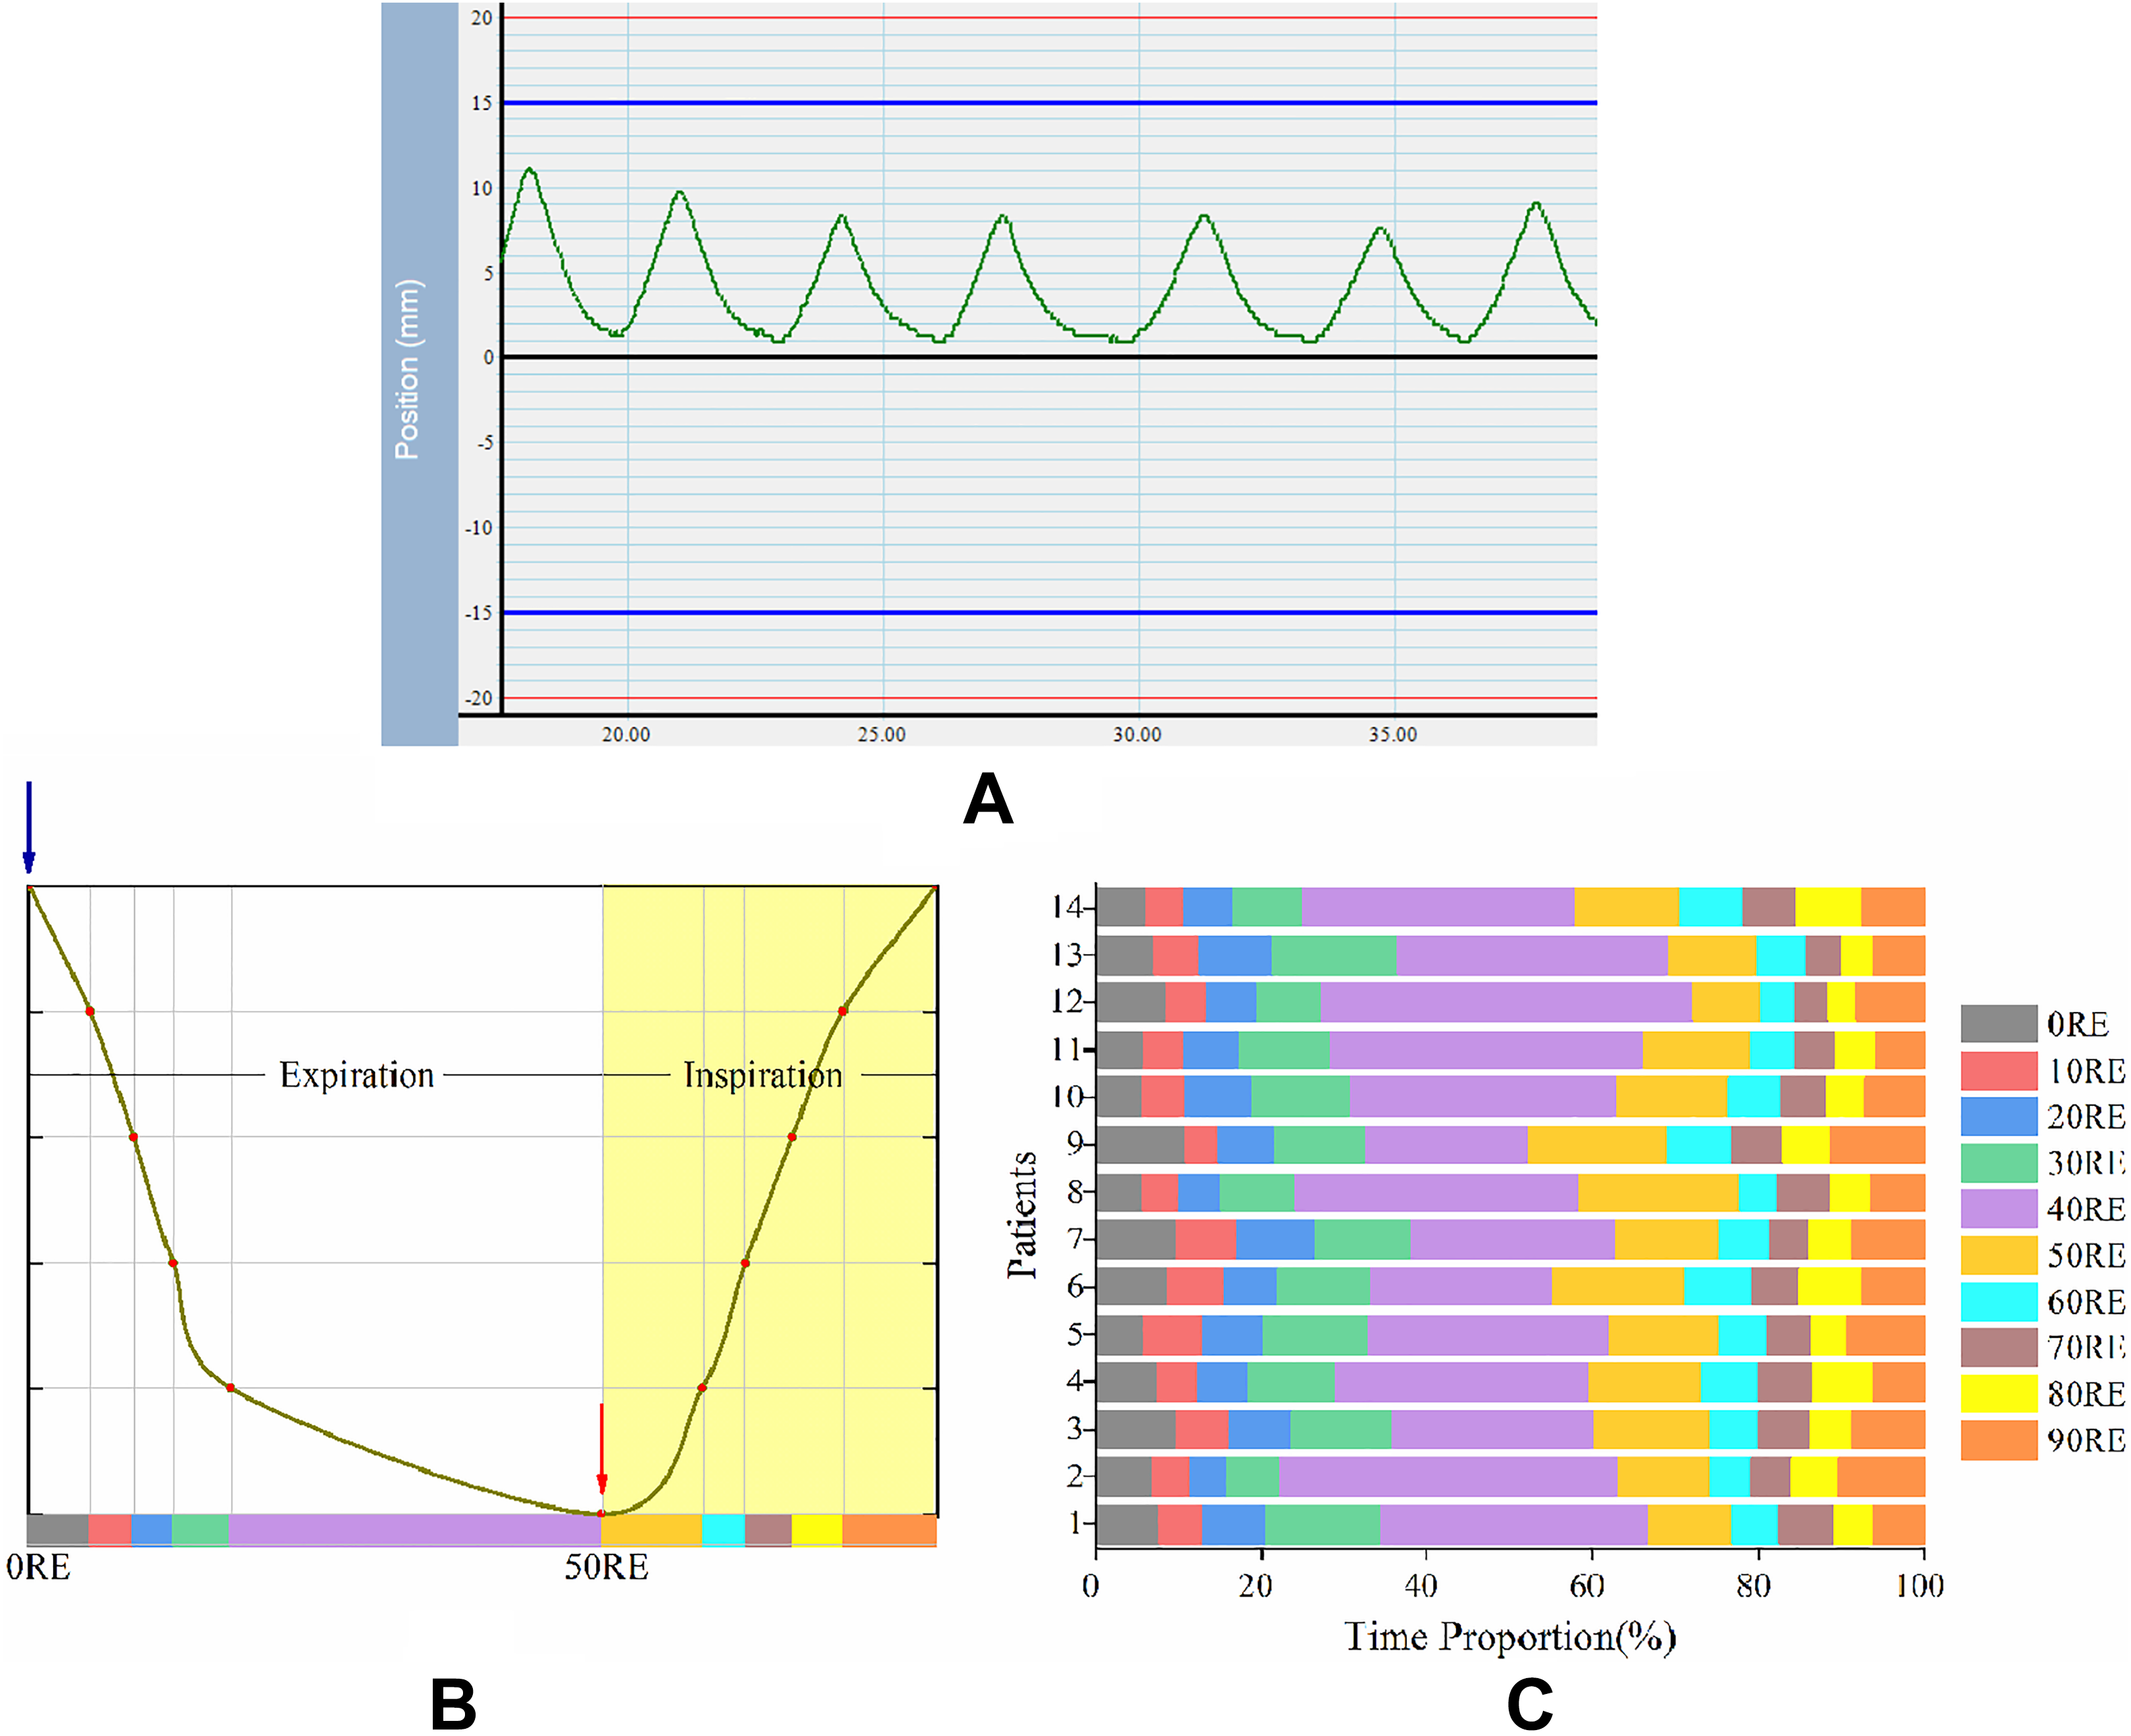
Respiration curve and time distribution of respiratory phases of patients with lung cancer with radiotherapy. A, Original respiration curve recorded during CT scanning. B, Schematic diagram of a respiratory cycle in respiration curves recorded. Blue arrow points at the end-inspiration phase, 0RE, while red arrow points at the end-expiration phase, 50RE. C, The time distribution of 10 respiratory phases of 14 patients are list in percentage histogram.
Dose–Volume Histograms and Dose Distribution
The dose–volume histograms (DVH) of tumor, lungs, and heart after 4D accumulation are shown in Figure 2A-D. It can be seen from 4 DVH figures that the dosage received by heart changes the most between different respiratory phases, whereas doses of the tumor and lungs changed insignificantly. The isodose distributions in transverse, sagittal, and coronal planes for both 3D and 4D treatment are shown in Figure 2E and F.

Dose–volume histogram (DVH) and isodose distribution. (A-D) Both 3D and 4D accumulated DVH of tumor (A), affected side of lung (B), bilateral lungs (C), and heart (D). The blue dashed lines are DVH of 3-dimensional (3D) treatment plan while other solid lines are of 4-dimensional (4D) treatment. (E- and F) Dose distributions of 3D treatment plan (E) and 4D treatment plan (F) on 50RE phase. Solid blue area represents PTV. PTV indicates planned target volume.
Comparison of 4D Equal-Weighted Dose and 3D Dose
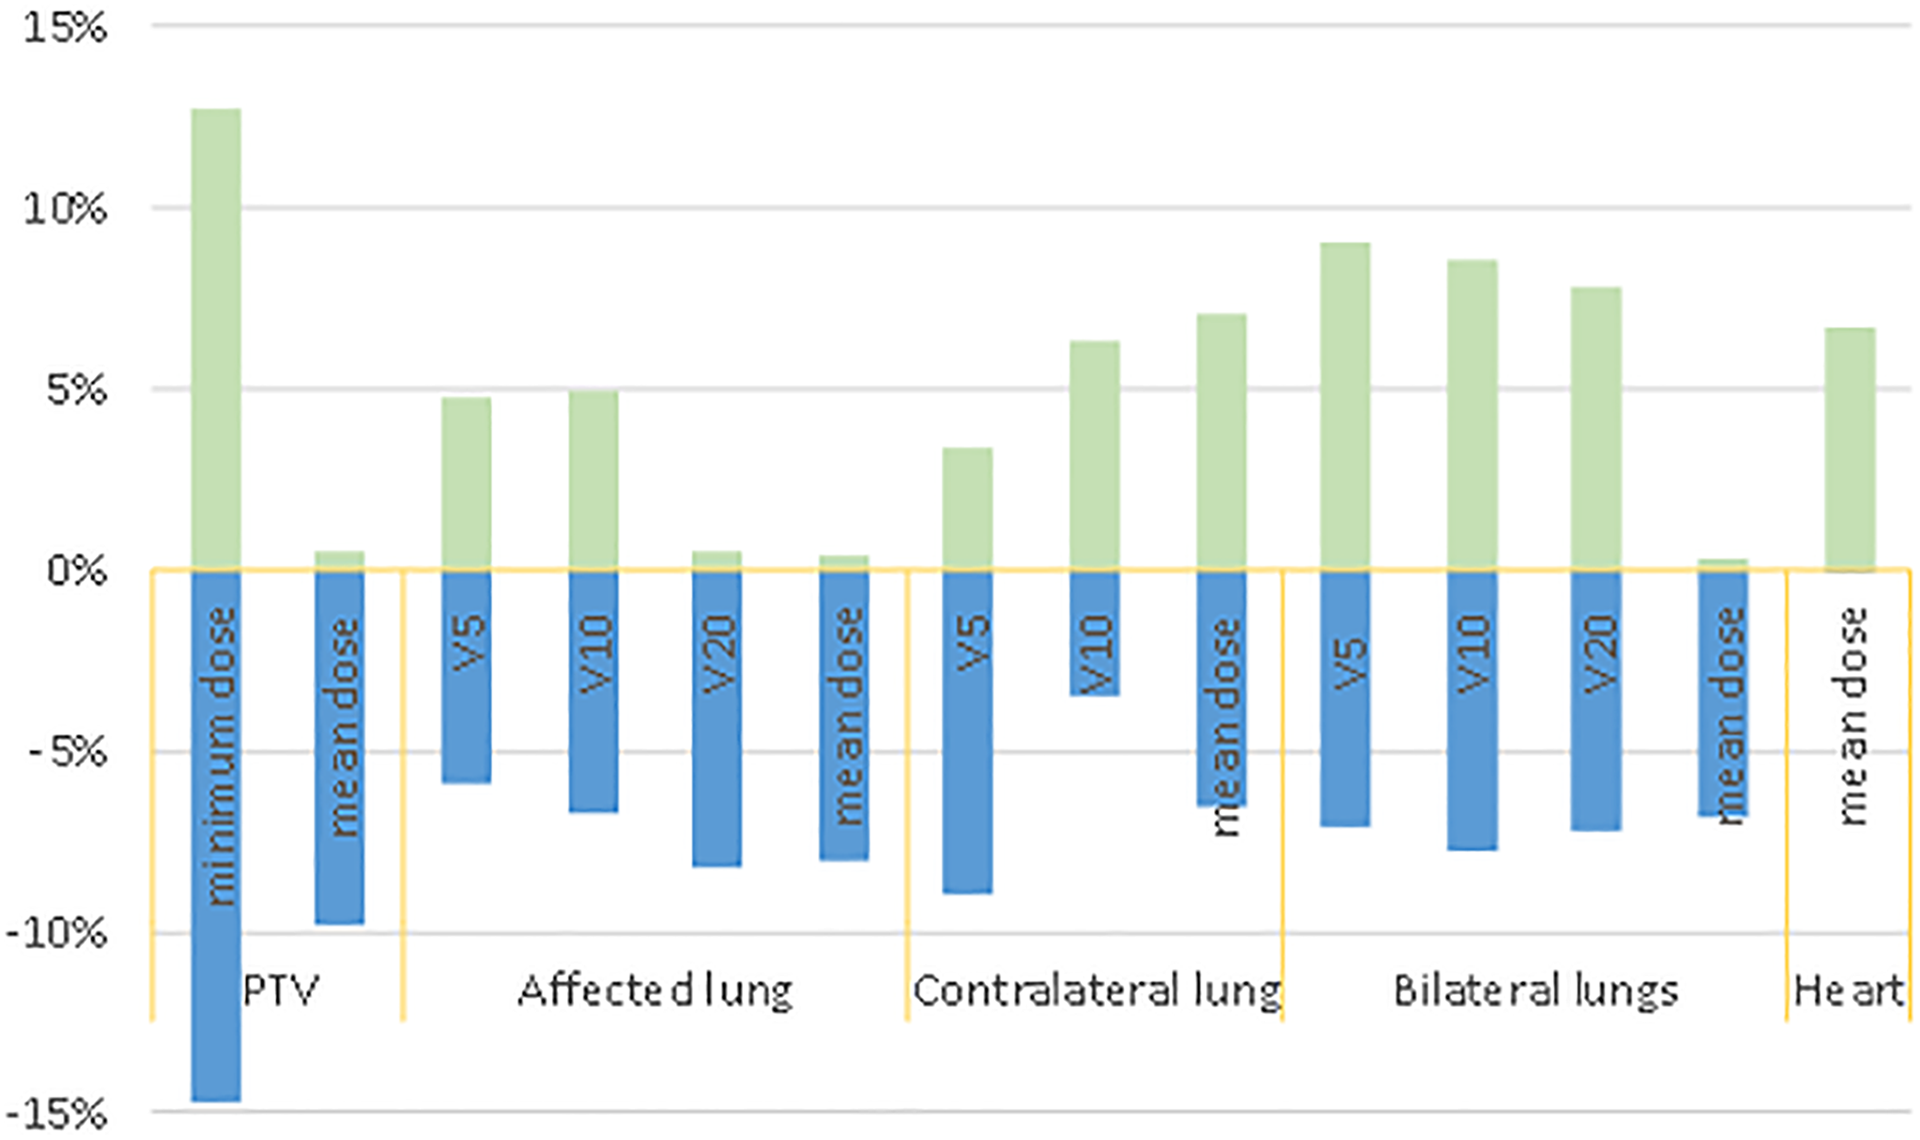
The dosimetric comparison between 4D equal-weighted accumulated dose and 3D dose is listed in Table 1. The 4D equal-weighted dose is less than 3D dose in mean dose of PTV, V20 of affected lung, mean dose of affected lung, mean dose of contralateral lung, and mean dose of bilateral lungs by 2.7%, 4.1%, 4.5%, 1.5%, and 1.2%, respectively (P < .05). But the mean dose received by heart increased by 3.6% after accumulation (P < .05). Compared to 3DCT plan, the range that 4D equal-weighted dose varies for minimum dose of PTV is −9.97%∼12.68%; mean dose of PTV is −4.13%∼0.44%; V5 of affected lung is −4.83%∼4.83%; V10 of affected lung is −6.77%∼7.03%; V20 of affected lung is −8.32%∼0.54%; mean dose of affected lung is −8.34%∼1.64%; V5 of contralateral lung is −8.65%∼2.26%; V10 of contralateral lung is −3.9%∼6.28%; mean dose of contralateral lung is −6.59%∼7.04%; V5 of bilateral lungs is −6.84%∼8.97%; V10 of bilateral lungs is −7.96%∼8.56%; V20 of bilateral lungs is −6.32%∼8%; mean dose of bilateral lungs is −6.59%∼1.16%; and mean dose of heart is 0∼7.06%. These statistics are shown in Figure 3. 4D equal-weighted dose and 3D dose for each individual patient are shown in Supplementary Figures 1B, 2 and 4.
Dosimetric Comparison Between 3D Dose and 4D Equal-Weighted Dose.a

Abbreviations: PTV, planned target volume; V5, 10, 20, percentage of the target volume receiving at least a 5, 10 or 20 Gy dose.
aNS: P ≥ 0.05.
bP < 0.001.
cP < 0.01.
dP < 0.05.

Variation ranges of dosimetric parameters of 4-dimensional (4D) equal-weighted treatment compared to 3-dimensional (3D) treatment.
Comparison of 4D Time-Weighted Dose and 3D Dose
The dosimetric comparison between 4D time proportionally weighted accumulated dose and 3D dose is listed in Table 2. The 4D time proportionally weighted accumulated dose is less than 3D dose in mean dose of PTV, V20 of affected lung, mean dose of affected lung, mean dose of contralateral lung, and mean dose of bilateral lungs by 2.37%, 5.08%,5.19%, 3.61%, and 3.46%, respectively (P < .05). But the mean dose received by heart increased by 5.12% after accumulation (P < .05). The extent of decrease or increase in 4D time-weighted dose compared to 3D dose is significantly greater than 4D equal-weighted dose. Compared to 3D plan, the ranges that 4D time-weighted dose varies for minimum dose of PTV is −14.73%∼12.73%; mean dose of affected lung is −9.78%∼0.51%; V5 of affected lung is −5.9%∼4.72%; V10 of affected lung is −6.75%∼4.98%; V20 of affected lung is −8.24%∼0.51%; mean dose of affected lung is −8.09%∼0.39%; V5 of contralateral lung is −8.94%∼3.33%; V10 of contralateral lung is −3.48%∼6.34%; mean dose of contralateral lung is −6.59%∼7.04%; V5 of bilateral lungs is −7.12%∼8.99%; V10 of bilateral lungs is −7.76%∼8.56%; V20 of bilateral lungs of −7.25%∼7.81%; mean dose of bilateral lungs is −6.81%∼0.27%; and mean dose of heart is −7.81%∼6.68%. These statistics are shown in Figure 4. Variations after 4D time-weighted accumulation are greater than 4D equal-weighted accumulation in dosimetric parameters analyzed except for V10, V20, and mean dose of affected lung and mean dose of bilateral lungs.4D time-weighted dose and 3D dose for each individual patient are shown in Supplementary Figures 1A, 3 and 4.
Variation ranges of dosimetric parameters of 4-dimensional (4D) time-weighted treatment compared to 3-dimensional (3D) treatment.
Dosimetric Comparison Between 3D Dose and 4D Time-Weighted Dose.a

Abbreviations: PTV, planned target volume; V5, 10, 20, percentage of the target volume receiving at least a 5, 10 or 20 Gy dose.
aNS: P ≥ 0.05.
bP < 0.001.
cP < 0.01.
dP < 0.05.
Discussion
The SBRT is a preferred means of non-small cell lung cancer treatment with good clinical outcome. However, in the process of SBRT for lung cancer, the tumor, lung, and heart move parallel with respiratory movement, causing large displacement and deformation. 12,13 Such displacement and deformation may affect the dose that the tumor and OARs actually receive during SBRT treatment, dampening treatment prognosis. Therefore, the exact doses received by tumor and OARs during SBRT of lung cancer needs to be corrected.
In this study, TP-3DCT and 10 series of 4DCT images were collected. Treatment plan generated on TP-3DCT was transferred to each respiratory phase of 4DCT. Using DIR technique, doses of all 10 phases were accumulated with equal weights obtaining the accumulated 4D dose. By comparing dosimetric parameters between 3D and 4D accumulated doses, we found that doses of the tumor and lungs decreased, while dose of the heart increased after accumulation due to respiratory movement. Ehrbar et al 14 also used 4DCT and DIR technology to assess the effect of respiratory movement on SBRT in the treatment of patients with lung cancer and found that the deviation between 3D and 4D PTV doses was −2.1%∼1.4%; deviation between 3D and 4D OARs doses was −0.8%∼1.7%. This result is similar to Rao et al’s and Zou et al’s, but their results are less significant than what we analyzed in this research, possibly owing to different tumor locations. 11,15 In this study, all patients’ tumors were located in the lower lobe of lungs that are more affected by respiratory movement, causing more significant dose errors to both tumor and OARs, particularly to the minimum dose of the tumor with an increase of 12.68% after 4D dose accumulation. Besides, Ehrbar et al fixed the respiratory cycle to 3.4 seconds and 6.8 seconds without considering individual differences, resulting in less difference between 3D and 4D doses. 14 Respiration-gated technology is applied to reduce target margins. However, Zhao et al 16 found that target baseline shift could reach 5.3 mm during a 30-minute SBRT treatment because reproducible respiration was difficult to maintain. Although treatments were respiration gated, 2 of 12 treatments showed significant tumor excursion mainly due to baseline shift. Their results also indicate that respiratory motion amplitude significantly reduced after customizing gating window for each patient. Whether respiration gating and phase-based dose accumulation combined can modify SBRT dose distribution more precisely needs further investigation.
In conclusion, the patients’ respiratory movement led to a significant decrease in doses received by tumor and lungs. Using 4DCT and DIR technology, together with time proportion of each respiratory phase, the impact of respiration on dosimetric parameters in SBRT of lower lobe lung cancer can be more accurately evaluated.
Supplemental Material
supplementary_materials - Impact of the Time Proportion of Respiratory Phases on Dosimetry in SBRT of Lung Tumor Near the Chest Wall or Diaphragm
supplementary_materials for Impact of the Time Proportion of Respiratory Phases on Dosimetry in SBRT of Lung Tumor Near the Chest Wall or Diaphragm by Xuanzi Sun, Yi Li, Junjun Li and Xiaozhi Zhang in Technology in Cancer Research & Treatment
Footnotes
Authors’ Note
Informed consent to participate was obtained from all participants or their legal guardian.
Declaration of Conflicting Interests
The author(s) declared no potential conflicts of interest with respect to the research, authorship, and/or publication of this article.
Funding
The author(s) disclosed receipt of the following financial support for the research, authorship, and/or publication of this article: This work is approved by the medical ethical committee of First Affiliated Hospital of Xi’an Jiaotong University (No: XJTU1AF2018LSK-320).
Supplemental Material
Supplemental material for this article is available online.
Abbreviations
References
Supplementary Material
Please find the following supplemental material available below.
For Open Access articles published under a Creative Commons License, all supplemental material carries the same license as the article it is associated with.
For non-Open Access articles published, all supplemental material carries a non-exclusive license, and permission requests for re-use of supplemental material or any part of supplemental material shall be sent directly to the copyright owner as specified in the copyright notice associated with the article.