
Abstract
Keywords
Introduction
Breast cancer (BC) is regarded as one of the most pervasive neoplasms in women, which accounts for the second highest mortality statistics among females worldwide. 1 However, in comparison to the developed countries or regions that have decelerated death rates, the developing countries have experienced persistently rising morbidity and mortality. 2 The fundamental disparities among different countries might be attributed to various factors such as demoeconomic model, geographical differences, awareness of the tumorigenesis of BC, diagnostic patterns, inadequate medical support, and primitive diagnostic modalities. 3 The currently available therapies for BC include systemic examination, lymph node detection, radiotherapy, chemotherapy, breast-conserving operation, lymph node biopsy, endocrine treatment, mastectomy, and administration of targeted drugs. 4 Furthermore, as a type of heterogeneous cancer with high metastasis, BC could extensively metastasise to distant organs including the brain, bone, liver, and lung, thereby debilitating the therapeutic effects and increasing the death rate. 5 Physiologically, BC is characteristic for the failure of apoptosis, which modulates BC onset, development, and therapeutic efficiency. 6 In light of the aforementioned literatures, the development of a strategy to rescue the failure of apoptosis is warranted for BC therapy.
As the most extensively studied RNA family, long non-coding RNAs (lncRNAs) are implicated in cancer progression as regulators of cellular pathways, molecular transcription, gene expression as well as the cell viability and apoptosis. 7 LncRNAs are vital components in BC cell biological behaviors and valuable biomarkers for BC monitoring, malignancy, and prognosis. 8 LncRNA AGAP2 antisense RNA 1 (AGAP2-AS1) mediates tumor growth, cancer cell development, survival, mobility, and apoptosis to influence human carcinoma malignancy and relapse.9,10 Notably, a prominent AGAP2-AS1 expression is evident in BC for a mediocre clinical consequence, 11 thus suggesting that AGAP2-AS1 might be detrimental to BC mitigation. Essentially, AGAP2-AS1 can significantly reduce the therapeutic efficiency and clinical reaction of BC via the mechanism of binding to embryonic lethal vision-like protein 1 [hereinafter referred as human antigen R (HuR)] to ATG10 promoter region and exacerbating histone 3 lysine 27 acetylation (H3K27ac) involvement and activating the ATG10 expression. 12 As an oncogenic factor, metastasis-associated protein 1 (MTA1) can interact with various cytokines to effectively modulate cancer metastasis and development with a prominent expression in human tumors. 13 Moreover, MTA1 exacerbates the degree of BC by functioning in the similar mechanism mentioned above. 14 MTA1 ablation retards cell growth and metastasis and elicits apoptosis in triple-negative breast cancer. 15 From the aforementioned literature, we speculate that AGAP2-AS1 might mediate BC cell resistance against apoptosis via the modulation of MTA1. Thus, functional assays are conducted in an attempt to verify the speculation.
Materials and Methods
Ethics Statement
This study was performed with approval and under supervision of the ethics committee of ××. Each step of clinical acquisition was rigorously performed according to the recommendations of the Declaration of Helsinki. All patients provided signed written informed consents, and we de-identified all patient details. The animal experiment protocol was supported by the Institutional Animal Care and the Use Committee of ×× and followed the ARRIVE guidelines 2.0 16 and the Guidelines for the Care and Use of Laboratory Animals eighth Edition by National Institutes of Health. 17 Optimal measures were taken to minimize the number and suffering of animals. The current study conformed with the STROBE guidelines 18
Clinical Sample Collection
A total of 30 BC patients (38-65 years old) treated in ×× from a period between January 2018 to January 2019 were enrolled in this experiment for the isolation of BC tissue and paracancerous tissue specimens, which were preserved at −80°C. The inclusion criteria were as follows: (1) patients were pathologically diagnosed with BC; (2) no patients received chemotherapy or radiotherapy prior to operation; (3) complete patient history was provided. The exclusion criteria were as follows: (1) patients received radiotherapy or chemotherapy before surgery; (2) disagreement to isolate specimens from the patients; (3) other chronic diseases or malignant tumors.
Cell Culture
Human BC cell lines [BT-474 (derived from breast), MCF-7 (derived from pleural effusion), SK-BR-3 (derived from pleural effusion), and MDA-MB-231 (derived from pleural effusion)] and human normal mammary epithelial cells MCF-10A (derived from breast) (American Type Culture Collection, ATCC, Manassas, VA, USA) passed STR identification and were cultured in Roswell Park Memorial Institute-1640 medium (Gibco Company, Grand Island, NY, USA) containing a combination of 10% fetal bovine serum (FBS, Gibco) and 1% penicillin-streptomycin (Gibco) in a 37°C humidifying incubator with 5% CO2.
Cell Treatment
In line with the knockdown of AGAP2 and HuR, small interfering (si) RNA of target genes, including si-AGAP2-AS1#1, si-AGAP2-AS1#2, si-AGAP2-AS1#3, si-HuR-1, and si-HuR-2 and their negative controls (all from Shanghai GenePharma Co., Ltd, Shanghai, China) were transfected into the MCF-7 cells with the assistance of Lipofectamine 3000 (Invitrogen Inc., Carlsbad, CA, USA) in strict accordance with the provided instructions. The MCF-7 cells were supplemented with 0.1 dimethyl sulphoxide (HY-Y0320, MedChemExpress Co., Ltd, Monmouth Junction, NJ, USA) or 10 μM M344 (a histone deacetylase inhibitor) (HY-13506, MedChemExpress Co., Ltd) for 48 h for subsequent experimentation.
Cell Counting kit-8 (CCK-8) Method
The CCK-8 kit (Beyotime Biotechnology Co., Ltd, Shanghai, China) was employed to assess the MCF-7 cell proliferation. Cells were cultured in 96-well plates for time points of 0, 24, 48, and 72 h, respectively, followed by culture with 10 μL CCK-8 solution at 37°C for 4 h. The optical density value at the excitation wavelength of 450 nm was determined using a microplate reader (Bio-Rad, Philadelphia, PA, USA).
Colony Formation Assay
The treated MCF-7 cells (1 × 10³) were sorted in the culture dish pre-coated with 0.6% agar (the medium was supplemented with 20% FBS), and cultured in a 37°C incubator with 5% CO2. After 14 days, the cells were stained using 0.04% crystalline violet (Beyotime Biotechnology Co., Ltd) for 40 min, and the colonies were documented and counted under an inverted microscope (Ti2, Nikon, Tokyo, Japan).
Flow Cytometry
The treated MCF-7 cells (3 × 10⁵ cells/well) were inoculated in multiple 6-well plates, detached using trypsin (Gibco), and rinsed with phosphate buffer saline (PBS, Gibco). Next, the apoptotic rate was measured using the Annexin V-fluorescein isothiocyanate (FITC)/propidium iodide (PI) apoptosis assay kit (Sigma-Aldrich, Merck KGaA, Darmstadt, Germany). The apoptotic cells were stained with Annexin V-FITC and PI and determined using a flow cytometer (Beckman Coulter, Kraemer Boulevard, CA, USA) and FCSalyzer (v0.9.22).
RNA Stability Experiment
MCF-7 cells were treated with actinomycin D (5 μg/mL) (HY-17559, MedChemExpress Co., Ltd) and collected at 0, 3, 6, and 9 h after actinomycin D treatment. The RNA content was extracted using the TRIzol reagent (Invitrogen), and the AGAP2-AS1 expression was assessed by reverse transcription quantitative polymerase chain reaction (RT-qPCR).
RNA Pull-Down Assay
AGAP2-AS1 was transcribed with the T7 RNA polymerase in vitro, purified using the RNeasy Plus Mini Kit (Qiagen Company, Düsseldorf, Hilden, Germany), and treated with DNase I (Qiagen). Fresh MCF-7 cell lysis buffer was prepared using the magnetic RNA-Protein Pull-Down Kits (Thermo Fisher Scientific). The extracted cell proteins were harvested and cultured with the biotinylated RNA probes targeting AGAP2-AS1 within the magnetic beads. The extracted HuR protein was further verified through western blot analysis.
RNA Immunoprecipitation (RIP)
RIP assay was conducted in strict accordance with the provided instructions of the EZ-Magna RIP kit (Millipore, Billerica, MA, USA). The acquired MCF-7 cell lysis buffer was incubated with the HuR antibody (at a dilution ratio of 1:30, ab200342, Abcam Inc., Cambridge, MA, USA) in magnetic beads, with immunoglobulin G (at a dilution ratio of 1:5000, IgG, ab172730) as the control. All precipitates were analyzed by RT-qPCR.
Chromatin Immunoprecipitation (ChIP)
ChIP was performed using the EZ ChIP Kit (Millipore). Specifically, the MCF-7 cells were harvested using 4% formaldehyde (Beyotime Biotechnology Co., Ltd), lysed with radio-immunoprecipitation assay (RIPA) buffer (Beyotime), and sonicated to isolate the DNA fragments. Immunoprecipitation was conducted using H3K27ac antibody (at a dilution ratio of 1:12.5, ab4729, Abcam), HuR (at a dilution ratio of 1:30, ab200342, Abcam) or IgG (at a dilution ratio of 1:5000, ab172730, Abcam) according to the provided instructions of the EZ ChIP Kit at 4°C overnight to obtain the cross-linked chromatin, which was further purified using the fragment DNA purification kit (Intron Biotechnology, Seongnam-Si, South Korea) and then subjected to RT-qPCR. The primer sequences of the MTA1 promoter have been enlisted in Table 1.
Primer sequence of MTA1 promoter.
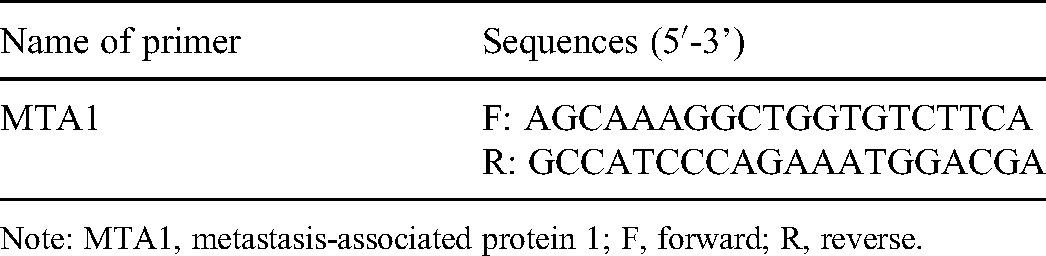
Note: MTA1, metastasis-associated protein 1; F, forward; R, reverse.
Xenografts Tumors in Nude Mice
Additionally, a total of 12 BALB/C female nude mice [6 weeks old, weighing ∼20 g, Beijing Vital River Laboratory Animal Technology Co., Ltd, Beijing, China, SYXK (Beijing) 2017-0033] were housed in a room at 22°C, 60% humidity, under 12 h day/night cycle and with ad libitum access to food and water. After one-week of adaptation, the mice were numbered according to their weight and classified into the control and treatment groups based the random number method, which was recorded by the researcher. Besides, the lentivirus (LV)-short hairpin (sh)-AGAP2-AS1 and LV-sh-NC (both from RIBOBIO, Guangzhou, Guangdong, China) were transfected into the MCF-7 cells to screen the stably transfected cells using puromycin. The MCF-7 cells (1 × 10⁷) with a stably poor AGAP2-AS1 expression were subcutaneously injected into the mouse armpit (N = 12, 1 × 10⁷ cells/mouse). 19 Tumor volume was assessed weekly, and it was estimated as V = (longth × width2)/2. The health and behavioral status of all animals was assessed every two days. Animals were euthanized upon occurrence of the following conditions (humane endpoints): weight loss >10%; being painful by tumor load; tumor maximum diameter > 1.5 cm. No midway deaths were documented during the experiment. Mice were euthanatized 4 weeks after an intrapersonal injection with 1% pentobarbital sodium (150 mg/kg) into mice for tumor isolation and weight analysis. 20 The tumor tissues of 6 mice from each group were sliced into the paraffin-embedding sections for immunohistochemical staining and terminal deoxynucleotidyl transferase-mediated dUTP nick end labeling (TUNEL) staining and analyzed by two blinded-experts independently. The remaining 6 mice were reserved for the preparation of tumor homogenate to detect AGAP2-AS1 and MTA1 via reverse transcription quantitative polymerase chain reaction (RT-qPCR). The expression of AGAP2-AS1 and MTA1 in tumor homogenate was assessed by means of RT-qPCR.
Immunohistochemical Staining
Sections (4 μm) were employed for immunohistochemical staining. Briefly, the sections were dewaxed, rehydrated, rinsed using PBS, treated with 3% H2O2, supplemented with ethylene diamine tetraacetic acid buffer for antigen extraction, and cultured with the goat serum (Solarbio Science & Technology Co., Ltd, Beijing, China) for 30 min. Next, the sections were cultured with MTA1 (at a dilution ratio of 1:500, ab71153, Abcam) or Ki67 (1 µg/mL, ab15580, Abcam) at 4°C overnight and cultivated with the secondary antibody goat anti-rabbit IgG (at a dilution ratio of 1:2000, ab205718, Abcam) for 30 min, stained with 2,4-diaminobutyric acid (DAB, Thermo Fisher) and hematoxylin (Beyotime), dehydrated using ethyl alcohol and then observed under a microscope (CX23, Olympus Optical Co., Ltd, Tokyo, Japan) based on the double-blind method.
TUNEL Staining
TUNEL staining was conducted to analyze the degree of apoptosis. Briefly, the MCF-7 cells were fixed using 4% formaldehyde and stained in strict accordance with the provided instructions of the TUNEL kit (Abcam). TUNEL-positive cells were counted under a fluorescent microscope (DMI4000B, Leica, Solms, Germany) based on the double-blind method.
The paraffin-embedding sections were dewaxed, treated with proteinase K at 30°C for 20 min, incubated with the endogenous peroxidase blocking buffer for 5 min, then treated with TUNEL solution (Beyotime) at 37°C in conditions devoid of light for 60 min, developed with the DAB solution, stained with hematoxylin, and observed in the double-blind method. TUNEL-positive cells were identifiable in brown and normal cells were blue.
RT-qPCR
The RNA content was extracted from BC cells and tissues using the TRIzol reagent (Invitrogen), with the concentration and purity of RNA determined usingthe Nano-Drop ND-1000 a spectrophotometer. Glyceraldehyde-3-phosphate dehydrogenase (GAPDH) and U6 served as internal reference. RNA was reverse transcribed via the SuperScript III (Invitrogen). The obtained cDNA was quantified by RT-qPCR using the BioRad CFX96 sequence assay system (BioRad, Inc., Hercules, CA, USA). Normalization of gene expression was conducted via GAPDH expression. RT-qPCR results were calculated based on the 2−ΔΔCt method. The RT-qPCR primers were seen in Table 2.
Primer sequence of RT-qPCR.

Note: RT-qPCR, reverse transcription-quantitative polymerase chain reaction; LncRNA, long non-coding RNA; AGAP2-AS1, AGAP2 antisense RNA 1; ELAVL1, embryonic lethal vision-like protein 1; MTA1, metastasis-associated protein 1; GAPDH, glyceraldehyde-3-phosphate dehydrogenase; F, forward; R, reverse.
Western Blot Analysis
The protein content was extracted using the RIPA lysis buffer containing protease inhibitors (Roche, CA, USA), separated through 10% sodium dodecyl sulfate-polyacrylamide gel electrophoresis and then transferred onto polyvinylidene fluoride membranes, followed by membrane blockade using 5% skim milk for 1 h at 4°C and incubation with the following primary antibodies (all from Abcam): MTA1 (ab71153, at a dilution ratio of 1: 1000), HuR (ab200342, at a dilution ratio of 1: 1000) and β-actin (ab8227, at a dilution ratio of 1: 1000) at 4°C overnight. Next, after 3 rinses with tris-buffered saline-tween (Solarbio) to discard blots, the membranes were cultured with the horseradish peroxidase-labelled goat anti-rabbit IgG (at a dilution ratio of 1: 2000, ab6721, Abcam) for 2 h. The gray value was analyzed using the NIH Image J software (National Institutes of Health, Bethesda, MD, USA).
Bioinformatics Analysis
The expression patterns of AGAP2-AS1 and MTA1 in BC was predicted via the Starbase database (http://starbase.sysu.edu.cn/index.php) 21 and the MTA1 promoter region modification was analyzed using the UCSC database (http://genome.ucsc.edu/index.html). 22
Statistical analysis
SPSS 21.0 software (IBM Corp. Armonk, NY, USA) was adopted for data analysis while the GraphPad Prism 8.0 software (GraphPad Software Inc., San Diego, CA, USA) was used for graphing. All data were inspected with normality distribution and homogeneity test of variance. The t-test was employed for comparison analysis between two groups and one-way or two-way analysis of variance (ANOVA) was employed for comparison analysis of multiple groups, and Tukey's multiple comparisons test was employed for the post-test of data. The p value was estimated based on a two-tailed test and a value of p < 0.05 was indicative of a significant difference and a value of p < 0.01 was indicative of an extremely significant difference.
Results
AGAP2-AS1 is robustly expressed in BC tissues and cells
AGAP2-AS1 is activated in BC, 19 however the definitive role of AGAP2-AS1 in BC cell resistance to apoptosis remains elusive. To this end, the AGAP2-AS1 expression pattern in BC was predicted through the Starbase database, which revealed the overexpression of AGAP2-AS1 in BC (Figure 1A). The analysis on AGAP2-AS1 expression in 30 pairs of BC tissues and paracancerous tissues revealed a higher AGAP2-AS1 expression pattern in the BC tissues relative to the paracancerous tissues (p < 0.05, Figure 1B). Likewise, the BC cell lines presented with an elevated AGAP2-AS1 expression compared to the MCF-10A cells (p < 0.05, Figure 1C). Altogether, our results indicated that AGAP2-AS1 was prominently expressed in BC.

AGAP2-AS1 is highly expressed in BC tissues and cells. A, AGAP2-AS1 expression in BC was predicted through the Starbase database (http://starbase.sysu.edu.cn/index.php). B, AGAP2-AS1 expression pattern in 30 pairs of BC tissues and paracancerous tissues was detected by RT-qPCR. C, AGAP2-AS1 expression pattern in mammary epithelial cells and BC cells was detected by RT-qPCR. N = 30. Independent experiments were conducted 3 times independently. The results in panel C were presented as mean ± standard deviation. The paired t-test was appointed to evaluate the data in panel B, one-way ANOVA was used to analyze the data in panel C. Tukey's multiple comparisons test was applied for the post hoc test. * p < 0.05.
AGAP2-AS1 silencing reduces BC cell resistance to apoptosis
To determine the mechanism of AGAP2-AS1 in BC cell resistance to apoptosis, the MCF-7 cells with comparatively higher levels of AGAP2-AS1 were selected for the following experiments. Initially, we designed si-AGAP2-AS1#1, si-AGAP2-AS1#2, and si-AGAP2-AS1#3 and transfected them into the MCF-7 cells to downregulate AGAP2-AS1 (p < 0.05, Figure 2A), from which si-AGAP2-AS1#2 and si-AGAP2-AS1#3 (demonstrating good interfering efficiency) were selected for subsequent analysis, which revealed that the AGAP2-AS1 silencing led to reduced MCF-7 cell proliferation (p < 0.01, Figure 2B-C) and enhanced apoptosis (p < 0.05, Figure 2D-E), thereby suggesting that AGAP2-AS1 silencing weakened BC cell resistance to apoptosis.

AGAP2-AS1 silencing reduces BC cell resistance to apoptosis. si-AGAP2-AS1 was transfected into MCF-7 cells, with si-NC as the control. A, AGAP2-AS1 expression pattern in BC was determined through RT-qPCR. B and C, MCF-7 cell proliferation in each group was assessed by CCK-8 method (B) and colony formation assay (200×, crystal violet staining) (C). D and E, MCF-7 cell apoptosis in each group was measured by flow cytometry (Annexin V-FITC and PI staining) (D) and TUNEL staining (200×) (E). Independent experiments were conducted 3 times independently. The results were presented as mean ± standard deviation. One-way ANOVA was used to analyze the data in panels A, C, D and E, two-way ANOVA was used to analyze the data in panel B. Tukey's multiple comparisons test was applied for the post hoc test. * p < 0.05, ** p < 0.01.
AGAP2-AS1 interacts with HuR and stabilizes its own expression
An existing study demonstrated the interaction of AGAP2-AS1 with HuR to stabilize its own expression. 12 The binding relation between AGAP2-AS1 and HuR was verified by a combination of RNA pull-down assay and RIP assay, which further verified the ability of AGAP2-AS1 to bind to HuR (p < 0.01, Figure 3A-B). To validate the effects of HuR on AGAP2-AS1 stabilization, si-HuR-1 and si-HuR-2 were transfected into the MCF-7 cells to downregulate the HuR expression pattern (p < 0.01, Figure 3C-D). HuR knockout was associated with an inhibited expression pattern along with shortened half-life period of AGAP2-AS1 (p < 0.01, Figure 3E-F). The preceding findings elicited that AGAP2-AS1 could interact with HuR and further stabilize its own expression.

AGAP2-AS1 could interact with HuR and stabilize its own expression. The binding relation between AGAP2-AS1 and HuR was evaluated by RNA pull-down assay (A) and RIP assay (B). si-HuR-1 and si-HuR-2 were transfected into MCF-7 cells, with si-NC as the control. C and D, HuR expression was measured by RT-qPCR (C) and western blot analysis (D) (the samples derived from the same experiment, and gels and blots were cropped and processed in parallel). E and F, AGAP2-AS1 expression (E) and half-life period (F) were analyzed by RT-qPCR. Independent experiments were conducted 3 times independently. The results were presented as mean ± standard deviation. One-way ANOVA was used to analyze the data in panels B, C, D and E, two-way ANOVA was used to analyze the data in panel F. Tukey's multiple comparisons test was applied for the post hoc test. ** p < 0.01.
AGAP2-AS1-HuR complex accelerates H3K27ac upregulation in MTA1 promoter region to promote MTA1 expression
An existing study identified the ability of AGAP2-AS1-HuR complex to directly bind to the ATG10 promoter region, induce H3K27ac recruitment, and activate ATG10 transcription. 12 The MTA1 overexpression in vitro corroborated cancer cell resistance to heat-induced apoptosis. 23 Besides, MTA1 was overexpressed in BC.14,15 Collectively, we speculated that the AGAP2-AS1-HuR complex might potentially influence MTA1 promoter acetylation and its expression, thereby eliciting functionality in BC cell resistance to apoptosis. Initially, the Starbase database identified an elevated expression pattern of that MTA1 in BC (Figure 4A). AGAP2-AS1 silencing or HuR depletion resulted in a reduced MTA1 expression pattern in the MCF-7 cells (p < 0.01, Figure 4B-C). While the UCSC database identified the presence of a binding region between the MTA1 promoter region and H3K27ac (Figure 4D). To probe the mechanism of AGAP2-AS1-HuR complex in the processes of H3K27ac recruitment in the MTA1 promoter region and MTA1 upregulation, ChIP assay was performed. Expectedly, in the MCF-7 cells, H3K27ac recruitment was evident in the MTA1 promoter region (p < 0.01, Figure 4E), and HuR was also enriched in the MTA1 promoter region (p < 0.01, Figure 4F). In the MCF-7 cells, inhibition of AGAP2-AS1 or HuR terminated H3K27ac recruitment in the MTA1 promoter region (p < 0.01, Figure 4G). Altogether, our findings demonstrated that the AGAP2-AS1-HuR complex facilitated H3K27ac acetylation in the MTA1 promoter region to promote MTA1 expression.

AGAP2-AS1-HuR complex accelerates H3K27ac acetylation in MTA1 promoter region to promote MTA1 expression pattern. A, MTA1 expression pattern in BC was predicted via the Starbase database. B and C (the samples derived from the same experiment, and gels and blots were cropped and processed in parallel), MTA1 expression in MCF-7 cells was determined by RT-qPCR (B) and western blot analysis (C). D, MTA1 promoter region modification was analyzed through the UCSC database (http://genome.ucsc.edu/index.html). E and F, H3K27ac recruitment (E) and HuR recruitment (F) in MTA1 promoter of MCF-7 cells was evaluated by ChIP. G, H3K27ac recruitment in MTA1 promoter of MCF-7 cells upon the silencing of AGAP2-AS1 or HuR was detected by ChIP. Independent experiments were conducted 3 times independently. The results were presented as mean ± standard deviation. The t-test was appointed to evaluate the data in panels E and F and one-way ANOVA was used to analyze the data in panels B, C and G. Tukey's multiple comparisons test was applied for the post hoc test. ** p < 0.01.
H3K27 upregulation enhances MTA1 expression to promote BC cell resistance to apoptosis after AGAP2-AS1 silencing
In order to determine the role of acetylation modification on the MTA1 expression in AGAP2-AS1 regulation of BC cell resistance to apoptosis, an array of combination experiments were designed. Firstly, the MCF-7 cells in the si-AGAP2-AS1#2 group were treated with M344. As demonstrated by the results of ChIP, M344 treatment facilitated H3K27ac recruitment in the MTA1 promoter region (p < 0.01, Figure 5A) and upregulated the MTA1 expression pattern (p < 0.05, Figure 5B-C). Upon elevation of the H3K27ac level, the si-AGAP2-AS1#2 group showed intensified MCF-7 cell proliferation (p < 0.05, Figure 5D) and enhanced cell resistance to apoptosis (p < 0.05, Figure 5E-F). The preceding results indicated that H3K27 upregulation enhanced the MTA1 expression pattern to promote BC cell resistance to apoptosis after AGAP2-AS1 silencing.

H3K27 upregulation enhances MTA1 expression pattern to promote BC cell resistance to apoptosis after AGAP2-AS1 silencing. MCF-7 cells in the si-AGAP2-AS1#2 were treated with M344, with DMSO treatment as the control. A, H3K27ac recruitment in MTA1 promoter of MCF-7 cells was detected by ChIP. B and C (the samples derived from the same experiment, and gels and blots were cropped and processed in parallel), MTA1 expression pattern in MCF-7 cells was determined by RT-qPCR (B) and western blot analysis (C). D, cell proliferation was evaluated via CCK-8 method. E and F, MCF-7 cell apoptosis was measured by flow cytometry (Annexin V-FITC and PI staining) (E) and TUNEL staining (200×) (F). Independent experiments were conducted 3 times independently. The results were presented as mean ± standard deviation. One-way ANOVA was used to analyze the data in panels A, B, C, E and F, two-way ANOVA was used to analyze the data in panel D. Tukey's multiple comparisons test was applied for the post hoc test. * p < 0.05, ** p < 0.01.
AGAP2-AS1 silencing diminishes BC cell resistance to apoptosis in vivo by downregulating MTA1 expression
Additionally, the effects of AGAP2-AS1-MTA1 on BC cell resistance to apoptosis were verified through in vivo experimentation. MCF-7 cells with a stably low expression pattern of AGAP2-AS1 were injected into the nude mice to establish the xenografts tumor model (Figure 6A). Our results denoted that AGAP2-AS1 silencing resulted in reduced tumor volume and weight (p < 0.01, Figure 6B-C), downregulated positive rate of Ki67 (p < 0.01, Figure 6D), and an enhanced TUNEL-positive rate (p < 0.01, Figure 6E). Meanwhile, compared with the LV-si-NC group, the LV-si-AGAP2-AS1 group showed lowered AGAP2-AS1 and MTA1 expression patterns in the tumor tissues (p < 0.01, Figure 6F-H). Altogether, AGAP2-AS1 silencing alleviated BC cell resistance to apoptosis in vivo by downregulating the MTA1 expression pattern.

AGAP2-AS1 silencing alleviated BC cell resistance to apoptosis in vivo by downregulating MTA1 expression pattern. MCF-7 cells with stably low expression pattern of AGAP2-AS1 were injected into nude mice to establish the xenografts tumor model, with LV-sh-NC as the control. A, the representative image of tumors. B, growth volume of tumors. C, tumor weight of nude mice. D, Ki67 positive rate was detected by immunohistochemical staining (200×, DAB and hematoxylin staining). E, TUNEL-positive rate was analyzed by TUNEL staining (200×, DAB and hematoxylin staining). F, G and H, expression pattern of AGAP2-AS1 and MTA1 was assessed by RT-qPCR (F and G) and immunohistochemical staining (200×, DAB and hematoxylin staining) (H). N = 6. Independent experiments were conducted 3 times independently. The results in panels B, C, D, E and H were presented as mean ± standard deviation. Two-way ANOVA was appointed to evaluate the data in panel B and the t-test was appointed to evaluate the data in panels C, D, E, F, G and H. Tukey's multiple comparisons test was applied for the post hoc test. ** p < 0.01.
Discussion
BC is classified as a heterogenous carcinoma responsible for the tumor-induced mortality among females with mounting chance of occurrence and fatality. 24 Resistance against apoptosis is regarded as the primary cause for aggregated BC cell viability, accumulation, dissemination, and poor prognostic results, thus highlighting its vital functionality in BC progression. 25 In BC with overexpression of AGAP2-AS1, the cancer cell propagation is amplified while the apoptosis is weakened with impaired clinical effects. 19 In the current study, we speculated critical effects of AGAP2-AS1 on BC cell resistance to apoptosis.
Our previous study implicated the vital functionality of MLF1IP-related apoptosis resistance in MLF1IP-mediated secondary resistance of breast cancer cells 26 Besides, our existing studies have cited the participation of various lncRNAs in BC cell proliferation, migration and epithelial-mesenchymal transition via the ceRNA mechanism.27–29 Hence, we speculated the participation of lncRNAs in BC cell resistance to apoptosis. Accumulating evidence has demonstrated a prominent expression of AGAP2-AS1 in various cancers where its silencing terminated cell mobility, communication, and invasiveness.30,31 In our study, the Starbase database predicted that AGAP2-AS1 was strongly expressed in BC, which was supported by the meticulous analysis of the AGAP2-AS1 expression in BC. Expectedly, AGAP2-AS1 has previously functioned as an uncertain manifestation for BC as it induced cell resistance to drug therapy and contributed to a worsening clinical prognosis. 32 Functionally, apoptosis is an essential biological process that could mediate cell growth and advance, eliminate the redundant or detrimental cells and sustain microenvironmental homeostasis in multicellularity. 33 The elimination of apoptosis along with a few cancer cells, will initiate activation of cancers, and in a worsening state can facilitate the occurrence of cell malignant transition, anticancer medicine resistance, and neoplasm metastasis. 34 To investigate the effects of AGAP2-AS1 in BC cell resistance to apoptosis, si-AGAP2-AS1 was transfected into the BC cells to downregulate AGAP2-AS1, which revealed that AGAP2-AS1 silencing led to restricted MCF-7 cell proliferation and improved apoptosis. Likewise, in the microenvironment of glioblastoma multiforme, knockdown of AGAP2-AS1 was significant in neutralising malignant cell proliferation and mobility and enforcing apoptosis. 35 Additionally, the in vivo experiments were performed as the MCF-7 cells with stably downregulated AGAP2-AS1 were injected into the nude mice to establish the xenografts tumor model, and AGAP2-AS1 silencing resulted in reduced tumor volume and weight, downregulated positive rate of Ki67, and improved TUNEL positive rate. In terms of its clinical impact on BC, AGAP2-AS1 could serve as a terminal predictive biomarker and therapeutic target for BC patients, and increased AGAP2-AS1 is responsible for poor outcome of chemotherapy.11,12,19,32 Collectively, our findings denoted that AGAP2-AS1 silencing may neutralise BC cell resistance to apoptosis.
The mechanisms of lncRNAs in cancer regulation include the involvement of RNA-protein-protein complex. 36 As a type of regulatory factor in RNA post-transcription, HuR is mediated and bound by different proteins and influences BC growth and alleviation, 37 where the binding relation between AGAP2-AS1 and HuR was verified experimentally. To verify the impact of HuR on AGAP2-AS1 stabilization, si-HuR was transfected into the MCF-7 cells to downregulate the HuR expression, which was essentially associated with the weakened expression and shortened half-life period of AGAP2-AS1. An existing study demonstrated the positive association between AGAP2-AS1 and HuR, and the formation of the AGAP2-AS1-HuR complex supported the stability and enhanced the AGAP2-AS1 expression. 11 The aforementioned data demonstrated the interaction of AGAP2-AS1 with HuR to stabilize its own expression.
Histone acetylation serves as the foundation for epigenetic modification and boasts therapeutic implications in BC treatment. 38 Moreover, the incorporation of H3K27ac in BC drug-resistant cells was evident of an unsatisfactory prognostic consequence. 39 AGAP2-AS1 could facilitate H3K27ac recruitment to reduce apoptosis for worsening overall survival outcomes of BC patients. 19 Additionally, previous research has determined that the inhibition of H3K27ac recruitment in the MTA1 promoter region was positively associated with the amelioration of triple-negative BC. 40 In accordance, our experimental results elicited that AGAP2-AS1-HuR complex facilitated H3K27ac enrichment in the MTA1 promoter region to promote the MTA1 expression. Barker and his colleagues have validated the ability of HuR to bind to MTA1 and facilitate MTA1 stability and upregulation. 41 A pioneering report has indicated that the repression of histone acetylation regulates the homeostasis of BC and has approval for terminal application in BC treatment. 38 MTA1 is implicated in several cancers via modifications of gene acetylation enrichment. 42 In order to determine the role of acetylation modification on MTA1 expression in AGAP2-AS1 regulation of BC cell resistance to apoptosis, a combination experiment was designed for treatment of MCF-7 cells with si-AGAP2-AS1 treatment with M344, which revealed intensification of H3K27ac recruitment in MTA1 promoter region with the up-regulation of MTA1 expression, amplification of BC cell proliferation and increased cell resistance to apoptosis. Consistently, H3K27ac abundance has been evident in the MTA1-related promoter region. 43 Additionally, MTA1 carried in BC exosomes could be extensively transferred into local or distant organs, so as to augment the molecular microenvironment and further exacerbate BC expansion and malignancy. 44 These results indicated that H3K27 up-regulation radically increased the MTA1 expression to intensify BC cell resistance to apoptosis after AGAP2-AS1 silencing. Accumulating evidence has highlighted the functionality of ceRNA mechanism in BC.45–47 Our study distinguished itself from these works with the identification of a novel mechanism wherein lncRNA AGAP2-AS1 independently binds to HuR to stabilize its own expression and form the AGAP2-AS1-HuR complex to enhance H3K27ac in the MTA1 promoter region to improve the MTA1 expression in the breast cancer cells.
Conclusions
To conclude, our findings verified that AGAP2-AS1 can bind to HuR to stabilize its own expression, and the formation of AGAP2-AS1-HuR complex amplified the H3K27ac level in the MTA1 promoter region to improve MTA1 promoter activity and MTA1 expression in BC cells, so as to intensify BC cell resistance to apoptosis (Figure 7). These results provided a theoretical implication for BC alleviation. However, this research was unable to perform any power calculation for estimation of the sample size or analyze the effect of AGAP2-AS1 on other cell death modes, such as ferroptosis or pyroptosis. Besides, whether AGAP2-AS1 could function in a ceRNA mechanism, the potential path that accounts for AGAP2-AS1 upregulation and the clinical effects of AGAP2-AS1 in BC remains elusive. Our future studies will focus on determining the other potential functions or mechanisms of AGAP2-AS1 to provide novel theoretical insights into BC treatment.

Mechanism of AGAP2-AS1 in regulating BC cell resistance to apoptosis. AGAP2-AS1 binds to HuR to stabilize its own expression, and the formation of AGAP2-AS1-HuR complex enhances H3K27ac level in MTA1 promoter region to improve MTA1 promoter activity and MTA1 expression in BC cells, so as to strengthen BC cell resistance to apoptosis.
Footnotes
Declaration of Competing Interest
The authors have no conflicts of interest to declare that are relevant to the content of this article.
Funding
This work was supported by funding from the General project of Zhejiang Health Department (2018KY729). General project of Zhejiang Health Department (2018KY724). The Institute of Individualized Endocrine Therapy for Luminal Breast Cancer, Ningbo Science and Technology Bureau major social development project (2015C0003). The research institute on the application of machine learning-based prediction model in individualized and accurate diagnosis and treatment of breast tumors and the establishment of a large clinical database, Ningbo Science and Technology Bureau (2019B10039).
Ethics Statement
Our study was approved by The Ethics Committee of Ningbo medical center Lihuili Hospital (cpyll20170037). The protocol was also supported by the Institutional Animal Care and Use Committee of Ningbo medical center Lihuili Hospital (No. IACUC-20170037) and approved by the Guidelines for the Care and Use of Laboratory Animals provisions of administration and usage of laboratory animals by National Institutes of Health. 16 Each step was rigorously performed according to Declaration of Helsinki. All patients provided written informed consent prior to enrollment in the study.