
Abstract
Background:
There are limited methods to predict the therapeutic effect of immune checkpoint inhibitors (ICIs). The purpose of this study was to explore the value of circulating microparticles (MPs) in predicting thetherapeutic effects of immunotherapy.
Methods:
A prospective study was conducted at the cancer center of PLA general hospital, including all patients with advanced non-small cell lung cancer (NSCLC) who were treated with pembrolizumab or nivolumab from December 2018 to December 2019. The patients were divided into an immune-related objective response (iOR) group and an immune-related disease progression (iPD) group.The numbers of total MPs, platelet-derived microparticles (PMPs) and T-lymphocyte-derived microparticles (T-LyMPs) at baseline and after immunotherapy were detected using a flow cytometer. Univariate analysis and multivariate logistic regression analysis were used to determine the independent influencing factors.
Results:
We identified 32 patients in the iOR group and 18 patients in the iPD group. No significant difference were found intotal MPs, PMPs and T-LyMPs at the baseline between the 2 groups. While total MPs, PMPs and T-LyMPs in the iPD group were significantly higher than those in the iOR group after immunotherapy(P < 0.05). In the multivariate logistic regression analysis, PMPs ≥80 events/µL after immunotherapy(OR, 7.270; 95% CI, 1.092-48.404, P = 0.04) were associated with disease progression in advanced NSCLC and could independently predict the therapeutic effect of immunotherapy.
Conclusions:
PMPs after immunotherapy independently predicted the therapeutic effects of ICIs, making it possible to monitor the therapeutic effect in real time and rapidly adjust treatment regimens. In addition, this study found for the first time that elevated circulating T-LyMPs were associated with disease progression in advanced NSCLC.
Introduction
Non-small cell lung cancer (NSCLC) accounts for approximately 85% of all primary lung cancers; most patients are at an advanced stage at initial diagnosis, and the 5-year survival rate is less than 15%. 1,2 In recent years, breakthroughs have been made in targeted therapies based on specific driver genes 3,4 ; however, new treatments are still urgently needed for patients who are negative for driver gene expression. Immune checkpoint inhibitors (ICIs) can block the programmed cell death 1 (PD-1)/programmed cell death 1 ligand (PD-L1) axis, restore the immune response of T lymphocytes to tumor cells, and offer new hope for cancer treatment. 5 Among ICIs, 2 inhibitors of PD-1, pembrolizumab and nivolumab, have been approved as first-line and second-line treatments, respectively, for advanced NSCLC. PD-L1 expression and tumor mutational burden (TMB) can predict the therapeutic effect of ICIs 6,7 ; however, it is not easy to obtain tissue specimens by biopsies repeatedly, and in advanced NSCLC, progression persists after multiple immunotherapies. Traditional imaging can evaluate disease progression, but it also has limitations, such as pseudoprogression, radiation toxicity and cost. Therefore, it is necessary to find new biological markers that can reflect the therapeutic effect of ICIs more quickly and easily in real time.
Extracellular vesicles can be divided into exosomes, microparticles, and apoptotic bodies according to size and range. Exosomes are assumed to represent a homogeneous population with a size between 30 and 120 nm in diameter, apoptotic bodies are exclusively released during the last steps of apoptosis with a size ranging from 800 to 5000 nm in diameter 8 Microparticles (MPs), also called microvesicles, are submicron vesicles with a diameter of 100-1000 nm formed by the budding and shedding of the cell membrane during cell activation or apoptosis and have a high expression of phosphatidylserine (PS) on their surface 8 MPs carry proteins, lipids and nucleic acids [DNA, messenger RNA (mRNA), microRNA (miRNA)] from the mother cell, can transmit informational substances by means of receptor-ligand binding or fusion, and stimulate tumor proliferation, angiogenesis, immune tolerance, invasion and metastasis. 9 -13 Kanazawa et al. 14 found that the total MPs in the circulating blood of lung cancer patients were significantly higher than those in healthy controls, and further studies showed that the total MPs in the circulating blood of patients with stage IV NSCLC were significantly higher than those of patients with stage III NSCLC. 15 Platelet-derived MPs (PMPs) comprise the greatest number of MPs in circulating blood 16 and are closely associated with the high invasiveness, metastasis and prognosis of cancer. 17,18
Currently, there is no study on the correlation between MPs and the therapeutic effect of immunotherapy. The purpose of this study was to explore the correlations of MPs, PMPs, and T-lymphocyte-derived microparticles (T-LyMPs) with the progression of advanced NSCLC treated with immunotherapy and to analyze the value of total MPs, PMPs, and T-LyMPs for predicting the therapeutic effect of immunotherapy.
Materials and Methods
Patients
Patients with advanced NSCLC treated with pembrolizumab or nivolumab, with or without chemotherapy between December 2018 and December 2019 at our hospital were included. Inclusion criteria were advanced NSCLC and age >18 years. Exclusion criteria were as follows: patients with advanced NSCLC with EGFR sensitizing mutations, ALK/ROS1 rearrangements; other malignant tumors; severe organ dysfunction, such as chronic renal insufficiency (stage III and above), liver cirrhosis, and bone marrow dysfunction; acute infection; autoimmune diseases; and current radiotherapy.
Blood Sampling
After treatment with pembrolizumab (200 mg once every 3 weeks) or nivolumab (240 mg once every 2 weeks) ± chemotherapy for at least 18 weeks, the routine blood tests, lactate dehydrogenase (LDH), and tumor markers of the patients were routinely examined before the next treatment cycle. At baseline and after immunotherapy a total of 3 mL of venous blood was collected from the elbow of each patient into a tube with sodium citrate as an anticoagulant (3.2%, 0.109 M). To avoid the impact of blood vessel punctures on MPs, the blood samples taken for MP testing were collected in the end. The MPs were extracted by differential centrifugation at 4°C. Three milliliters of whole blood was first centrifuged at 2000 g for 10 min, and 1000 µL of supernatant was taken to obtain platelet-poor plasma (PPP). Then, the blood sample was centrifuged at 13000 g for 3 min, 400 µL of supernatant was taken to obtain platelet-free plasma (PFP), and the PFP was stored in at -80°C.
Analysis of MPs
The PFP containing MPs was dissolved at room temperature; then, 400 µL of PFP was centrifuged at 21000 g at 4°C for 60 min, and the bottom 100 µL was collected as MPs. The number of MPs was detected using a FACS CantoTMII flow cytometer (BD Bioscience, San Jose, CA, USA). Annexin V was used to identify the PS expressed on the surface of the MPs. Annexin V+ MPs is the total number of MPs; the cluster of differentiation CD41+/Annexin V+ represents PMPs, and CD3+/AnnexinV+ represents T-LyMPs. The monoclonal antibodies (BioLegend, San Diego, CA, USA) used for immunofluorescence were phycoerythrin (PE)-labeled Annexin V, fluorescein (FITC)-labeled CD41, and PerCP-cy5.5-labeled CD3. Next, 1 µL of Annexin V-PE and 100 µL of Annexin V binding buffer were added to 25 µL of MPs and incubated at room temperature in the dark for 20 min. Then, 1 µL of CD41-FITC and 1 µL of CD3-PerCP-cy 5.5 were added, followed by incubation at room temperature in the dark for 20 min. The sample was pipetted and washed with 500 µL of phosphate-buffered saline (PBS), and PBS was then added in the sample to reach a volume of 400 μL. The sample was transferred to BD absolute counting tubes (BD Bioscience, San Jose, CA, USA) and then evaluated. Standard microspheres with a size of 1 µm or 2 µm (Invitrogen, Carlsbad, CA, USA) were used as a molecular gate to determine the position of 0.1 -1.0-µm MPs (Figure 1). To avoid the impact of noise caused by dust and crystallization, the buffer solution and PBS were filtered through a 0.22-µm filter. The counting unit of MPs was events/μL.

The setting of gates in the flow cytometer is shown in Figure 1. The P1 gate and the M gate in Figure 1-A represent the positions of particles with diameters of 2 µm and 1 µm, respectively, and P2 is the position of particles with diameters of 0.1-1 µm, that is, the position of the MPs. Figure 1-B shows the flow diagram of MPs; most MPs are in the P2 gate.
Therapeutic Evaluation
Before and after immunotherapy, chest and abdominal computed tomography (CT) and head magnetic resonance imaging (MRI) were performed to determine the stage of cancer and evaluate the therapeutic effect. The evaluation was performed according to the 2017 Immune-related Response Evaluation Criteria in Solid Tumors (iRECIST), 19 and the patients were divided into an immune-related objective response (iOR) group and an immune-related disease progression (iPD) group. The iOR group included patients with immune-related complete remission (iCR), immune-related partial remission (iPR) or immune-related stable disease (iSD). iPD was defined as a change in the longest diameter of the tumor on CT examination ≥20% or the occurrence of new metastatic lesions.
Statistical Analysis
Quantitative data with a normal distribution are expressed as x ± s, and the t test was used. Non-normal data are expressed as the median and quartile, and the Mann-Whitney U test was used. Count data are expressed as frequencies, and the χ2 test was used. Univariate analysis and multivariate logistic regression analysis (Forward: enter) were used to determine the independent influencing factors. A P value less than 0.05 was considered significant.
Results
Basic Clinical Characteristics of 50 Patients With Advanced NSCLC
A total of 50 patients were included in the study. Thirty-five (70.0%) patients were male. The average age was 65 years [54.5, 69.0], and 27 (54.0%) patients had a smoking history. A total of 20 (40.0%) patients had stage IIIB NSCLC, and 30 (60.0%) patients had stage IV NSCLC, while 23 (46.0%) patients had adenocarcinoma, and 27 (54.0%) patients had squamous cell carcinoma. Twenty-six (52.0%) patients had ≥2 extrapulmonary metastases, 5 (10.0%) patients had PD-L1 expression ≥50%, 22 (44.0%) patients had PD-L1 expression ≥1%, and 23 (46.0%) patients had PD-L1 expression less than 1%. Immunotherapy combined with chemotherapy and immunotherapy alone accounted for 76.0% and 24.0% of patients, respectively; of these, 35 (70.0%) patients chose pembrolizumab, 15 (30.0%) patients chose nivolumab, and 45 (90%) patients received second-line or above treatments.
Comparison of Basic Clinical Characteristics Between the iOR and the iPD Groups
The patients were classified according to the therapeutic effect; there were 32 patients in the iOR group and 18 patients in the iPD group. There were no significant differences in sex, age, underlying diseases, smoking history, tumor type, stage, metastatic site, Karnofsky performance scale (KPS) score, PD-L1 expression, number of treatment lines and treatment regimen between the 2 groups (P < 0.05, Table 1).
Clinical Characteristics and Laboratory Data After Immunotherapy in iOR Group and iPD Group.

CHD, coronary heart disease; COPD, chronic obstructive pulmonary disease; KPS, Karnofsky performance scale; PD-L1, programmed cell death-ligand 1; NLR, neutrophil-lymphocyte ratio; CEA, carcino-embryonic antigen; SCC: squamous cell carcinoma antigen; CYFRA-211, cytokeratin 19 fragment; LDH, lactate dehydrogenase.
*Chi-square test.
§T test.
#Mann-Whitney U test.
Comparison of Laboratory Indicators, Total MPs, PMPs and T-LyMPs Between the iOR and iPD Groups
Among the laboratory indicators, carcinoembryonic antigen (CEA) [4.67 (2.04,35.16) ng/ml vs. 2.78 (1.82,12.84) ng/ml, P = 0.039], cytokeratin-19 fragment (CYFRA-211) [6.23 (2.88,17.99) ng/ml vs. 3.14 (2.14,5.00) ng/ml, P = 0.009], and LDH [188.5 (168.5,240.3) U/L vs. 163.7 (139, 207.2) U/L, P = 0.022] were significantly higher in the iPD group than in the iOR group; neutrophil/lymphocyte ratio (NLR) showed no significant difference between the iPD and the iOR groups [3.40 (1.71, 9.70) vs. 2.26 (1.37, 3.19), P = 0.090]; and white blood cell (WBC) count, neutrophil count, and platelet count showed no significant differences between the 2 groups (P > 0.05)(Table 1).
No significant difference were found in total MPs, PMPs and T-LyMPs at the baseline between the 2 groups (P > 0.05). The total MPs in the iPD group were significantly higher than those in the iOR group after immunotherapy[3590.0 (1492.0, 4995.0) events/µL vs. 1763.0 (1207.0, 3180.0) events/μL, P = 0.026]. PMPs after immunotherapy were significantly higher in the iPD group than those in the iOR group [201.5 (90.5, 298.5) events/µL vs. 52.0 (22.5, 108.5) events/μL, P < 0.0001]. T-LyMPs after immunotherapy were significantly higher in the iPD group than those in the iOR group [184.5 (118.25, 340.25) events/µL vs. 121.5 (61.75, 219.50) events/μL, P = 0.048] (Table 2, Figures 2–3).

Flow chart of the expression levels of total MPs, PMPs and T-LyMPs in the iOR and iPD groups. Figure 2–A and 2–B shows total MPs in iOR group and iPD group; Figure 2–C and 2–D shows PMPs in iOR group and iPD group; Figure 2–E and 2–F shows T-LyMPs in iOR group and iPD group.
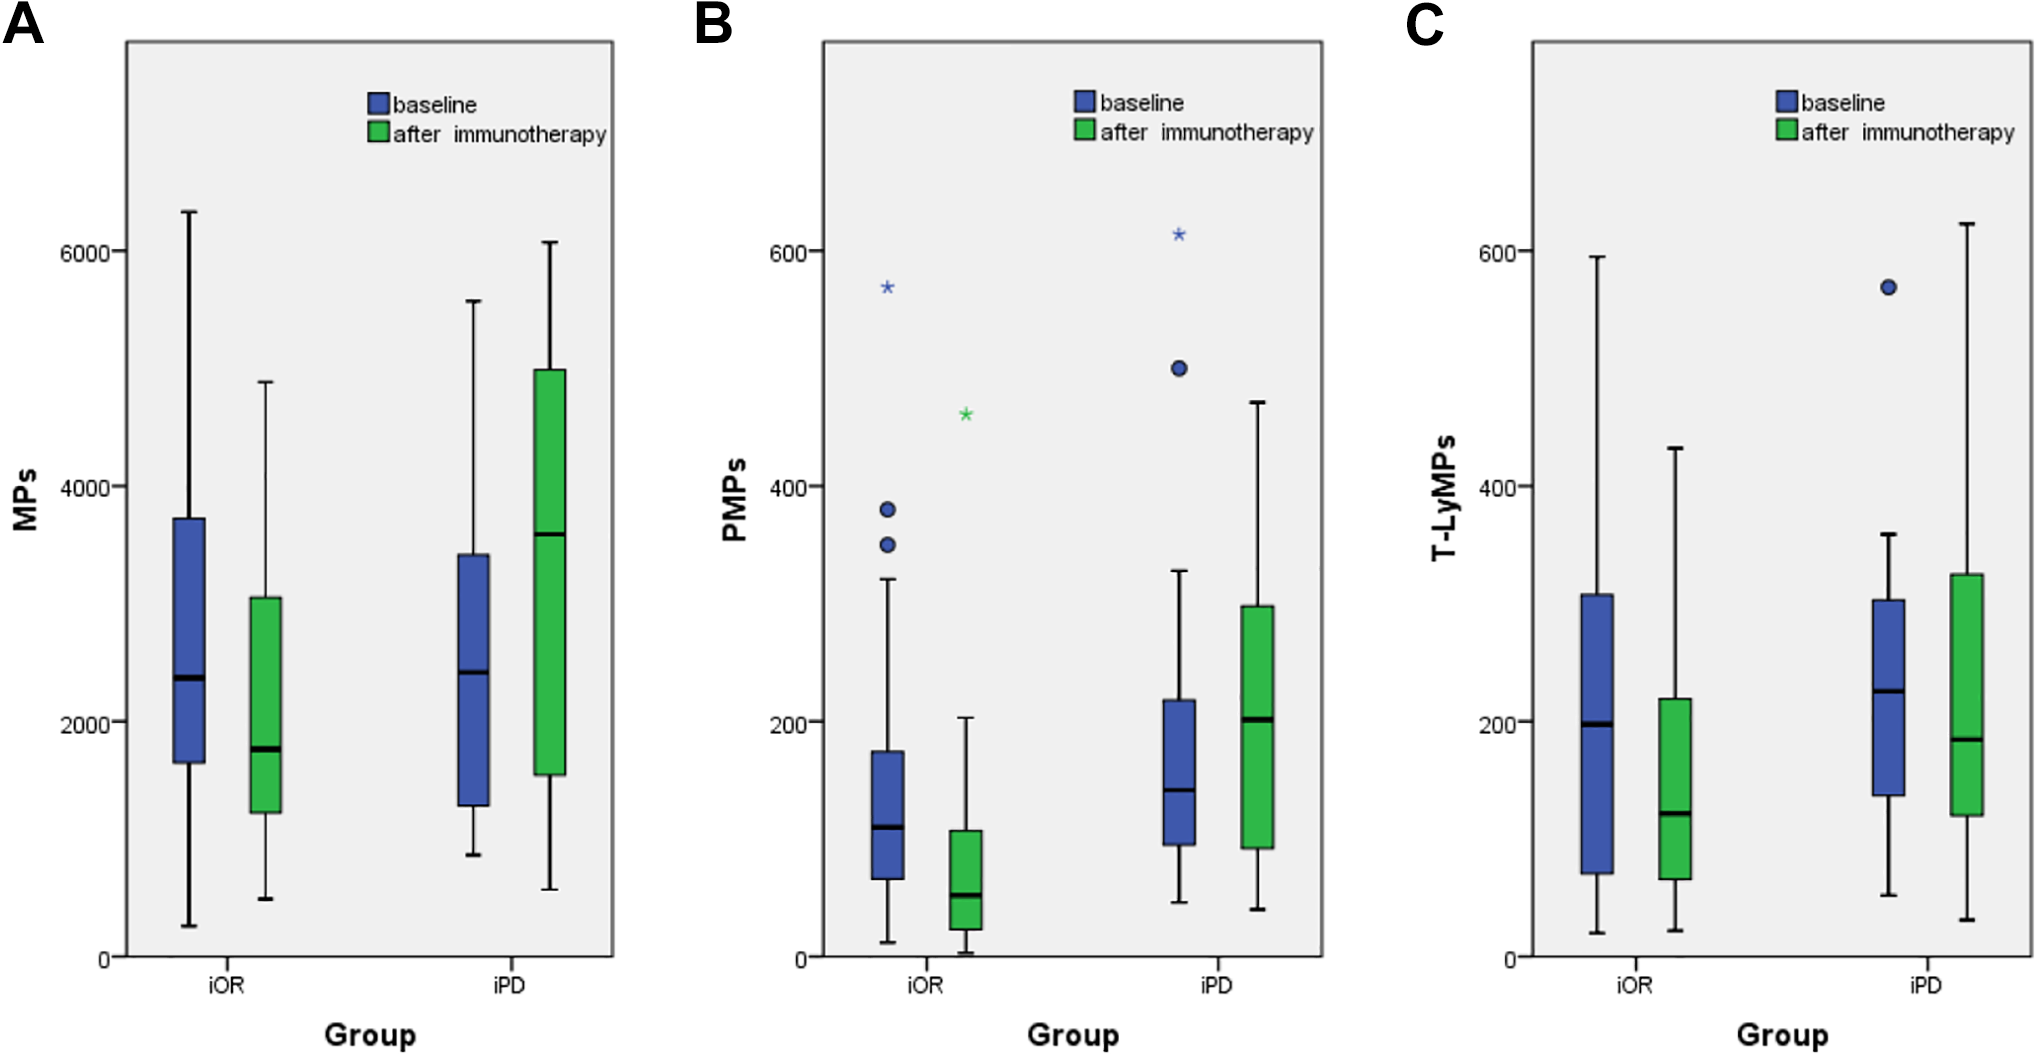
Box plots for MPs at basline and after immunotherapy in the iOR and iPD groups. Top and bottom of box represent 75th and 25th percentile, respectively; middle bar in box represents the median value; Top and bottom lines extending from box represent maximum and minimum obtained values, respectively. ° represent mild outliers.* represent extreme outliers. No significant difference were found intotal MPs, PMPs and T-LyMPs at the baseline between the 2 groups (P > 0.05). Figure 3-A shows that fewer total MPs were in the iOR group than those in the iPD group (P = 0.026). Figure 3-B shows that there were significantly fewer PMPs in the iOR group than in the iPD group after immunotherapy (P < 0.0001). Figure 3-C shows that there were significantly fewer T-LyMPs in the iOR group than in the iPD group after immunotherapy (P = 0.048).
Micropaticles at Baseline and After Immunotherapy in iOR Group and iPD Group.

MPs, micropaticles; PMPs, Platelet-derived micropaticles; T-LyMPs, T-lymphocyte-derived micropaticles.
#Mann-Whitney U test.
Univariate Analysis and Multivariate Regression Analysis of Disease Progression
In the univariate analysis, total MPs ≥ 3000 events/µL [odds ratio (OR), 4.714; 95% confidence interval (CI), 1.364-16.295; P = 0.014], PMPs ≥ 80 events/µL (OR, 15.273; 95% CI, 2.96-78.814, P = 0.001), T-LyMPs ≥ 150 events/µL (OR, 5.667; 95% CI, 1.369-23.462; P = 0.017), NLR ≥ 3.3 (OR, 4.464; 95% CI, 1.277-15.608; P = 0.019) and CEA ≥ 5.0 ng/ml (OR, 4.964; 95% CI, 1.403-17.557; P = 0.013) were associated with disease progression (Table 3). In the multivariate logistic regression analysis, PMPs ≥ 80 events/μL(OR, 7.270; 95% CI, 1.092-48.404, P = 0.04) were associated with disease progression in advanced NSCLC and could independently predict the therapeutic effect of immunotherapy (Table 3).
Univariate and Multivariate Analyses of Factors Related With iPD in Advanced NSCLC.

MPs, microparticles; PMPs, platelet-derived microparticles; T-LyMPs, T-lymphocyte-derived microparticles; NLR, neutrophil-lymphocyte ratio; CEA, carcino-embryonic antigen; CYFRA21 -1, cytokeratin 19 fragment; LDH, lactate dehydrogenase.
Comparison of the Predictive Values of Various Factors on the Therapeutic Effect of Immunotherapy by Receiver Operating Characteristic (ROC) Curve
The ROC curve showed that, when PMPs were used to predict the therapeutic effect of immunotherapy, the area under the curve (AUC) was 0.836 (95% CI, 0.724-0.948, P < 0.0001), the sensitivity was 88.9%, the specificity was 71.9%, the positive predictive value was 64.0%, and the negative predictive value was 92.0% (Table 4, Figure 4).
Comparison of the Predictive Values of Various Factors on the Therapeutic Effect of Immunotherapy.
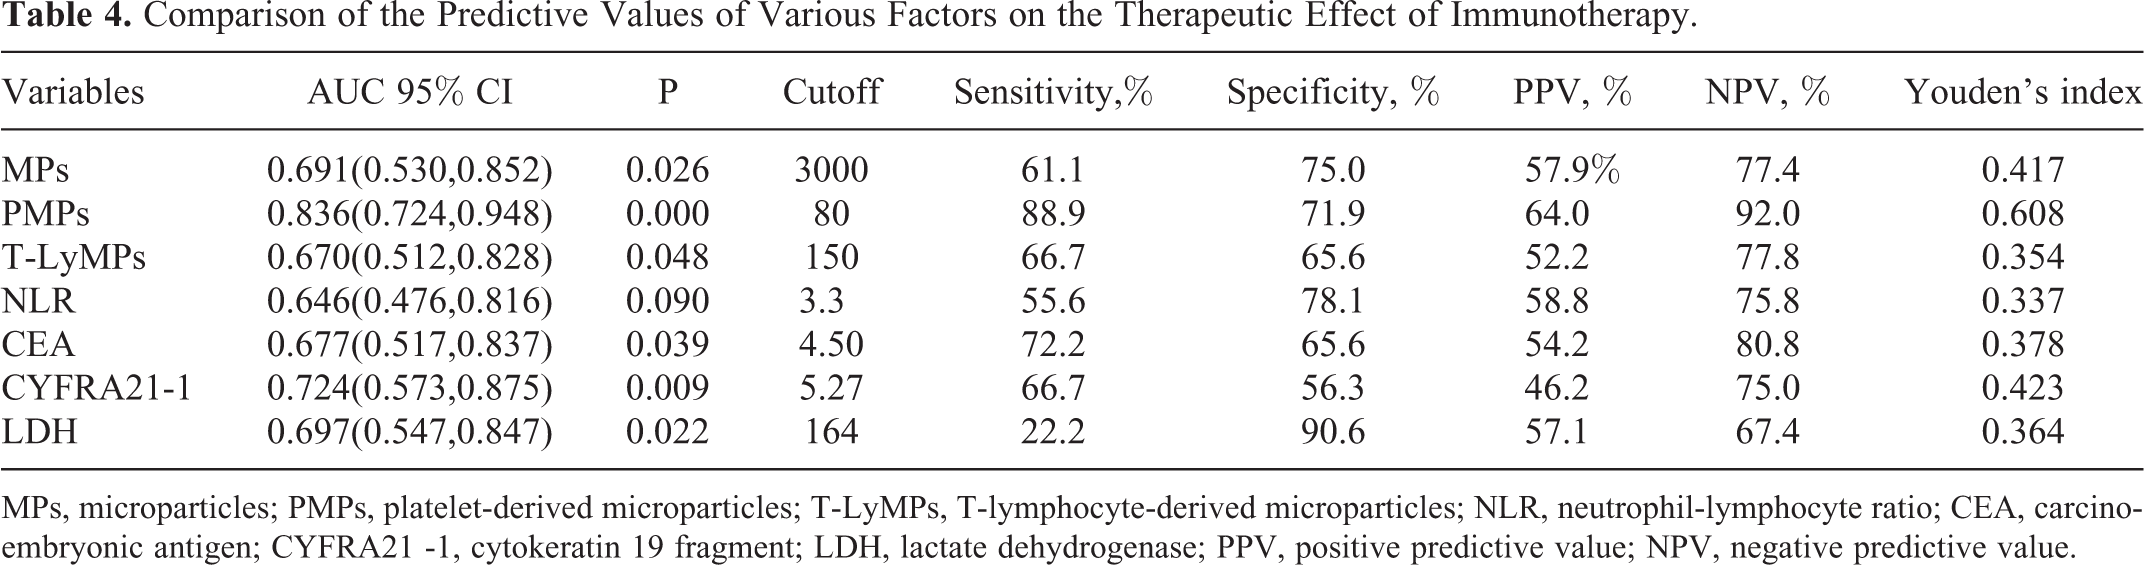
MPs, microparticles; PMPs, platelet-derived microparticles; T-LyMPs, T-lymphocyte-derived microparticles; NLR, neutrophil-lymphocyte ratio; CEA, carcino-embryonic antigen; CYFRA21 -1, cytokeratin 19 fragment; LDH, lactate dehydrogenase; PPV, positive predictive value; NPV, negative predictive value.
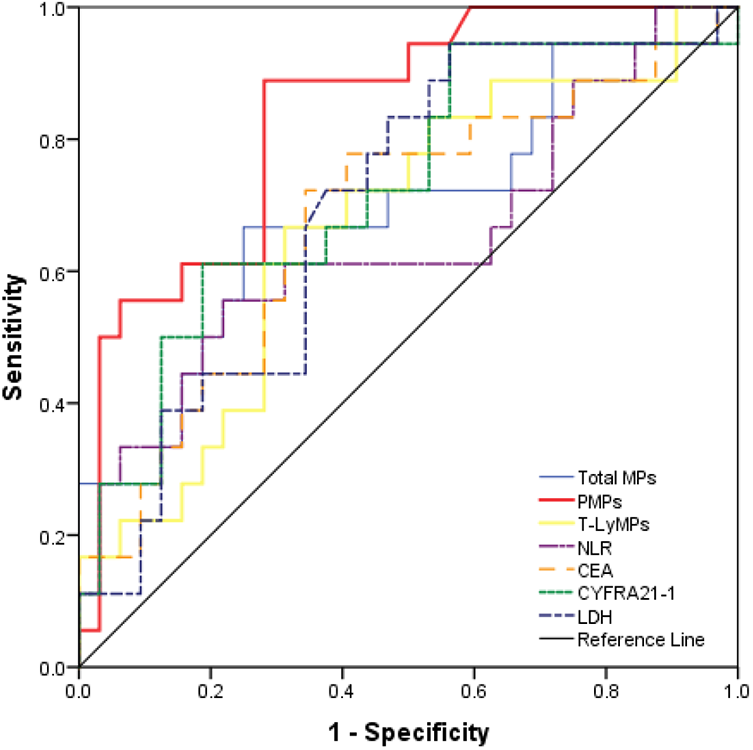
Comparison of the predictive values of various factors on the therapeutic effect of immunotherapy by receiver operating characteristic (ROC) curve. PMPs after immunotherapy were superior to other factors in evaluating disease progression. The area under the curve (AUC) was 0.836 (95% CI, 0.724-0.948, P < 0.0001), the sensitivity was 88.9%, the specificity was 71.9%, the positive predictive value was 64.0%, and the negative predictive value was 92.0%.
Discussion
Regardless of the treatment used for advanced lung cancer, disease progression related to drug resistance and tumor metastasis can inevitably occur. 20 This study found that the total MPs and PMPs in the circulating blood were significantly increased during disease progression in advanced NSCLC patients receiving immunotherapy, and PMPs independently predicted the therapeutic effect of immunotherapy. In addition, this study found for the first time that elevated T-LyMPs in the circulating blood were associated with disease progression in advanced NSCLC.
It has been reported that total MPs in the circulating blood are associated with the occurrence, development and prognosis of cancer. Fleitas et al. 21 found that compared with healthy people, NSCLC patients had significantly increased total MPs in the circulating blood, which had a certain prognostic value. Najjar et al. 15 found that total MPs in the circulating blood were associated with an advanced NSCLC stage. The total MPs in patients with stage IV NSCLC before chemotherapy were significantly higher than those in patients with stage III NSCLC, and the rate of change in total MPs after chemotherapy could predict disease progression. In this study, the total MPs in the circulating blood of advanced NSCLC patients were significantly increased, suggesting that MPs may promote cancer progression.
Platelets have a clear role in promoting cancer proliferation and metastasis. 22 -24 PMPs contain miRNAs and mRNAs that are very similar to those of platelets, 25 can transmit platelet information to target cells, 26 and play a role in promoting cancer progression. This study found that PMPs were significantly elevated in advanced NSCLC patients during disease progression, suggesting that PMPs were associated with cancer progression, which was consistent with previous reports. Helley et al. 27 found that a high level of PMPs was associated with high invasiveness, metastasis, and poor prognosis in prostate cancer patients. Kim et al. 28 also found that the level of PMPs in patients with stage IV gastric cancer was significantly increased and could predict the presence of distant metastasis. The promotion of cancer progression by PMPs may be related to their promotion of the levels of adhesion molecules and angiogenic factor expression and their regulation of the release of cytokines, such as interleukin (IL)-17 and interferon (IFN)-g. 29 -31 In addition, PMPs can transmit genetic materials, such as miRNA Let-7a and miR-223, to target cells, thereby promoting cancer angiogenesis and cancer cell proliferation. 32,33
Although in vitro studies have found that T-LyMPs produced by single-factor stimulation can inhibit cancer cell proliferation, 34 this study found for the first time an interesting phenomenon: the level of T-LyMPs in the iPD group was significantly higher than that in the iOR group. This finding suggests that in the complex tumor microenvironment in vivo, T-LyMPs may play a role in promoting cancer progression, although the underlying mechanism has not yet been clarified.
The patients included in this study were all treated with pembrolizumab or nivolumab, and blood samples were collected after 18 weeks of immunotherapy. At that time, patients were more prone to disease progression. In the early stage of immunotherapy, due to the temporary infiltration of immune cells, the tumor burden is increased for a short period of time, which appears as pseudoprogression on traditional imaging. 35 Although NLR, CEA, CYFRA21 -1 and LDH can reflect disease progression to a certain extent, their specificity and sensitivity are not high. The detection of PD-L1 and TMB in tissue specimens can predict the treatment effect, but tissue specimens cannot be easily obtained by biopsies repeatedly. In this study, when disease progression occurred in advanced NSCLC treated with ICIs, the total MPs, PMPs and T-LyMPs were significantly increased. Moreover, in the multivariate regression analysis, PMPs could independently predict the therapeutic effect of immunotherapy. PMPs in circulating blood ≥80 events/µL may suggest disease progression and the need to adjust the treatment regimen.
This study has some shortcomings. First, this was a single-center study with a small sample size; second, we did not further investigate the relationship between other factors in tumor microenvironment (such as CXCL4, Tregs, infiltrating lymphocytes, MDSCs) and microparticles expression.
Conclusion
In the course of immunotherapy for patients with advanced NSCLC, total MPs, PMPs, and T-LyMPs in the circulating blood were associated with disease progression, and PMPs could independently predict the therapeutic effect of ICIs, making it possible to monitor the therapeutic effect in real time and adjust treatment regimens as soon as possible. These findings lay a foundation for the future exploration of the mechanism by which MPs promote cancer progression.
Footnotes
Acknowledgements
The authors are grateful to all participants, laboratory staff, and professionals involved in the study for their valuable contributions. We thank American Journal Experts (AJE) for editing the English text of a draft of this manuscript.
Author Contribution
Tingting Liu and Jiang Wang contributed equally to this work.
Ethics Approval and Consent to Participate
All participants in this study signed informed consent forms. The ethics committee of the People’s Liberation Army General Hospital approved this study according to the ethical standards of the Declaration of Helsinki and its subsequent amendments (Ethical approval number: S2018-092-01).
Declaration of Conflicting Interests
The author(s) declared no potential conflicts of interest with respect to the research, authorship, and/or publication of this article.
Funding
The author(s) received no financial support for the research, authorship, and/or publication of this article.