
Abstract
Purpose
To evaluate the impact of patient setup errors on the dosimetry and radiobiological models of intensity-modulated radiotherapy (IMRT) for esophageal cancer.
Methods and materials
This retrospective study with 56 patients in thermoplastic mask (TM) and vacuum bag (VB) groups utilized real setup-error (RSE) data from cone-beam CT scans to generate simulated setup-error (SSE) data following a normal distribution. The SSE data were applied to simulate all treatment fractions per patient by shifting the plan isocenter and recalculating the dose. A simulated plan sum (SPS) was created by accumulating all simulated fraction plans. Comparisons of target dose, improved homogeneity index (iHI), conformity index (CI), tumor control probability (TCP) and normal tissue complication probability (NTCP) were conducted between SPSs and original treatment plans (OTPs). Correlations between RSE and TCP/NTCP were analyzed.
Results
Compared to OTPs in the TM group, the planning target volume (PTV) of SPSs showed reductions in D95%, D98%, iHI, CI and TCP by 1.2%, 2.2%, 2.3%, 7.3% and 1.2%, while D2% increased by 0.3%; D2% of clinical target volume (CTV) increased by 0.2% (P < .05). In the VB group, D95%, D98%, iHI, CI and TCP of PTV decreased by 2.5%, 4.5%, 4.2%, 15.6% and 2.0%, with D2% increasing by 0.5%; D2% of CTV increased by 0.5% while D98% decreased by 0.2% (P < .05). The dose of organs at risk (OARs) changed slightly in both groups. The mean and standard deviation of absolute RSE negatively correlated with the TCP of PTV, while the mean RSE positively correlated with the NTCP of lung and spinal cord.
Conclusions
Setup errors may reduce dose homogeneity and conformity, potentially reducing TCP of PTV and increasing NTCP, especially when mean RSE shifts the isocenter towards OARs. VB immobilization may result in relatively larger impacts of setup errors, but this needs future validation.
Keywords
Introduction
Esophageal cancer is the seventh most common cancer and the sixth-leading cause of cancer death worldwide. 1 Treatment approaches for esophageal cancer encompass surgery, chemotherapy and radiotherapy. 2 Intensity-modulated radiation therapy (IMRT) stands out as an advanced technique offering improved target coverage, dose homogeneity, conformity, and reduced toxicity to normal tissues compared to traditional 3D-conformal radiation therapy (3D-CRT). 3 IMRT achieves this through its ability to generate steep dose gradients between the target volume and surrounding normal tissue.4,5 However, due to the heightened level of target conformity and steep dose gradients, accurate patient setup is crucial. Significant errors during setup may lead to inadequate radiation dose to the tumor or excessive dose to critical organs, potentially resulting in uncontrolled tumor growth or severe organ complications.
Image-guided radiotherapy (IGRT) can achieve online correction of setup errors by obtaining images before or during treatment, thereby reducing the above differences.6,7 Although IGRT plays an important role in the implementation of treatment plans, in many regions of China, due to the lack of linear accelerator mounted on-board imager (OBI) and professionals (radiotherapy physicians, physicists and technicians), image correction of setup errors is not performed for each patient in each treatment. In addition, studies8–10 have reported that frequent use of cone-beam computed tomography (CBCT) scans can increase the risk of secondary cancer by increasing the additional dose to patients. The lack of setup-error data for all treatment fractions makes it challenging to assess the impact of setup errors on dosimetry and radiobiology. Therefore, this study proposes a new method to simulate the setup errors to solve this problem.
Moreover, radiobiological models, including tumor control probability (TCP) and normal tissue complication probability (NTCP) models, are commonly employed to evaluate the radiobiological effects of radiation therapy.11–15 Previous studies have investigated the impact of patient setup errors on radiotherapy outcomes using radiobiological models.16–18 These studies demonstrate the value of TCP and NTCP models as useful tools for quantifying the biological consequences of setup errors by translating dosimetric effect into biological responses using mathematical formulas. These models provide insights into how setup errors impact tumor control and normal tissue toxicity. Several well-established radiobiological models are frequently used in this context. The equivalent uniform dose (EUD)-based TCP/NTCP model developed by Niemierko 19 is popular due to its straightforward formula and effectiveness. Additionally, the Webb-Nahum TCP model (WN model) and the Lyman-Kutcher-Burman (LKB) model are widely employed. The WN model combines the linear quadratic (LQ) model for cell survival with Poisson statistics, assuming a normal distribution of tumor radiosensitivity. The LKB model is particularly favored for estimating the risk of complications in normal tissues after radiation therapy and has been clinically validated for predicting radiation-induced complications. 20 Additionally, the second cancer complication probability (SCCP) model is often utilized for assessing long-term clinical outcomes, such as in Zhang's study 17 where it was employed to evaluate the long-term risk of developing contralateral breast cancer. Although these radiobiological models were widely applied in the investigation of impact of setup errors, there has been limited attention specifically devoted to the radiobiological implications of setup errors in esophageal cancer radiotherapy.
This study utilized CBCT scans to acquire setup error data, which were then incorporated into simulated treatment plans to investigate their effects on dosimetry and radiobiology, and to analyze the correlation between setup errors and TCP/NTCP. The objective is to provide reference for clinical optimization of treatment.
Methods and Materials
Patients’ General Data
This retrospective cohort study encompassed 56 patients diagnosed with middle and upper esophageal cancer undergoing radical radiotherapy. The patients were diagnosed with squamous cell carcinoma through pathological biopsy and had a Karnofsky Performance Status (KPS) score of 70 points or higher, indicating the ability to cooperate with treatment actively. All patient details were de-identified. Based on the immobilization device employed, patients were divided into two groups: the thermoplastic mask (TM) group and the vacuum bag (VB) group. The general information of patients was summarized in Table 1. The differences in clinical stage, tumor location, gender distribution and planning target volume (PTV) with or without supraclavicular lymph node metastasis (LNM) between the two groups were tested using the chi-square test (with continuity correction for clinical stage comparison) while the age, body mass index (BMI), loss of weight during radiotherapy, KPS score and PTV volume were tested using t-test. Consequently, no significant differences were observed and the two groups were deemed comparable for the purposes of this study. The reporting of this study conforms to STROBE guidelines. 21
General Information of the Patients.
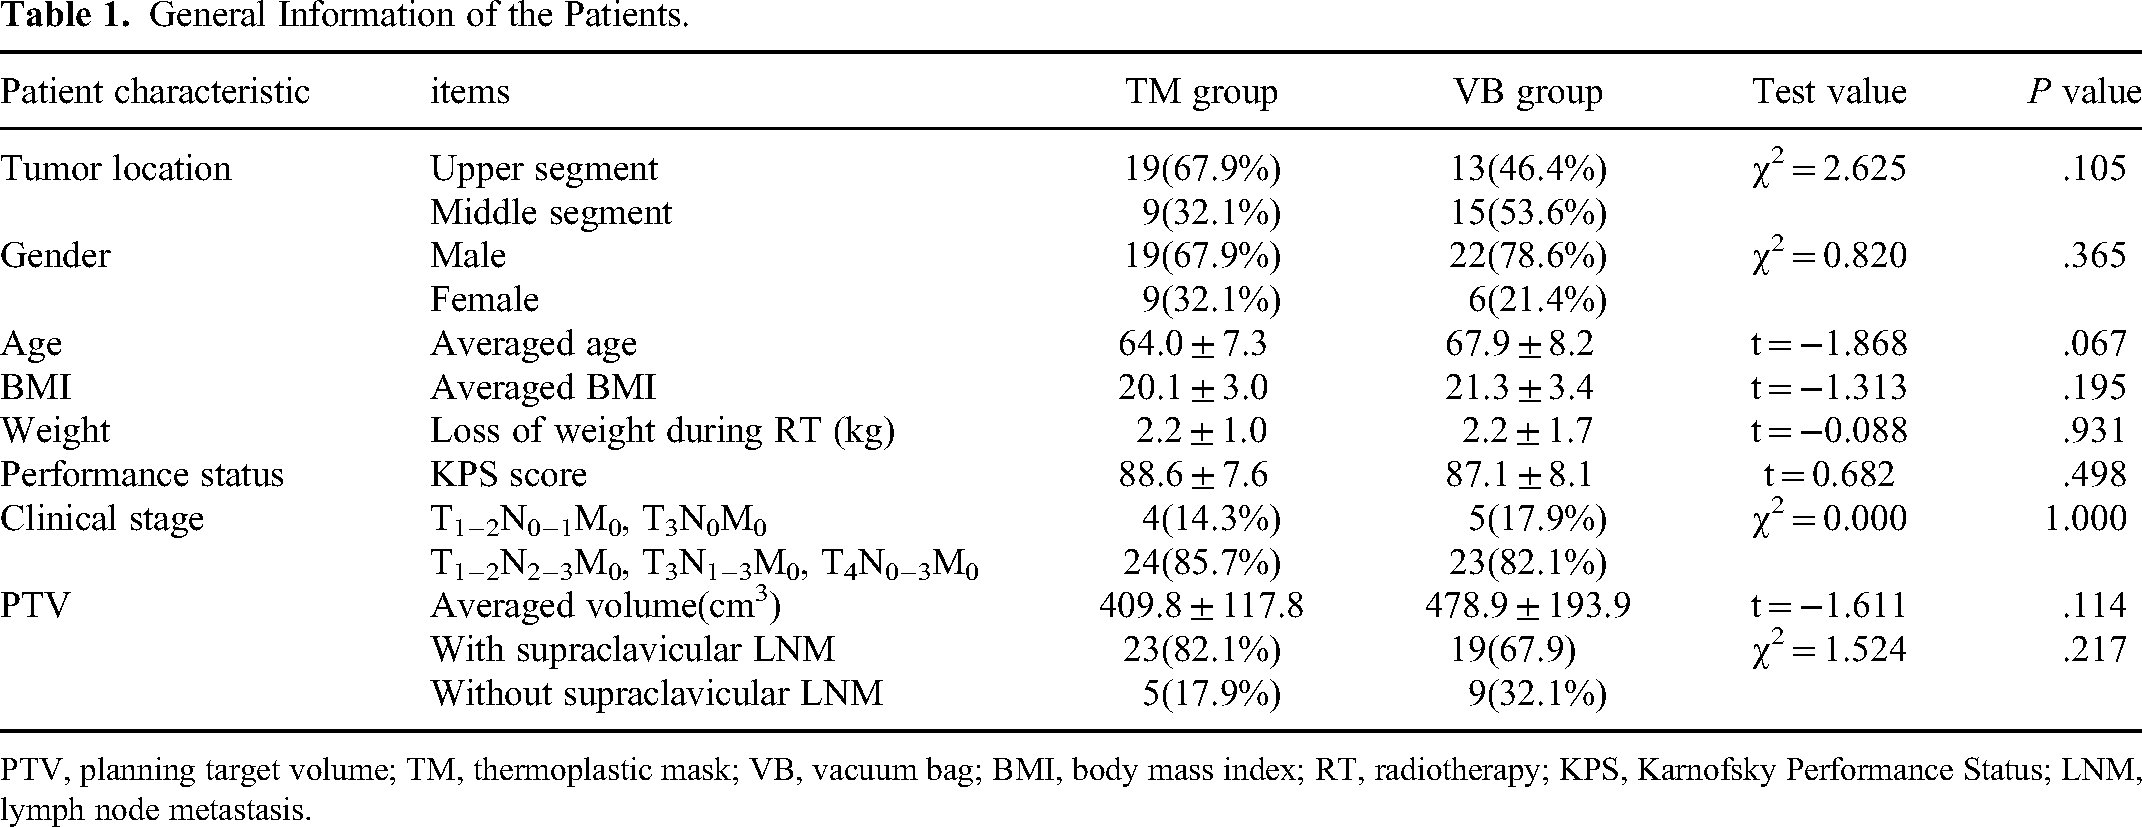
PTV, planning target volume; TM, thermoplastic mask; VB, vacuum bag; BMI, body mass index; RT, radiotherapy; KPS, Karnofsky Performance Status; LNM, lymph node metastasis.
Body Position Fixation and Original Treatment Planning
Patients in the TM group were positioned in a supine posture, and immobilized utilizing head-neck-shoulder thermoplastic masks (Guangzhou Klarity Medical and Equipment Co, Ltd, China). Patients in the VB group were positioned in a supine position with immobilizing vacuum bags (Medtec Medical, Inc, Buffalo Grove, IL, USA). A spiral CT scanner (Philips Brilliance Big Bore Oncology Configuration, Cleveland, OH) was utilized to perform scans for the patients and the acquired images were then imported into the Eclipse v15.5 treatment planning system. The target volume was delineated by the radiotherapy physicians. The gross target volume (GTV) included the primary esophageal tumor (GTVprimary) and suspicious para-esophageal lymph nodes (GTVln). The clinical target volume (CTV) included areas that might be clinically invaded by tumor cells, including 2.0-4.0 cm longitudinal extension of GTVprimary, 0.5-1.0 cm lateral extension of GTVprimary, 0.5-1.0 cm uniform extension of GTVln, mediastinal lymph drainage area and bilateral supraclavicular lymph drainage area. Each plan incorporated margins of 0.5 cm for the PTV in the left-right (LR), cranio-caudal (CC) and anterior-posterior (AP) directions based on the CTV. The treatment plans were designed using five fields, with gantry angles set at 210°, 300°, 0°, 60°, and 150°, based on a TrueBeam linear accelerator (Varian Medical Systems, Palo, Alto, CA, USA). A prescribed dose of 50 Gy (administered in 2 Gy/fraction over 25 fractions), was specified. These plans underwent optimization to generate clinically acceptable plans, referred to as the original treatment plans (OTPs). Normalization of the OTPs was performed to ensure 95% of the PTV volume covered by the prescribed dose.
KV-CBCT Scanning and Setup-Error Recording
Prior to the first radiotherapy session, all patients underwent KV-CBCT validation using the OBI of the TrueBeam, subsequently, weekly CBCT scan was performed, and thus, five to six scans were performed per patient throughout the treatment course. The CBCT scans were operated by two different groups of radiotherapy technicians. The scanning parameters were 120 kV voltage and 80 mA current. According to the image gray scale, automatic registration was used firstly and manual registration was used to achieve a substantial overlap between the target volumes in the CBCT images and the planning CT images. Displacement between these image sets in the LR, CC and AP directions was measured. A total of 289 sets of CBCT images were acquired, and real setup error (RSE) data in the LR, CC and AP directions were recorded.
Generation of Simulated Plan
By the central limit theorem, the sum of multiple distributions of any shape will approach a Gaussian distribution. According to the views of van Herk et al, 22 setup errors are caused by several smaller errors and therefore are likely to approach a normal distribution. In this study, the mean and standard deviation (SD) of the RSE were calculated for each patient. Randomly simulated setup error (SSE) data, following a normal distribution with the mean and SD of the RSE, were generated for 25 fractions per patient. Finally, the reliability of the SSE data needed to be verified. The specific generation process of SSE data is shown in Figure 1. In Eclipse, duplicates of the OTPs were created, and the SSE for each of the 25 fractions was incorporated into these duplicates by adjusting the isocenter position in three spatial directions and subsequently recalculating the dose distribution. This process resulted in 25 simulated plans, with the gantry angle, collimator angle, monitor unit (MU), and other conditions kept unchanged. Finally, the 25 simulated plans were accumulated to generate a simulated plan sum (SPS).
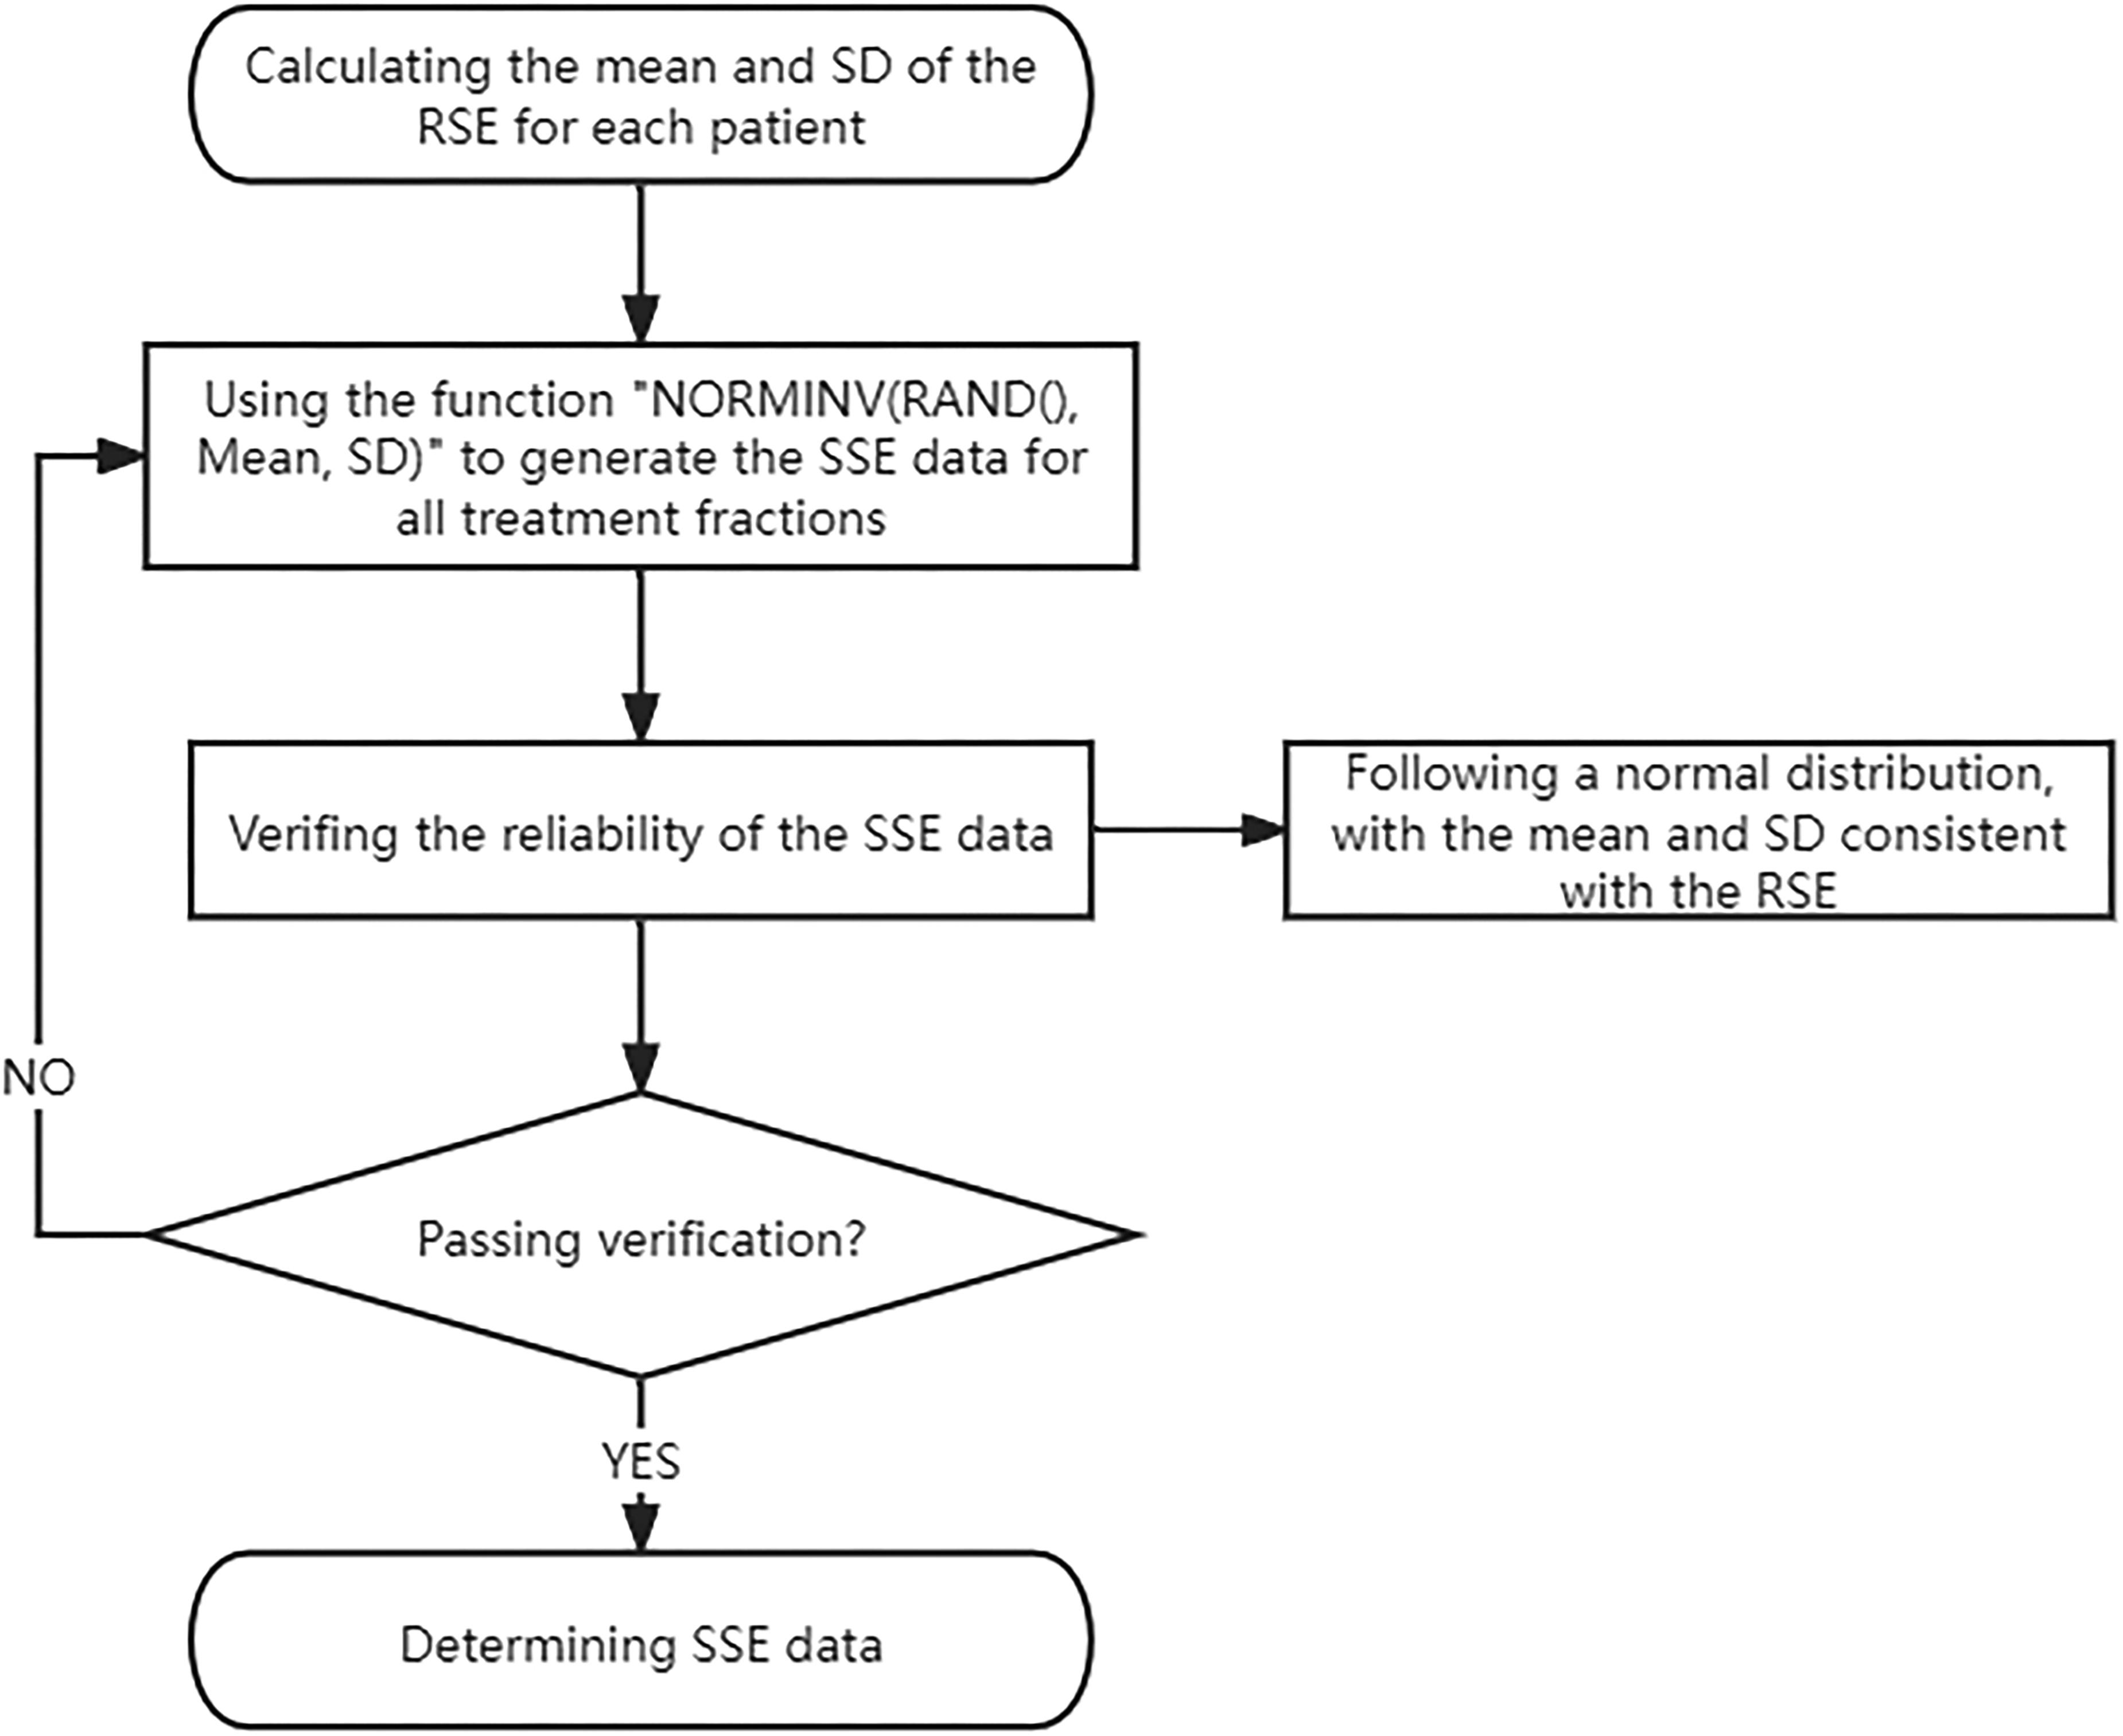
Flow chart of simulated setup error (SSE) data generation.
Evaluation of Treatment Plan
Dose volume histogram (DVH) was employed to assess the dose delivered to the target volume and organs at risk (OARs) in each plan. To better quantify the variation between OTPs and SPSs, we refined the homogeneity index (HI) recommended by ICRU report 83. 23 The novel HI was denoted as the improved homogeneity index (iHI). We transformed the HI values ranging from positive infinity to 0 into a normal scale from 0 to 1 using the following formula: iHI = 1/(HI + 1). This transformation allows for easy quantification of differences in the comparison between treatment plans. The following parameters were used to evaluate the PTV and CTV: D2%, D50%, D95%, D98%, iHI and conformity index (CI). iHI was calculated using the formula D50% / (D2% − D98% + D50%), while CI was calculated using the formula (TVRI / TV) × (TVRI / VRI). 24 Here, D2%, D50% and D98% represent the dose received by 2% (approximately maximum dose), 50% (median dose) and 98% (approximately minimum dose) of the target volume, respectively. TVRI is the volume of the target covered by the reference isodose line. TV represents the target volume. VRI represents the volume covered by the reference isodose line.
Dmean represents the average dose, and Dmax represents the maximum dose. VxGy represents the percentage volume receiving a dose ≥ x Gy, and Dx% represents the dose received by x% volume. The evaluation indices of OARs were as follows: Dmean, V5Gy, V10Gy, V20Gy, V30Gy for lung tissue; Dmax, D2% for spinal cord and spinal cord-planning organ at risk volume (SC-PRV); Dmean, V30Gy for heart; and V5Gy, V10Gy, V20Gy, V30Gy for normal tissue (NT, defined as the body volume minus the PTV).
The TCP was calculated using the WN model,25,26 where the parameter values used were ρ = 107 cm−1, α0 = 0.4 Gy−1 and σα = 0.08 Gy−1. 27
The LKB model, 28 which comprises three equations, was utilized to calculate the NTCP. For the lung, the parameter values used were n = 1, m = 0.45, TD50 = 31.4 Gy, 29 while for the spinal cord, the parameter values used were n = 0.05, m = 0.175, TD50 = 66.5 Gy, 30 and for the heart, the parameter values used were n = 0.64, m = 0.13, TD50 = 50.6 Gy. 31
Statistical Analysis
Statistical analyses were performed utilizing Statistical Package for the Social Sciences (SPSS), version 19.0 (SPSS Inc., Chicago, IL, USA). In this study, the dosimetric and radiobiological parameters of the target volumes and OARs were compared between the OTPs and SPSs, and the data were presented as mean ± SD or median (quartile range). Prior to comparison, Shapiro–Wilk test was employed to test the data for normality. If the data obeyed normal distribution, paired-sample t-test was used. If the data were not normally distributed, the Wilcoxon rank-sum test was chosen. Furthermore, Mann-Whitney U test was utilized to compare the setup errors in the LR, CC and AP directions between the TM and VB groups. Pearson correlation analysis or Spearman correlation analysis was used to analyze the correlation between the RSE and the variation of TCP or NTCP. Statistical difference was considered significant when two-sided P-value was less than .05.
Results
Setup Errors
CBCT scans were performed on 28 patients in the TM group and 28 patients in the VB group prior to their treatment, yielding 145 and 144 sets of RSE data, respectively. In the TM group, the mean absolute RSE values (Mean ± SD) in the LR, CC, and AP directions were 2.1 ± 1.9 mm, 2.0 ± 1.5 mm and 1.1 ± 0.9 mm, respectively, while in the VB group, the corresponding values were 1.7 ± 1.5 mm, 3.1 ± 2.6 mm and 2.6 ± 2.0 mm. Statistical analysis revealed that the setup errors in the CC and AP directions were significantly more pronounced in the VB group compared to the TM group (P < .05). Table 2 provides a comparison of the setup errors, presenting the mean absolute RSE values in the LR, CC, and AP directions for both the TM and VB groups.
Comparison of the Setup Errors Between the TM and VB Groups.

LR, the left-right direction; CC, the cranio-caudal direction; AP, the anterior-posterior direction; TM, thermoplastic mask; VB, vacuum bag.
Based on the RSE data, a total of 700 sets of SSE data were generated for the TM and VB groups, respectively. Figures 2 and 3 present the statistical histograms that illustrate the distribution of RSE and SSE in the LR, CC and AP directions for 28 patients in each group, respectively. These histograms reveal a pattern of normal distribution for both RSE and SSE data, and the distributions were similar across the groups. Upon comparative analysis, the mean value, SD, systematic error (treatment preparation variations, was calculated from the SD of all average setup errors for each patient) and random error (treatment execution variations, was calculated from the root mean square of all SD values for each patient) of the RSE and SSE data were either equal or extremely close (with differences not exceeding 0.2 mm). Furthermore, t-test confirmed that there was no statistically significant difference between the mean values of RSE and SSE (P > .05), indicating a strong consistency between these two datasets. In essence, the SSE data closely mirrors the RSE data, validating their compatibility and reliability. Table 3 provides a comprehensive comparison between the RSE and SSE data.

Histograms of the real setup errors (RSE) and simulated setup errors (SSE) in the left-right (LR), cranio-caudal (CC) and anterior-posterior (AP) directions for 28 patients in the thermoplastic mask (TM) group.
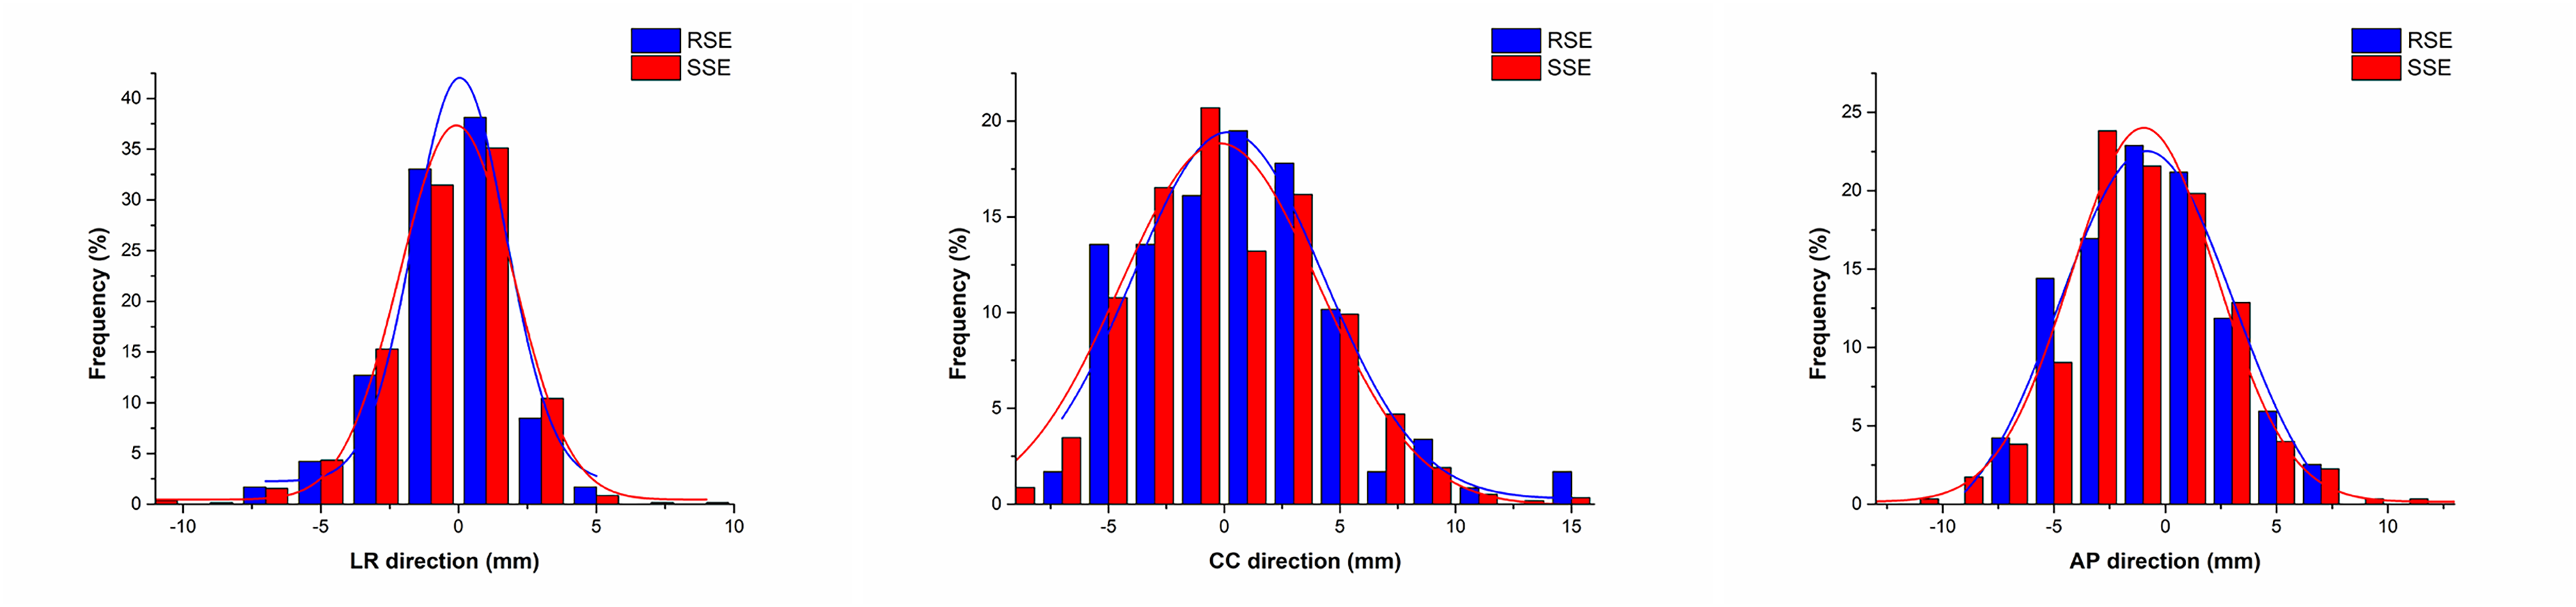
Histograms of the real setup errors (RSE) and simulated setup errors (SSE) in the left-right (LR), cranio-caudal (CC) and anterior-posterior (AP) directions for 28 patients in the vacuum bag (VB) group.
Comparison Between the RSE and SSE Data.

TM, thermoplastic mask; VB, vacuum bag; M, the mean; SD, the standard deviation; ∑, the systematic error; σ, the random error; LR, the left-right direction; CC, the cranio-caudal direction; AP, the anterior-posterior direction; t value, the result of t-test comparison between RSE mean and SSE mean, P > .05, there was no statistical difference between RSE mean and SSE mean.
Dosimetric Effect of Setup Errors on Target Volume
As shown in Table 4, notable differences are observed between the OTPs and SPSs for the PTV in the TM and VB groups. Specifically, in the TM group, the SPSs exhibited a reduction of 1.2% and 2.2% in the D95% and D98%, respectively, as compared to the OTPs, while the D2% increased by 0.3% (P < .05). Furthermore, the iHI and CI of the SPSs exhibited inferior by 2.3% and 7.1%, respectively (P < .05). In the VB group, the D95% and D98% of the SPSs decreased by 2.5% and 4.5%, the iHI and CI decreased by 4.2% and 15.6%, respectively, while the D2% increased slightly by 0.5% (P < .05). Regarding the CTV, the D2% of the SPSs in the TM group increased by 0.2% compared to the OTPs (P < .05), while the D2% of the SPSs in the VB group increased by 0.5%, and the D98% decreased slightly by 0.2% (P < .05). Figures 4 and 5 provide visual comparisons of the DVHs for PTV and CTV, respectively, for a representative case considering the OTP and SPS in the TM and VB groups, respectively. Figure 6 provides the isodose profiles of the OTP and SPS for the representative case.
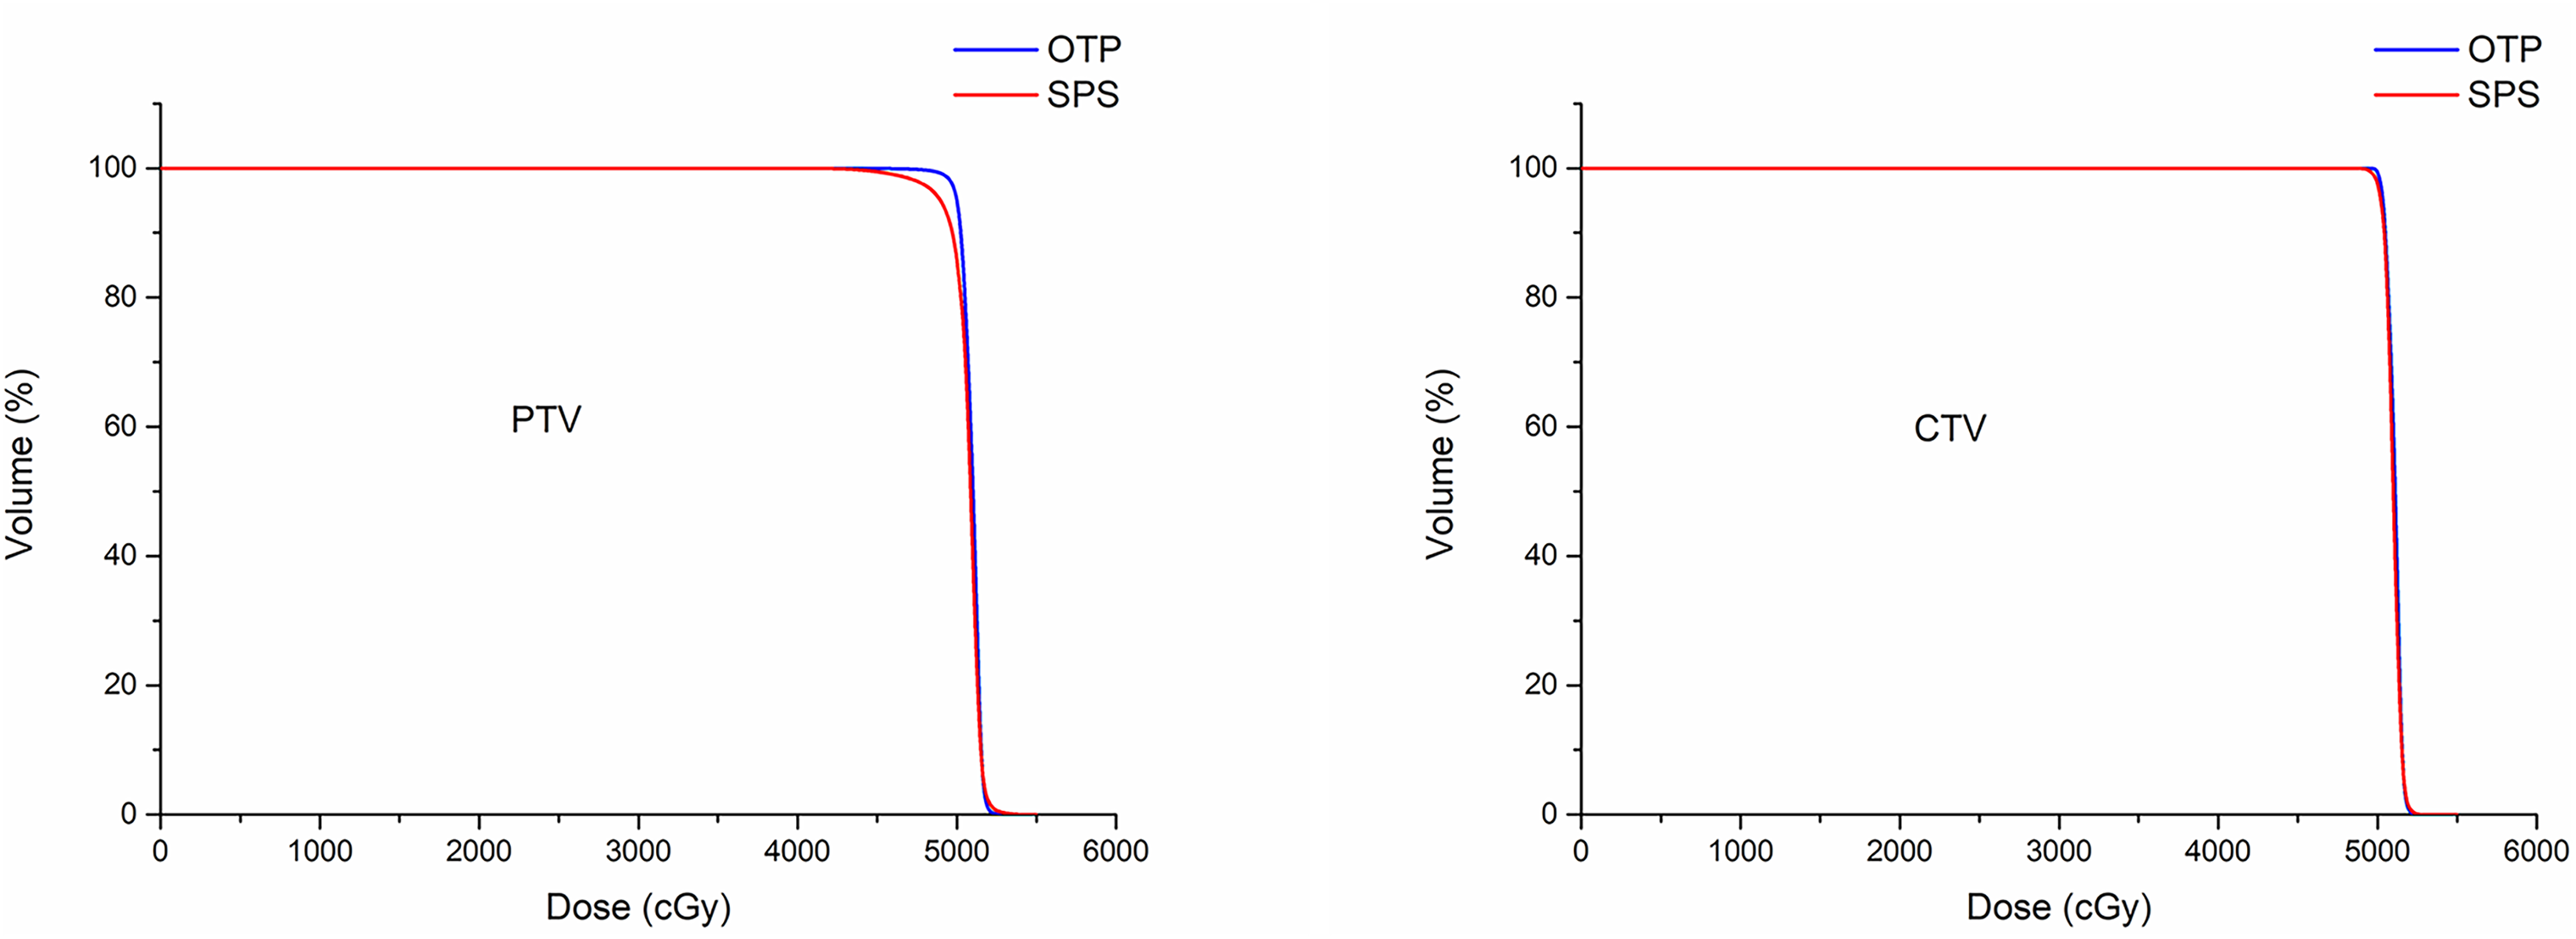
Dose-volume histograms (DVHs) of the planning target volume (PTV) and clinical target volume (CTV) between the original treatment plan (OTP) and simulated plan sum (SPS) for a representative case in the thermoplastic mask (TM) group.

Dose-volume histograms (DVHs) of the planning target volume (PTV) and clinical target volume (CTV) between the original treatment plan (OTP) and simulated plan sum (SPS) for a representative case in the vacuum bag (VB) group.

Isodose curves of the original treatment plan (OTP) and simulated plan sum (SPS) for a representative case.
Dose Comparison Between the OTPs and SPSs for the Target Volume in the TM and VB Groups.

OTP, original treatment plan; SPS, simulated plan sum; PTV, planning target volume; CTV, clinical target volume; Diff(%) = (SPS − OTP) / OTP × 100%.
Dosimetric Effects of Setup Errors on OARs
Table 5 respectively illustrates the comparative dosimetric results for the OARs between the OTPs and SPSs in the TM and VB groups. For the lung, the Dmean, V5Gy, V10Gy and V30Gy of the SPSs in the TM group increased by 1.2%, 0.6%, 0.5% and 0.1%, respectively, compared to the OTPs (P < .05). In the VB group, only the V10Gy of the SPSs increased by 0.5% compared to the OTPs (P < .05), with no statistical differences observed in other parameters. For the SC-PRV, the D2% and Dmax of the SPSs in the VB group decreased by 2.1% and 3.9% compared to the OTPs (P < .05), and there was no statistical difference in the TM group. Regarding the NT, the TM group SPSs showed 0.3% and 0.2% increments in V5Gy and V10Gy, respectively, compared to the OTPs (P < .05), while the VB group SPSs exhibited similar trends with 0.3% and 0.1% rises in these metrics (P < .05). However, no statistical differences were observed in the doses to the heart and spinal cord between OTPs and SPSs in both groups. Figures 7 and 8 present the DVH comparisons of the OARs for a representative case, considering the OTP and SPS in the TM and the VB groups, respectively.

Dose-volume histograms (DVHs) of the lung, spinal cord, spinal cord planning organ at risk volume (SC-PRV), heart and normal tissue (NT) between the original treatment plan (OTP) and simulated plan sum (SPS) for a representative case in the thermoplastic mask (TM) group.

Dose-volume histograms (DVHs) of the lung, spinal cord, spinal cord planning organ at risk volume (SC-PRV), heart and normal tissue (NT) between the original treatment plan (OTP) and simulated plan sum (SPS) for a representative case in the vacuum bag (VB) group.
Dose Comparison Between the OTPs and SPSs for the OARs in the TM and VB Groups.

OAR, organ at risk; OTP, original treatment plan; SPS, simulated plan sum; SC-PRV, spinal cord planning organ at risk volume; NT, normal tissue; Diff(%) = (SPS − OTP) / OTP × 100%, used for Dmean, D2% and Dmax; Diff(%) = SPS − OTP, used for V5Gy, V10Gy, V20Gy and V30Gy.
Influence of Setup Errors on TCP and NTCP
Table 6 shows that setup errors resulted in a significant reduction in the TCP of PTV in the TM and the VB groups, respectively, when utilizing the WN model to calculate. Specifically, in both the TM and VB groups, the TCP of PTV decreased by 1.2% and 2.0%, respectively, in the SPSs compared to the OTPs (P < .05). Furthermore, in the SPSs, the NTCP of the lung in the TM group increased slightly by 0.1% compared to the OTPs (P < .05), while the NTCP of the lung in the VB group did not differ between the OTPs and SPSs (P > .05). There was a statistical difference in the NTCP of the SC-PRV between OTPs and SPSs in the VB group, but the difference was small enough to be negligible. However, the setup errors had no effect on the TCP of CTV and NTCP of the spinal cord and heart in the TM and VB groups (P > .05).
Comparison of TCP/NTCP Between the OTPs and SPSs in the TM and VB Groups.

OTP, original plan; SPS, simulated plan sum; CTV, clinical target volume; PTV, planning target volume; SC-PRV, spinal cord planning organ at risk volume; TCP_WN, represents the tumor control probability (TCP) calculated using Webb-Nahum model; NTCP, normal tissue complication probability; Diff(%) = SPS − OTP.
Correlation Between the RSE and the Variation of TCP / NTCP
Table 7 demonstrates a negative correlation (P < .05) between the mean absolute value of RSE in the CC and AP directions and the TCP of the PTV. Specifically, it highlights that an increase in the mean absolute RSE values in these directions leads to a corresponding decrease in the TCP of PTV. Furthermore, the study reveals that the SD of RSE in the LR, CC and AP directions also exerts a negative impact (P < .05) on the TCP of PTV, indicating that an increase in the SD of RSE is associated with a decrease in the TCP of PTV.
Correlations Between the RSE and the Variations of TCP/NTCP (r / P value).

RSE, real setup errors; LR_mean, the mean (for lung and spinal cord) or mean absolute value (for PTV and CTV) of RSE in the left-right direction; LR_SD, the standard deviation of RSE in the left-right direction; CC_mean, the mean (for lung and spinal cord) or mean absolute value (for PTV and CTV) of RSE in the cranio-caudal direction; CC_SD, the standard deviation of RSE in the cranio-caudal direction; AP_mean, the mean (for lung and spinal cord) or mean absolute value (for PTV and CTV) of RSE in the anterior-posterior direction; AP_SD, the standard deviation of RSE in the anterior-posterior direction; PTV_TCP variation, the variation of tumor control probability in the planning target volume; CTV_TCP variation, the variation of tumor control probability in the clinical target volume; Lung_NTCP variation, the variation of normal tissue complication probability in the lung; Spinal cord_NTCP variation, the variation of normal tissue complication probability in the spinal cord.
Table 7 also reveals a positive correlation (P < .05) between the mean RSE in the CC and AP directions and the NTCP of the lung. Specifically, it indicates that a positive mean RSE, reflecting a setup error biased towards the head and face, leads to an increase in the NTCP of the lung. Conversely, a negative mean RSE, indicative of a setup error biased towards the feet and back, results in a decrease in the NTCP of the lung. Moreover, the mean RSE in the AP direction displays a similar positive correlation (P < .05) with the NTCP of the spinal cord, where a positive mean RSE (bias towards the face) augments the NTCP of the spinal cord, while a negative mean RSE (bias towards the back) diminishes it.
Figure 9(a) and (b) illustrate scatter plots depicting the correlations between the mean absolute value of RSE in the CC and AP directions and the TCP variation of the PTV, respectively. Figure 9(c) through (e) present scatter plots showing the correlations between the SD of RSE in the LR, CC and AP directions and the TCP variation of the PTV. Figure 9(f) displays a scatter plot exhibiting the correlation between the mean RSE in the CC direction and the NTCP variation of the lung. Figure 9(g) and (h), respectively, present scatter plots that reveal the correlations between the mean RSE in the AP direction and the NTCP variation of the lung and the spinal cord.

Scatter plots showing correlations between the mean absolute value of real setup errors (RSE) in the cranio-caudal (CC) direction and the tumor control probability (TCP) variation of the planning target volume (PTV) (a), the mean absolute value of RSE in the anterior-posterior (AP) direction and the TCP variation of the PTV (b), the standard deviation (SD) of RSE in the left-right (LR) direction and the TCP variation of the PTV(c), the SD of RSE in the CC direction and the TCP variation of the PTV (d), the SD of RSE in the AP direction and the TCP variation of the PTV (e), the mean RSE in the CC direction and the normal tissue complication probability (NTCP) variation of the lung (f), the mean RSE in the AP direction and the NTCP variation of the lung (g), the mean RSE in the AP direction and the NTCP variation of the spinal cord (h).
Discussion
In this study, a new setup error simulation method was proposed, and based on this method, the dose distribution, TCP and NTCP changes caused by setup errors were simulated. The results show that the setup errors may significantly decrease the D95%, D98%, iHI, CI and TCP of the PTV, increase the high dose of the PTV and CTV, and slightly decrease the low dose of the CTV in the VB group. However, the dosimetric impact on the OARs is minimal, and the TCP of CTV, NTCP of spinal cord and heart remain unaffected.
Our findings align with the research conducted by Tamihardja et al, 32 who conducted a CBCT-based dose accumulation analysis for the dominant intraprostatic lesion in primary radiotherapy of prostate cancer. They observed an increase in the D2% of the target and a decrease or no significant change in the D98%, indicating a decline in dose homogeneity. Similarly, they reported only minor dose variation for OARs. A comparable trend was also noted in the study on postmastectomy radiotherapy by Zhang et al. 17 Additionally, the study on Nasopharyngeal carcinoma by Ding et al 33 revealed deteriorated dose homogeneity, decreased TCP and significant dose variations in several OARs due to setup uncertainties. The observed differences in OAR dose variation compared to our study may be attributed to the closer proximity of the OARs to the PTV in their research.
In radiation therapy simulation planning, several methods are utilized to determine the values of setup errors. Currently, these typically include direct numerical input, CBCT-based estimation, and estimation through surface guidance systems. (1) Direct numerical input is straightforward and simple, but it may not accurately reflect the actual variability and randomness of setup errors, potentially leading to biased impact assessments. (2) CBCT-based estimation33,34 provides accurate data, but it prolongs scanning time and may increase the patient's additional radiation exposure. (3) Surface guidance systems offer real-time monitoring and quick management of setup errors,35,36 but they are more appropriate for tumors near the body surface. In our study, we opted to use CBCT to obtain the setup error value due to the deep location of esophageal cancer. Typically, after determining the values of setup errors, CT or CBCT images may be used for dose recalculation for simulation of setup errors. CBCT could capture shape changes in internal organs for different treatment fractions, but it has limitations such as a low signal-to-noise ratio, unclear images, inaccurate electron density, a limited field of view (FOV). If the target area is too extensive, the CBCT scanning range may not encompass the entire target, complicating the evaluation of the complete target dose distribution. Therefore, CT images were used for dose recalculation in this study.
Previous studies have employed a methodology that simulates fixed-distance errors to assess their dosimetric consequences. For instance, Prabhakar et al 37 demonstrated that a 3 mm shift in the isocenter position along the right and left lateral followed by anterior directions led to the parotid gland exceeding its tolerated dose threshold. Similarly, Komori et al 38 found that the dose deviations in the tumor and mucosa could be contained within ±5% when setup errors were confined to ±3.0 mm in all directions. These results defined the allowable limits for setup errors under extreme conditions. In contrast, the simulation method employed in the present study is tailored to evaluate the dose impact under normal treatments, offering a more realistic assessment of the dosimetric consequences under normal operating conditions. This novel method may be used for other researchers in future study. This simulation method can be applied to daily work, and it is recommended that this simulation method be integrated into the treatment planning system in the future. By inputting the parameters of the setup errors, the impact of the setup errors on dosimetry and biology can be evaluated, which is conductive to the timely adjustment and optimization of the treatment plan.
The choice of immobilization has a direct impact on the amount of setup error. Song et al 39 identified the immobilization device as an independent factor influencing setup errors in radiotherapy. Our analysis of setup errors, as presented in Table 2, the notable disparity in setup errors between the TM and VB groups, particularly in the CC and AP directions, may be attributed to several factors. Firstly, the VB's immobilization in these directions offers less rigidity and restraint compared to the TM, allowing for greater patient movement. Secondly, the marking line used with the VB is applied directly to the patient's skin, necessitating bodily movement during positioning, thereby complicating the process. Therefore, the VB group exhibited a higher sensitivity to setup errors, such as the D95%, D98%, iHI and CI of PTV. The variations of VB group was 2.5%, 4.5%, 4.2% and 15.6%, respectively, while the variations of TM group was 1.2%, 2.2%, 2.3% and 7.3%. The assessment of setup error is crucial in determining the appropriate setup margin, which is used to reduce sensitivity to setup error. 33 If the setup error is overestimated, the setup margin may be unnecessarily wide, leading to increased target volume and potentially affecting more normal tissue. Conversely, underestimating setup error may result in a narrow setup margin, which could compromise target coverage and increase the risk of uncontrolled tumor growth, as the TCP is more likely to depend on the volume that received the minimum dose. 19 By accurately assessing setup error, we can optimize the setup margin to ensure adequate target coverage while minimizing the irradiation of normal tissue. An appropriate setup margin 40 is essential for maintaining the intended dosimetric distribution. A well-defined setup margin allows for better alignment of the treatment field with the target volume, reducing the risk of underdosage to the target and overdosage to surrounding normal tissues. 41 This, in turn, can lead to improved treatment outcomes and reduced toxicity.
In this study, we refined the HI as defined by ICRU report 83. 23 The traditional formula for HI, (D2% − D98%) / D50%, aimed to quantify the homogeneity of the target volume, with a value nearing zero indicating better homogeneity. When calculating the relative change in the original HI, sometimes it may lead to unexplained values for variation. For instance, if the HI value in OTP is 0.04 and the corresponding HI value in SPS is 0.12, then the calculated relative change in HI would be (0.12-0.04) / 0.04 = 200%. This suggests that the HI for SPS is 200% worse than that for OTP, which is a misleading interpretation. If we adopt the newly improved iHI for calculation, the iHI for OTP would be 0.962 and 0.893 for SPS. In this condition, the change in iHI would be (0.893-0.962) / 0.962 = −7%, which provides a more interpretable result and indicates that the iHI in SPS is 7% lower than that in OTP. Overall, the iHI scales the original HI to a 0-1 range, making the quantification of dose uniformity comparison between plans more interpretable.
The findings of this study show that setup errors led to inhomogeneous dose distribution in the target volume, and then led to the increase of cold spots and high dose, as illustrated in Figure 6, which depicts the isodose profiles of the target volume in the SPS. Crucially, the emergence of cold spots bears a significant correlation with the reduction in TCP, signifying that a decrease in the approximately minimum dose delivered to the target volume may directly compromise TCP, 19 thereby diminishing the local tumor control efficacy. In this study, it was observed that the VB group exhibited a heightened risk of cold spots compared to the TM group. On the other hand, the dose uniformity of the OTP in the planning system was optimized to an exemplary level. However, in the SPS, the introduction of setup errors resulted in a displacement of the radiation field, worsening the dose uniformity. Consequently, an increase in high dose was observed. The proliferation of these high dose posed a heightened risk to the esophagus, potentially exposing it to elevated levels of irradiation, thereby increasing the risk of esophageal toxicity and even potentially serious consequences such as esophageal perforation or esophageal fistula. 42
Based on the findings regarding the implications of setup errors on OAR doses, it was observed that the impact of setup errors on OAR doses was minimal. As shown in Table 5, there was no effect on dose in the spinal cord and heart, except for a slight change in the lung and SC-PRV. This is because the effect of setup errors on the OAR doses is related not only to the size of error but also to the direction of error. Specifically, if a setup error causes the field's isocenter to shift towards the side of the OAR, it will result in an increased dose to that organ. Conversely, if a setup error shifts the isocenter away from the OAR, it will lead to a reduced dose to that organ. Therefore, the minor variations in doses to the OARs may be attributed to the varying directions of setup errors throughout the treatment course.
Furthermore, our study revealed that the SDs and mean absolute values of RSE in various directions, were associated with the TCP of PTV. Increasing SD or mean absolute value of RSE led to a gradual decrease in the TCP of PTV. In terms of NTCP of OARs, it was observed that the mean RSE in the CC direction impacted the NTCP of the lung positively. A positive mean RSE in the CC direction resulted in a bias of the field isocenter towards the patient's feet, leading to increased lung volume irradiation, lung dose and NTCP. Additionally, the mean RSE in the AP direction positively influenced the NTCP of the spinal cord and lung. A positive mean RSE in the AP direction caused a bias of the field isocenter towards the patient's back, resulting in increased irradiation volume of the spinal cord and lung, as well as their respective NTCP values. Therefore, in addition to be careful and meticulous to avoid large setup errors, special attention should be paid to the mean setup errors in the CC and AP directions. When a positive mean value occurs, it should be alert to the possibility of increasing the risk of normal tissue complications, especially radiation pneumonitis and radiation myelitis. Radiation pneumonitis is a well-known complication of thoracic radiotherapy, typically manifesting acutely and effectively treated with corticosteroids, but the progression to radiation-induced pulmonary fibrosis is difficult to predict.43,44 On the other hand, radiation myelitis is a severe complication of radiation therapy that can result in paraesthesia, paralysis, and, ultimately, death due to secondary infections. 45 Radiation myelitis, although rare, may occur, particularly for patients with target volume close to the spinal cord. Currently, there are no effective treatments for radiation-induced pulmonary fibrosis and radiation myelitis, except for prevention. Therefore, when monitoring setup errors, more attention should be paid to errors in some specific directions to minimize the risk of toxicity in normal organs.
In this study, we utilized the WN model and LKB model to calculate the TCP and NTCP, respectively. The WN model calculated the TCP based on the DVH for the PTV, 27 and it had been widely used in various studies across different types of cancer, such as esophageal cancer, 46 lung cancer 47 and nasopharyngeal carcinoma. 48 On the other hand, the LKB model is frequently used for evaluating and comparing treatment plans,49–53 selecting prescription doses, 54 and for the biological optimization of radiotherapy plans.55,56 In 1991, Emami et al 57 analyzed and summarized acceptable dose values of 28 OARs for uniform irradiation, based on literature data and personal experience. Subsequently, Burman et al 30 fitted these acceptable dose value data into the NTCP model proposed by Lyman. 58 The Lyman model was originally developed for uniform irradiation, but normal tissues were typically exposed to non-uniform irradiation. To address this, Kutcher and Burman 59 used an efficient volume conversion method to convert non-uniform doses into equivalent uniform doses, which could then be used with the Lyman model to calculate NTCP. This integrated NTCP model is commonly referred to as the LKB model. Tsougos’ study demonstrated that LKB model exhibits sufficient predictive capacity when appropriate model parameters are selected. 20
To the best of our knowledge, there are few reports on the impact of simulated setup errors on TCP and NTCP for IMRT of esophageal cancer. Our study fills a knowledge gap in this area. However, our study has five limitations. Firstly, we only monitored inter-fraction errors, and did not include an analysis of potential intra-fraction errors. Further investigation is needed to assess the impact of intra-fraction errors. Secondly, our study did not account for potential changes in tumor shape, volume and anatomical structure during treatment, as we solely focused on the impact of setup errors. Thirdly, rotational error data was unavailable due to the absence of a six-dimensional couch on our Varian TrueBeam linac. Fourthly, it should be noted that the setup error simulation in this study was solely based on weekly CBCT scans, and the use of more frequent CBCT scans would have provided greater precision. Lastly, the sample size of our study is relatively small for the comparisons of dosimetric and radiobiological parameters between the TM and VB groups, which may lead to underpowered results for detecting small effect sizes, so the findings have to be considered descriptive and require further validation in larger studies.
Conclusions
This study presents a novel approach to simulate the effect of setup errors on dosimetry and radiobiology. The results show that setup errors may affect the dose distribution of the PTV, CTV and OARs, reducing dose homogeneity and conformity, and resulting in a reduction in the TCP of PTV as well as increasing the cold spots and high dose within the CTV. The impact of setup errors on OAR doses and NTCP is minimal. Meanwhile, relatively large mean setup errors in certain specific directions may significantly increase the toxicity of OARs. Therefore, it is particularly important to monitor setup errors during IMRT for esophageal cancer, and more attention should be paid to the mean value of the setup errors in certain specific directions, especially when they shift the isocenter towards the OARs. The impact of setup errors should be evaluated to allow for timely adjustments to the treatment plan. Additionally, VB immobilization may result in relatively larger impacts of setup errors compared to TM, but this needs future validation.
Footnotes
Data Availability Statement
The original contributions presented in the study are included in the article material. Further inquiries can be directed to the corresponding author.
Declaration of Conflicting Interests
The authors declared no potential conflicts of interest with respect to the research, authorship, and/or publication of this article.
Funding
The authors disclosed receipt of the following financial support for the research, authorship, and/or publication of this article: This work is sponsored by Medical Scientific Research Foundation of Guangdong Province (A2022218) and Special Fund Project for Science and Technology Innovation Strategy (Vertical Collaborative Management Direction) of Guangdong Province [Shan Fu Ke (2018) No. 157].
Ethics Statement
This retrospective study was approved by the Medical Ethics Committee of Cancer Hospital of Shantou University Medical College (approval number: 2023053). Due to the retrospective nature of this study, the ethics committee of the hospital waived the informed consent of the patients and confirmed compliance with the Declaration of Helsinki and the confidentiality of the patient data.