
Abstract
Objective:
To determine whether change in apparent diffusion coefficient value could predict early response to chemotherapy in breast cancer liver metastases.
Materials and Methods:
We retrospectively studied 42 patients (86 lesions) with breast cancer liver metastases who had undergone conventional magnetic resonance imaging and diffusion-weighted imaging (b = 0.700 s/mm2) before and after chemotherapy. Maximum diameter and mean apparent diffusion coefficient value (×10−3 mm2/s) of liver metastases from breast cancer were evaluated. The grouping reference was based on magnetic resonance imaging according to Response Evaluation Criteria in Solid Tumors (RECIST). Analysis of variance and receiver–operating characteristic analyses were performed.
Results:
Eighty-six metastases were classified as 40 responders and 46 nonresponders. A statistically significant correlation was found between prechemotherapy and postchemotherapy apparent diffusion coefficient values in responders, which were 0.9 ± 0.16 × 10⁻³ mm2/s, 1.05 ± 0.12 × 10⁻³ mm2/s, 1.26 ± 0.12 × 10⁻³ mm2/s, and 1.33 ± 0.87 × 10⁻³ mm2/s, respectively. No statistically significant difference was found between prechemotherapy and postchemotherapy apparent diffusion coefficient values in nonresponders. Differences were statistically significant between responders and nonresponders at prechemotherapy, 2 weeks after chemotherapy, and 4 weeks after chemotherapy (P = 0.014, P = .001, and P = .000, respectively). Receiver operating characteristic curves showed that apparent diffusion coefficient values could predict treatment response early at 2 weeks after chemotherapy with 64.5% sensitivity and 91.8% specificity.
Conclusion:
The change in apparent diffusion coefficient value may be a sensitive indicator to predict early response to chemotherapy in breast cancer liver metastases.
Introduction
Breast cancer, which disrupts many women, is becoming one of the most malignant tumors. The incidence rate of the disease is also increasing year by year and progressively younger. 1 About 30% to 50% of patients may eventually have distant metastasis of organs such as bone, lung, and liver, which are the common target for breast cancer metastasis. 2 Compared to other malignant tumors with liver metastases, breast cancer liver metastases (BCLMs) have become the indicator of advanced diseases. Accordingly, it is particularly important to improve the therapeutic effect of BCLMs. Currently, the treatment of BLCMs focuses on chemotherapy and hormonal therapy, although the symptoms can be relieved in some degree and the survival time can be extended. However, some research suggest that the median survival of the untreated BCLMs was no more than 6 months, while the median survival rates of the patients after treatment did not exceed 15 months. 3 -5 As a result, it is especially important for us to early assess the response to treatment and choose the appropriate treatment protocols.
Response Evaluation Criteria in Solid Tumors (RECIST) was used to evaluate tumor response in solid tumors based on changes in tumor size. 6 However, response assessment with the morphologic imaging has limitations in reliable differentiation of residual tumor tissue from necrotic tumor. Moreover, the change in tumor size, which lags behind the molecular changes, may be not an early sensitive indicator. 7 Based upon the motion of water molecules in intracellular and extracellular spaces, diffusion-weighted magnetic resonance imaging (DW-MRI) has been shown to be a promising modality. Apparent diffusion coefficient (ADC) values are used to quantify the diffusion restriction and reflect the response of tumor quantitatively.
In this study, we retrospectively studied 42 patients (86 lesions) with BCLMs from August 2014 to November 2017 at the affiliated Huaian No. 1 People’s Hospital of Nanjing Medical University. The ADC values of liver metastases were measured and analyzed at 4 time points: 3 to 4 days before chemotherapy, 1 week, 2 weeks, and 4 weeks after chemotherapy. The purpose of this study was to investigate the predictive value of DW-MRI for predicting the early response to chemotherapy at different time points in patients with BCLMs.
Patients and Methods
Patients
Between August 2014 and November 2017, patients who underwent breast cancer resection (36 cases with modified radical mastectomy, 6 cases with section resection) for BCLMs in our hospital were selected from our retrospective pathological database. Postoperative pathology confirmed that 30 cases were invasive ductal carcinoma and 12 cases were invasive lobular carcinoma. The inclusion criteria were DW-MRI examinations of diagnostic quality, completion of the scheduled chemotherapy, surgical excision, and definitive pathologic examination performed at our hospital. Of the 63 eligible patients, 21 were excluded because of they cannot accomplish the scheduled chemotherapy (18 patients) or the unavailability of DW-MRI at any points (owing to artifacts, 3 patients). As a result, the final study population included 42 patients, whose data were subsequently analyzed. All patients received a combination of Pharmorubicin and Docetaxel regimens. The liver metastases were mainly confirmed by needle biopsy or typical imaging findings and the follow-up.
Magnetic Resonance Imaging Protocol
All patients accepted MRI at 4 time points: 3 to 4 days before chemotherapy, 1 week, 2 weeks, and 4 weeks after chemotherapy. Each time each patient underwent both conventional MRI and DWI scans. All scans were performed in the supine position on a flat table top.
The MRI examinations were performed with a 1.5-T MR scanner (Magnetom Avanto; Siemens Healthcare, Erlangen, Germany) and 2 phased-array coils with 16 elements. The liver MRI protocol included transverse T1-weighted gradient-echo images (TR/TE, 226/7.15 milliseconds; matrix size, 512 × 512; FOV, 350 mm × 350 mm ∼ 400 mm × 400 mm; section thickness, 5 mm; slice gap, 0.5 mm), transverse T2-weighted turbo spin-echo images with fat suppression and coronal T2-weighted single-shot turbo spin-echo images(TR/TE, 5700/752 milliseconds; matrix size, 512 × 512; FOV, 350mm × 350mm ∼ 400 mm × 400 mm; section thickness,5 mm; slice gap, 0.5 mm) and transverse breathing-hold single-shot echoplanar DWI with 2 b values (b = 0, 700 s/mm2).
Magnetic Resonance Imaging Analysis
All MR images were analyzed by 2 experienced radiologists who were blinded to the therapeutic response and other dates of patients. The parameters were measured and recorded: lesion size, location, number, and mean ADC values. This process was performed by 2 experienced radiologists, and the mean values were calculated. The lesion size was recorded by the maximum diameter of tumor. The lesion location and number were observed on the axial T1-weighted, T2-weighted, and DW-MR images. The ADC map of each DW image was produced on a pixel-by-pixel basis. The region of interest (ROI) was manually drawn in the MR images at each time point. The area of ROI was no less than 30 mm2, and it was placed at every level of the lesion. In each tumor, the ROIs were drawn to include the target lesion on the ADC map and exclude the necrotic tissues in the tumor according to T1- and T2-weighted imaging. While in the CR group, the ROIs were drawn in the normal liver parenchyma at the same place of the original tumor.
Assessment of Therapeutic Response
The patient did DW-MRI examination at 3 to 4 days before chemotherapy, 1 week, 2 weeks, and 4 weeks after chemotherapy. Then, we evaluate the changes in tumor size at 4 weeks after chemotherapy with respect to 3 to 4 days before chemotherapy, according to RECIST1.1 criteria. 4 All the lesions disappearing for 4 weeks were seen as complete response (CR); a lesion showing at least 30% of reduction in the maximum transverse diameter with respect to prechemotherapy was classified as partial response (PR); a lesion not presenting such dimensional decrease or increase was considered as stable disease; and a lesion presenting a 20% or more increase in the maximum transverse diameter with respect to prechemotherapy was regarded as progressive disease. As the lesions remain PR or CR, we see them as responding (R). While those stable or progressing were labeled as nonresponding (NR; Figure 1)
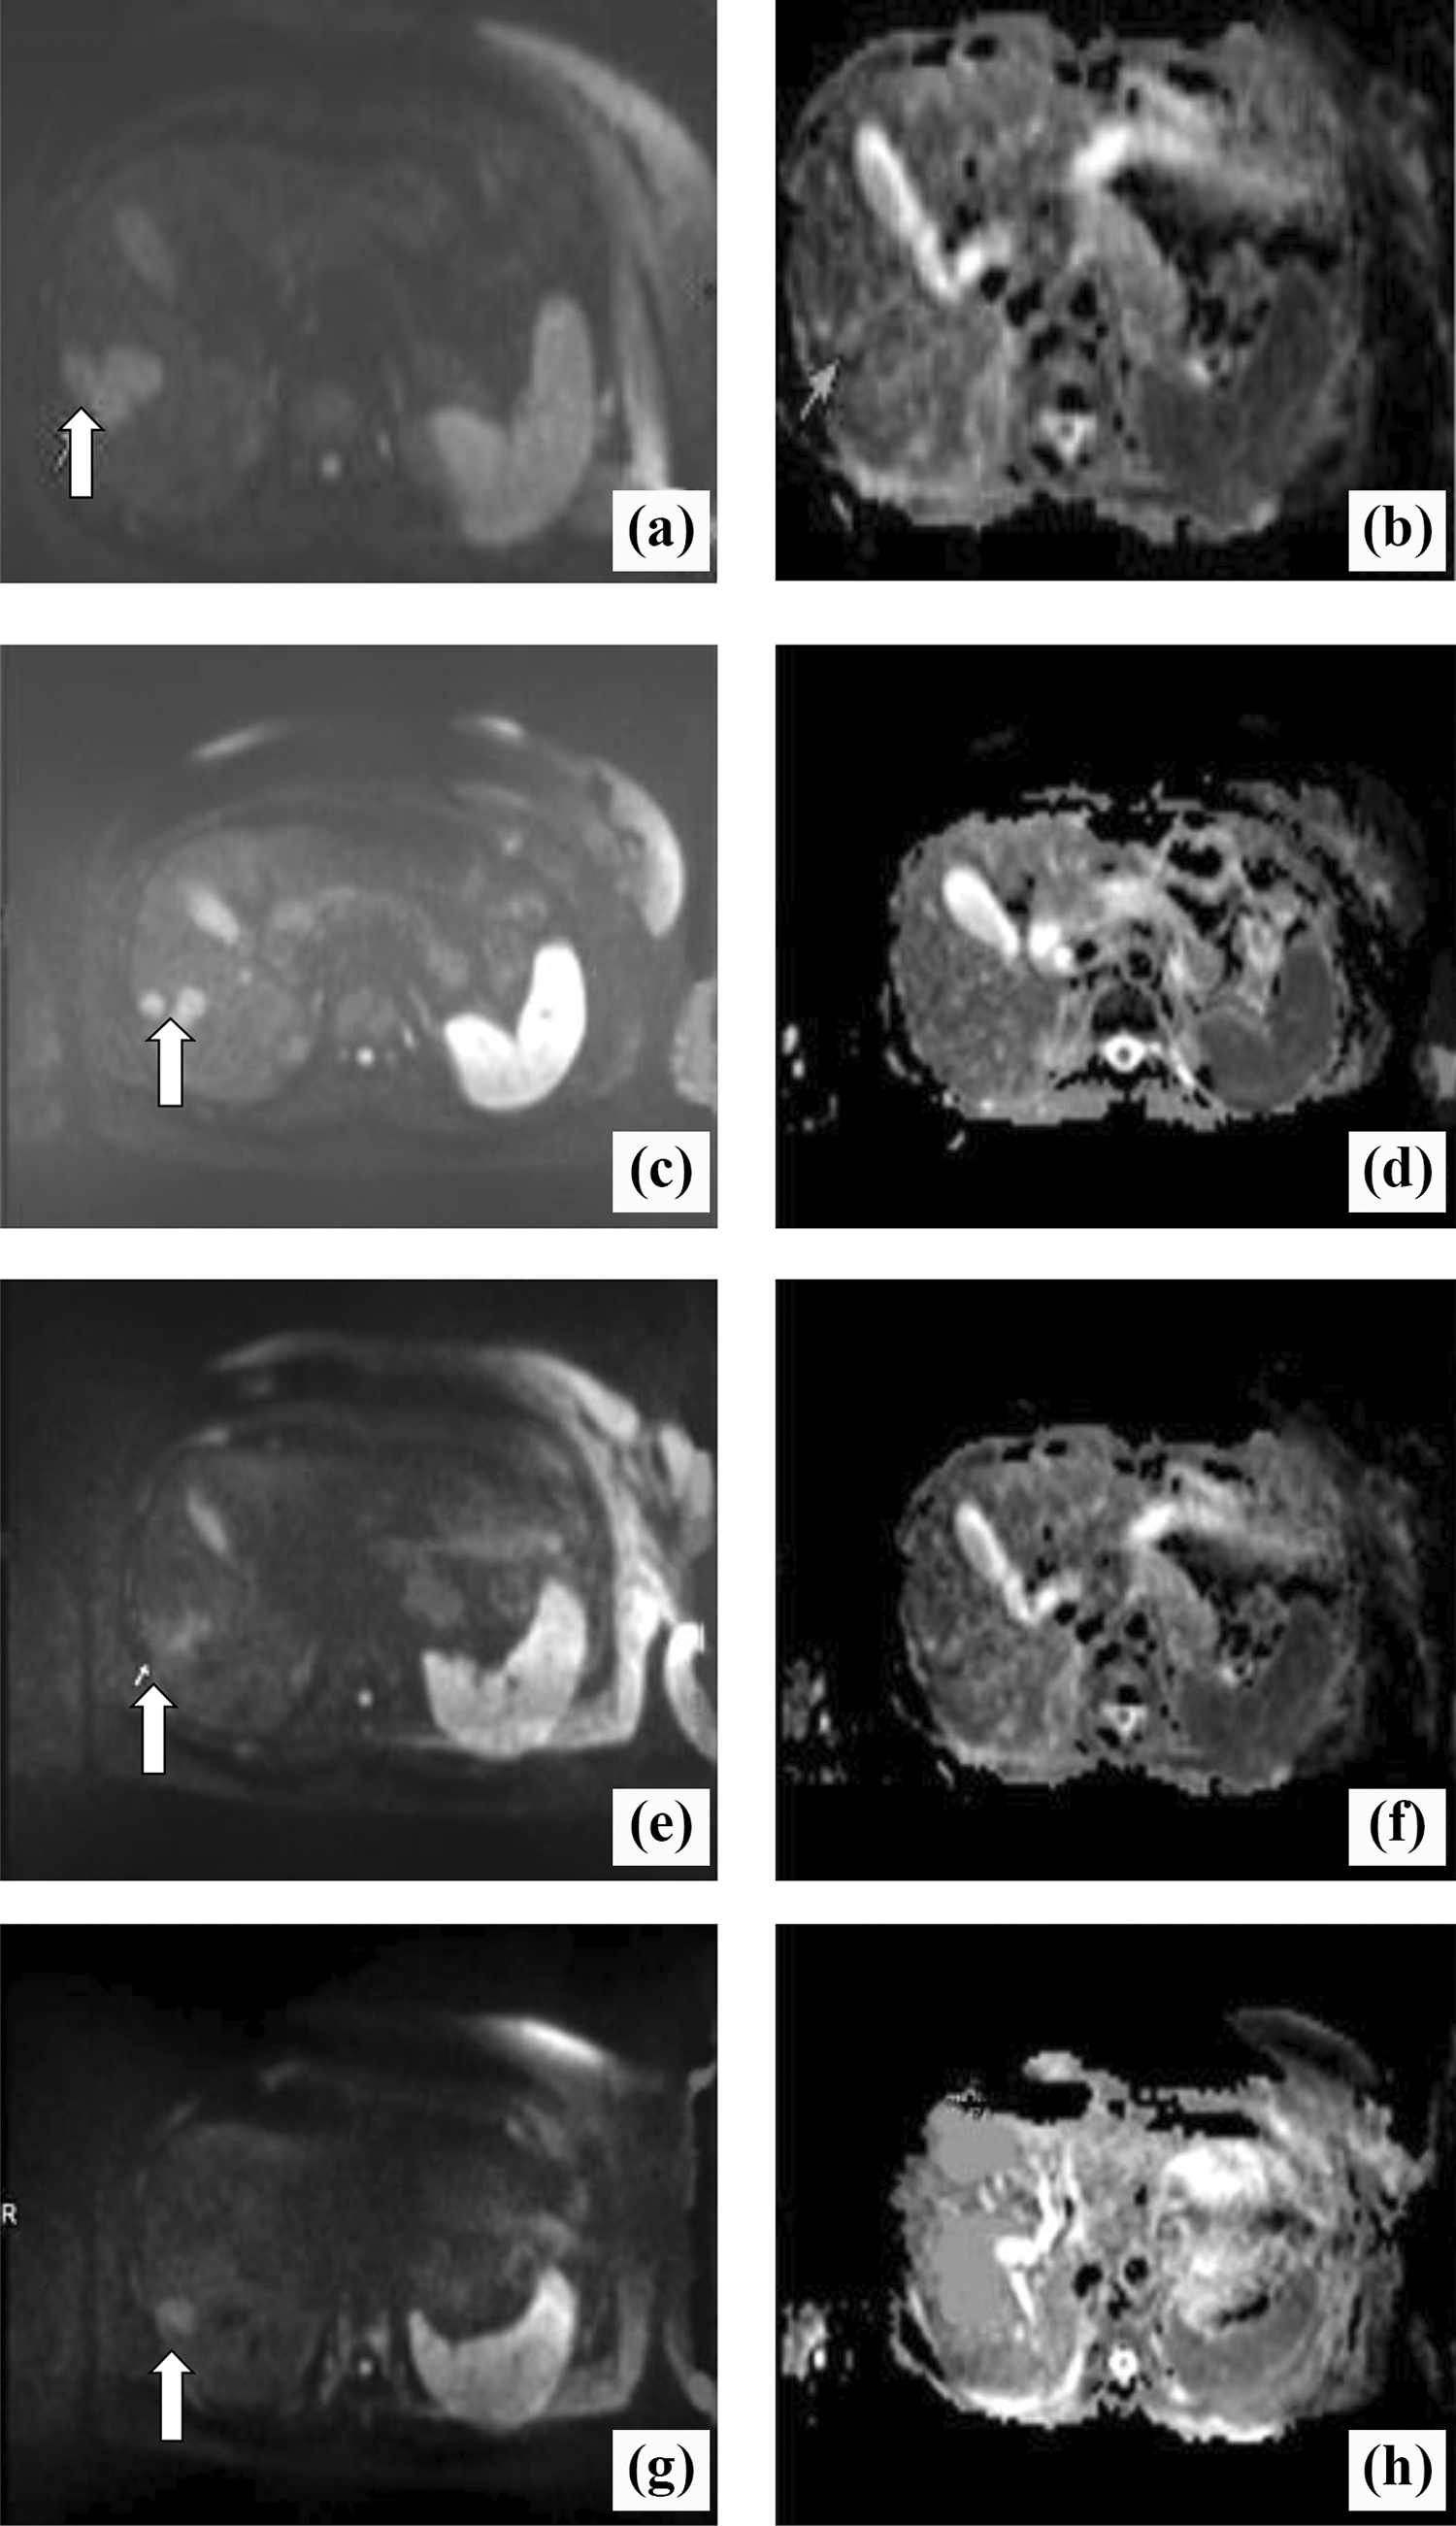
A 54-year-old patient with breast cancer liver metastases (BCLM) who received chemotherapy: (A and B) 3 to 4 days before chemotherapy; (C and D) 1 week after chemotherapy; (E and F) 2 weeks after chemotherapy; (G and H) 4 weeks after chemotherapy. In the diffusion-weighted magnetic resonance (DW-MR) images (A, C, E, F), the white arrow indicates the marker metastatic lesion located in the right lobe evaluated for dimensional and apparent diffusion coefficient (ADC) changes. Dimensional reduction is clearly visible at the early stage (C, E). The ADC maps show a consecutive increase in ADC(×10−3 mm2/s): 0.96 before chemotherapy (B), 1.07 after 1 week of chemotherapy (D), 1.38 after 2 weeks of chemotherapy (F), and 1.45 after 4 weeks of chemotherapy (H).
Statistical Analysis
Statistical analysis was performed using SPSS17.0 software, and the results were expressed as the mean (standard deviation). All data in our study were conducted by normality test. Besides, paired student t tests and 1-way analysis of variance were used to analyze the difference in ADC value between different groups and time periods. A level of P < .05 was considered statistically significant. Receiver–operator characteristic (ROC) curves were performed for assessing diagnostic performance of ADC value for prediction of early response to chemotherapy at 4 different time points.
Results
Patient Characteristics
This retrospective study was approved by an institutional review board, and the requirement to obtain informed consent was waived. Sixty-three patients were included in the study. Twenty-one patients were excluded from data analysis because they cannot accomplish the scheduled chemotherapy or unavailability of DW-MRI at any points. The remaining 42 patients were analyzed. Patient and tumor characteristic are shown in Table 1.
Patient Characteristics.

They were all female, and the mean age was 51.4 years (44-72 years). The primary breast tumors were treated with surgical resection, 36 cases treated with modified radical mastectomy and 6 cases treated with section resection. After histopathological examination, 30 patients were confirmed as invasive ductal carcinoma; other 12 patients were proven as invasive lobular carcinoma. Liver metastases were found by computed tomography, MRI, or positron emission tomography and confirmed by needle biopsy or typical imaging findings. When the metastatic nodules were found, all patients underwent treatment with chemotherapy of a combination of Pharmorubicin and Docetaxel regimens. Of the 86 liver metastases, there were 75 hypointensity, 8 isointensity, and 3 hyperintensity signals on T1-weighted imaging, while 45 hyperintensity and 41 mixed-intensity signals on T2-weighted imaging.
Analysis of Dimensional Changes
According to RECIST1.1, we calculated the rate of change in the maximum diameter (△Dia) between 3 to 4 days before chemotherapy and 4 weeks after chemotherapy. △Dia(%) = [(Diapre − Diapost ) / Diapre ] × 100%. Then, if the △Dia ≥ 30%, we classified them as R (40 lesions). Otherwise, we viewed them as NR (46 lesions). The △Dia of R group at 1 week and 2 weeks after chemotherapy were 0.034 ± 0.019 and 0.207 ± 0.306, respectively, with no statistically significant differences (P > .05). The △Dia of NR group at 1 week and 2 weeks after chemotherapy were 0.010 ± 0.036 and 0.439 ± 0.116, respectively, with no statistically significant differences (P > .05), while the △Dia of R group at 1 week and 4 weeks after chemotherapy were 0.034 ± 0.019 and 0.552 ± 0.255, respectively, with statistically significant differences (P = .000). The △Dia of NR group at 1 week and 4 weeks after chemotherapy were 0.010 ± 0.036 and 0.65 1 ± 1.560, respectively, with no statistically significant differences (P > .05). The results are presented in Tables 2 and 3.
The Comparison of △Dia in Different Groups Between 1 Week and 2 Weeks After Chemotherapy.

Abbreviations: NR, nonresponders; R, responders.
The Comparison of △Dia in Different Groups Between 1 Week and 4 Weeks After Chemotherapy.

Abbreviations: NR, nonresponders; R, responders.
Analysis of ADC Changes
The mean ADC values of all the liver metastatic nodules at four different time points were 1.04 ± 0.24 × 10⁻³ mm2/s, 1.08 ± 0.24 × 10⁻³ mm2/s, 1.09 ± 0.25 × 10⁻³ mm2/s, and 1.07 ± 0.23 × 10⁻³ mm2/s, respectively, with no obvious increase after chemotherapy. The mean ADC values of lesions in R group at 4 different time points were 0.9 ± 0.16 × 10⁻³ mm2/s, 1.05 ± 0.12 × 10⁻³ mm2/s, 1.26 ± 0.12 × 10⁻³ mm2/s, and 1.33 ± 0.87 × 10⁻³ mm2/s, respectively. In addition, postchemotherapy ADC values were significantly higher than prechemotherapy ADC values, and the difference was statistically significant.
The mean ADC values of lesions in the NR group at 4 different time points were 1.09 ± 0.24 × 10⁻³ mm2/s, 1.08 ± 0.27 × 10⁻³ mm2/s, 1.03 ± 0.26 × 10⁻³ mm2/s, and 0.97 ± 0.20 × 10⁻³ mm2/s, respectively. However, postchemotherapy ADC values were similar to prechemotherapy ADC values, and there was no statistical significance (P > .05). The mean ADC values of R and NR groups before chemotherapy were 0.9 ± 0.16 × 10⁻³ mm2/s and 1.09 ± 0.24 × 10⁻³ mm2/s, respectively, with statistical significance (P < .05). The mean ADC values of R and NR groups at 1 week after chemotherapy were 1.05 ± 0.12 × 10⁻³ mm2/s and 1.08 ± 0.27 × 10⁻³ mm2/s, respectively, with no statistical significance (P > .05). The mean ADC values of R and NR groups at 4 weeks after chemotherapy were 1.26 ± 0.12 × 10⁻³ mm2/s and 1.03 ± 0.26 × 10⁻³ mm2/s, respectively, with statistical significance (P < .001; Table 4).
The Comparison of ADC Values in Different Groups Between Prechemotherapy and Postchemotherapy.

Abbreviations: ADC, apparent diffusion coefficient; NR, nonresponders; R, responders.
Analysis of ROC Curve
The diagnostic performance of ADC values to predict the therapeutic response earlier was assessed through the construction of ROC curves and calculation of the subtending areas (areas under the ROC curves [AUC]). To identify the optimal ADC cutoff value, the maximum Youden index was chosen on the estimated curves. Sensitivity and specificity were computed with exact 95% confidence intervals (CIs;Figure 2).

Receiver–operator characteristic (ROC) curves for evaluation of apparent diffusion coefficient (ADC) value at the corresponding time.
The AUC of ADC values at 1 week, 2 weeks, and 4 weeks after chemotherapy were 0.446 (95% CI: 0.28-0.68), 0.782 (95% CI: 0.65-0.92), and 0.934 (95% CI: 0.86-0.96), respectively (Table 5). We can conclude that the ADC value at 2 weeks after chemotherapy was with higher diagnostic performance. The ADC value of 1.14 × 10⁻³ mm2/s was chosen by us, which was the cutoff to assess efficacy after chemotherapy by ROC curves. The corresponding AUCs were 0.782, and the 95% CI was 64.5% to 91.8%.
Areas Under the Curve (AUC) With Corresponding 95% Confidence Intervals Extrapolated From the Receiver–Operator Characteristic (ROC) Analysis of ADC Value at 3 Different Time Points.

Discussion
In this study, we demonstrate the predictive value of ADC value for good chemotherapeutic effect at different time points before and after chemotherapy in patients with BCLMs. If the treatment response or outcome of patient can be achieved before and during treatment, patients with BCLMs may achieve tailored management by adjusting treatment regimens. For all time points (3-4 days before chemotherapy, 1 week, 2 weeks, and 4 weeks after chemotherapy), the mean ADC values in R group increased gradually. The increase in ADC value was significant from 2 weeks after chemotherapy, which was similar to the results of previous studies of other cancers. 8 -11 The increase in ADC value was related to necrosis and reduced cell density. Chemotherapy leads to cell death which causes a decrease in cell density and consequentially higher ADC values. However, these results were contradicted with the result of rectal cancer research on the decreasing trend of ADC value at 2 to 4 weeks after chemotherapy. 12 The decrease in ADC value may be related to cytotoxic edema and fibrosis on histology. In the NR group, the mean ADC values at the corresponding time were decreased gradually and with no significant difference between prechemotherapy and postchemotherapy. A previous study reported that necrotic tumors are frequently hypoxic and poorly perfused, leading to diminished sensitivity and poor local control to chemoradiation therapy. 13 From this perspective, it was postulated that the liver metastases in NR group may be consisted with a large portion of necrosis.
Previously published studies suggested that the changes in ADC values could predict the early efficacy of treatment in the tumor. 8,10,11,14,15 In this study, statistically significant differences in the changes of tumor size can be found at 4 weeks after chemotherapy, while significant differences in the changes of ADC values can be detected at 2 weeks after chemotherapy (Tables 2 -4). This result demonstrates that ADC changes may precede dimensional ones in accordance with the previous published studies. The ROC analysis of the mean ADC value at 4 different points indicates that the changes in ADC values were evident at 2 weeks after chemotherapy with AUC of 0.782, and the AUC of ADC values at 4 weeks after chemotherapy was 0.934 with the best diagnostic efficiency. The abovementioned results demonstrate that we can select the ADC values of the lesions at 2 weeks after chemotherapy, as the early evaluation standard of therapeutic effect with the 95%CI ranging between 64.5% and 91.8%. In our research, ADC value of 1.14 × 10⁻³ mm2/s was chosen as the cutoff to assess response to chemotherapy in BCLMs by ROC curves with 64.5% sensitivity and 91.8% specificity. However, the cutoff remains to be the follow-up and the summary of the bulk in cases.
As regards the pretreatment ADC value, investigators have different ideas. In our study, the prechemotherapy ADC value of R group was obviously lower than that of NR group, and the difference was statistically significant. This result was in agreement with the previous studies. 10,16 -18 The reason for the low ADC values in R group before chemotherapy may lie in the fact that tumors with high prechemotherapy ADC values seem more necrotic than those with low ADC values. Necrotic tumors may be more correlated with poor tissue perfusion, an acidic microenvironment, and a low oxygen concentration, leading to a higher resistance to chemotherapy. 19 However, some studies reported that no significant correlation was found between pretreatment ADC and response to chemotherapy or radiotherapy. 20 -22 Moreover, other studies showed that negative correlation was found between pretreatment ADC and response to chemotherapy or radiotherapy. 23 The reasons for this discrepancy are uncertain, and the possible explanations may be as follows: (1) The methods used to measure ADC values were different among studies. For example, some studies measured ADC value using several small ROIs, while other studies measured ADC values using a large ROI placed on the solid portion of the tumor. (2) The b values chosen were different among studies. (3) Different cancers with different chemotherapy regimens among studies.
Diffusion-weighted imaging is an efficient method that reflects the diffusion of water molecules quantitatively by the calculation of ADC values. Accurate quantification of ADC values requires a good signal to noise ratio and an optimal range and choice of b values. When the b value is smaller than 200 s/mm2, ADC value would be influenced significantly by microcirculation perfusion effect 24,25 and with a bigger error. This is well known as intravoxel incoherent motion model. In a previous study of optimal b value in DWI for differentiation of abdominal lesions, 26 they found that differentiation between malignant and benign lesions using visual scoring was successful at b values of 600 s/mm2 or higher. In addition, there is also a study about optimal b value for characterization of liver lesions; they recommend the use of b values of 0 and 800 s/mm2 as 2 b values for distinguishing between benign and malignant liver lesions. 27 As a result, we choose the b values of 700 s/mm2 in our study.
There were several limitations in our study. (1) The selection bias is inevitable for the retrospective study and its relatively small population. Further studies with larger sample size are required in order to increase the statistical power and build adequate predictive models. Besides, we also found that the ADC histogram could be a useful predictor when we plan to pursue further research in this field. (2) The lesions smaller than 1 cm were excluded in our study. This exclusion criterion is due to the spatial resolution of the DWI acquisition that did not allow accurate measurement for small ROIs. (3) Our study cannot be free of measurements error because imaging parameters were deprived from manually drawn ROIs by one reader, introducing observer bias. Although all measurements were performed twice in the same place and an average was calculated, further study with an inter-reader validation is needed. Recently, based on an entire tumor, histogram-based analysis, the ADC measure is a more objective approach than single selected regional ROIs. What’s more, this approach has been shown substantial advantage in differentiating tumor grade and assessing therapeutic effect of cancer. 28 -30 (4) The DWI we performed used only 2 b values of 0 and 700 s/mm2; further study on the DWI with multiple b values for response evaluation would be helpful. 31 (5) We did not investigate the correlation between ADC value and the different pathological types of liver metastases. Therefore, further studies with a large cohort and histopathological correlation are warranted.
In this study, we first demonstrated that the mean ADC values of liver metastases significantly increased at 2 weeks after chemotherapy. This finding indicates that the increase in mobility of water molecules through the loss of membrane integrity or an increase in the proportion of total extracellular fluid due to a decrease in cell size is significant at 2 weeks after chemotherapy. Furthermore, we also found that the ADC values can predict the response of BCLMs before chemotherapy in some degree. Therefore, these results suggest that DWI may be an efficient method that can evaluate the response to chemotherapy in BCLMs earlier.
Conclusion
In conclusion, the change in ADC value may be a sensitive indicator to predict early response to chemotherapy in BCLMs.
Footnotes
Authors’ Note
Genji Bai and Yating Wang contributed equally to this work.
Declaration of Conflicting Interests
The author(s) declared no potential conflicts of interest with respect to the research, authorship, and/or publication of this article.
Funding
The author(s) received no financial support for the research, authorship, and/or publication of this article.