
Abstract
Hypoxia is a condition, common to most malignant tumors, where oxygen tension in the tissue is below the physiological level. Among consequences of tumor hypoxia is also altered cancer cell metabolism that contributes to cancer therapy resistance. Therefore, precise assessment of tumor hypoxia is important for monitoring the tumor treatment progression. In this study, we propose a simple model for prediction of hypoxic level in tumors based on multiparametric magnetic resonance imaging. The study was performed on B16F1 murine melanoma tumors ex vivo that were first magnetic resonance scanned and then analyzed for hypoxic level using hypoxia-inducable factor 1-alpha antibody staining. Each tumor was analyzed in identical sections and in identical regions of interest for pairs of hypoxic level and magnetic resonance values (apparent diffusion coefficient and T 2). This was followed by correlation analysis between hypoxic level and respective magnetic resonance values. A moderate correlation was found between hypoxic level and apparent diffusion coefficient (ρ = 0.56, P < .00001) and lower between hypoxic level and T 2 (ρ = 0.38, P < .00001). The data were analyzed further to obtain simple predictive models based on the multiple linear regression analysis of the measured hypoxic level (dependent variable) and apparent diffusion coefficient and T 2 (independent variables). Among the hypoxic level models, the most efficient was the 3-parameter model given by relation (HL = k ADC ADC + k T2 T 2 + b), where k ADC = 26%/µm2/ms, k T2 = 0.8%/ms, and b = −32%. The model can be used for calculation of the predicted hypoxic level map based on magnetic resonance–measured apparent diffusion coefficient and T 2 maps. Similar prediction models, based on tumor apparent diffusion coefficient and T 2 maps, can be done also for other tumor types in vivo and can therefore help in assessment of tumor treatment as well as to better understand the role of hypoxia in cancer progression.
Introduction
Tumors mainly consist of highly proliferating cells with high demand on the oxygen supply. In bigger tumors, the oxygen supply often cannot follow its demand due to the unorganized tumor vasculature and the increasing distance between cells and the existing vasculature, which is hampering oxygen diffusion. This creates a low oxygen level that leads to the hypoxic milieu. 1 If oxygenation of a normal tissue is between 4% and 9%, then in the respective tumors it falls down to the range of 1% and 2% or lower. 2,3 Tumor hypoxia induces different signaling pathways leading to growth of advanced but dysfunctional tumor vascularization, stimulation of a complex cell signaling network in tumor cells, and acquisition of epithelial-to-mesenchymal transition phenotype resulting in cell mobility and metastasis. Furthermore, it also alters cancer cell metabolism and contributes to therapy resistance by inducing cell quiescence. 4 Therefore, a precise and efficient method of hypoxia measurement in tumors is of high importance for tumor treatment monitoring, and for this task, nuclear magnetic resonance (NMR) and magnetic resonance imaging (MRI) are 2 well-suited methods. 5,6
Local oxygen tension in a tissue can be measured by 19F magnetic resonance spectroscopy. The method utilizes perfluorinated molecular probes, of which the spin-lattice relaxation rate is proportional to the local oxygen tension.
7,8
This technique was used in preclinical studies, where its efficiency was demonstrated in monitoring changes in oxygen tension
9
and in phase I clinical studies using nitroimidazole hypoxia markers.
10
However, an important issue remains regarding administration of perfluorinated molecular probes. Intravenous administration is not efficient due to the probe sequestration in the liver and spleen, while their direct administration at the site of measurement is invasive. Overhauser-enhanced MRI is another technique that allows hypoxia imaging by combining MRI with quantitative pO2 measurements, providing both hypoxia and microvascular permeability data noninvasively.
11
Since hypoxic tumors often exhibit poor perfusion, dynamic contrast-enhanced MRI (DCE-MRI) that measures tissue perfusion rates can provide also an insight into the extent of tumor hypoxia. It was found that the DCE-MRI signal increase over baseline correlates with perfusion and therefore also with pO2
12
Oxygen-enhanced MRI (OE-MRI) was found also efficient in quantifying tumor hypoxia in preclinical cancer models.
13
Blood oxygen level-dependent (BOLD) MRI is sensitive to elevated concentrations of endogenous paramagnetic deoxyhemoglobin that result in an increased relaxation rate [
In this study, we present a simple method for prediction of hypoxic level (HL) in tumors, based on multiparametric imaging of tumors including standard mapping techniques, that is, ADC and T 2 mapping. The study was performed on B16F1 murine melanoma tumors that were first MR scanned and then analyzed for HL using hypoxia-inducable factor 1-alpha (HIF-1α) antibody staining. Each tumor was analyzed in identical sections and in identical regions of interest (ROIs) for pairs of HL and MR values (ADC and T 2). This was followed by correlation analysis between HL and the respective MR values. Finally, a predictive model for HL based on the multiple regression analysis was proposed.
Materials and Methods
Tumors
Six tumors, selected for the study, were B16F1 murine melanoma. The tumors were induced in female C57Bl/6 mice (Envigo Laboratories, Udine, Italy) with the injection of 106 B16F1 cells (American Type Culture Collection, Manassas, Virginia) in 100 µL of physiological solution into the shaved right flank of the mice. When the tumors reached 40 or 100 mm3, mice were killed, the tumors were excised and tagged at one end of their long axis with a green tissue marking dye (08-0728-3; Cancer Diagnostics, Inc, Morrisville, North Carolina). Each excised tumor was stored in physiological solution on ice and immediately transported to the MRI facility where the scanning started within next 2 hours after the tumor excision. Before the scanning, the tumors were taken out of solution, gently wiped, and then placed in a 10-mm glass tube with the tagged part up. The tube was then sealed and inserted in the MRI scanner to prevent sample desiccation during the 140-minute MRI scan protocol (Table 1). After the MRI scanning, the tumor samples were fixed in zinc fixative (BD Biosciences, San Diego, California) to make them ready for the immunohistochemical (IHC) staining of hypoxia, as given subsequently.
Magnetic Resonance Imaging Sequence Parameters.
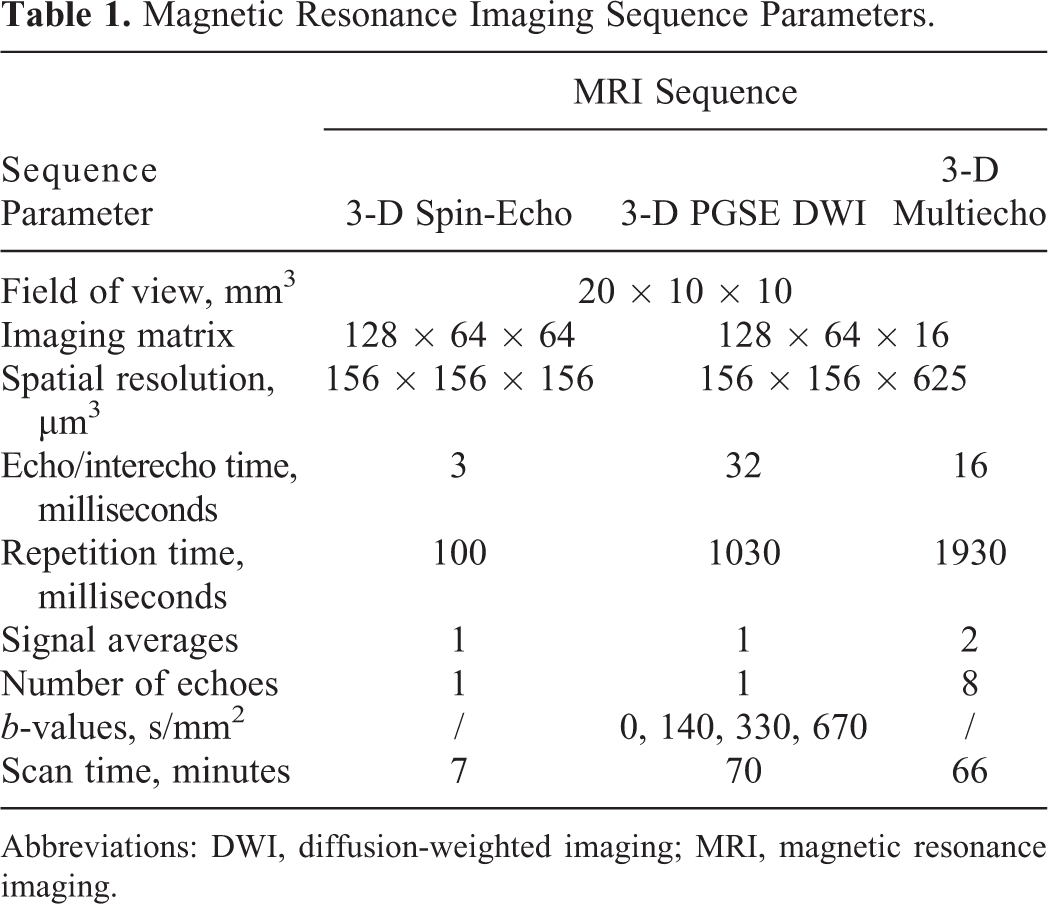
Abbreviations: DWI, diffusion-weighted imaging; MRI, magnetic resonance imaging.
All animal experiments were conducted in accordance with the guidelines for animal experiments of the European Union Directives and the permission obtained from the Ministry of Agriculture and the Environment of the Republic of Slovenia (Permission No. 34401-3/2012/2), which was given based on the approval of the National Ethics Committee for Experiments on Laboratory Animals.
Magnetic Resonance Imaging of Tumor Samples and Calculation of ADC and T2
Magnetic resonance microscopy experiments were performed on a high-spatial resolution MR scanner consisting of a 9.4 Tesla (400 MHz proton frequency) vertical bore super-conducting magnet (Jastec, Tokyo, Japan) equipped with a Bruker Micro2.5 gradient system (Bruker, Ettlingen, Germany) and by a Tecmag Redstone spectrometer (Tecmag, Houston, Texas). Tumor samples in glass tubes were inserted into a 10-mm-diameter microimaging probe and then scanned by a protocol consisting of the 3-D T 1-weighetd spin-echo imaging sequence for obtaining high-resolution anatomical image of the tumor followed by sequences for ADC and T 2 mapping. The sequences were the 3-D DWI sequence based on the pulsed-gradient spin-echo (PGSE) sequence for ADC mapping and the 3-D multispin-echo imaging sequence based on the Carr-Purcell-Meiboom-Gill (CPMG) multiecho train for T 2 mapping. 21 The imaging parameters of the applied MR sequences are given in Table 1. During scanning, the samples were kept at a constant temperature of 20°C ± 1°C (Table 1).
The acquired MRI data were analyzed by using in-house written MR image analysis software, developed within the Matlab programming environment (MathWorks, Inc, Natick Massachusetts). In the software, fully automated MR image segmentation was performed as follows. First, for each tumor sample, a 3-D set of DW images with b = 0 was used to create a mask for automatic discrimination of the tumor region from the hypointense background as described by Vidmar et al.
22
The hyperintense regions were considered as the sample regions with the corresponding mask value set to unity, while the hypointense regions were considered as background with the corresponding mask value set to zero. For each tumor sample, the same mask was used to calculate the maps of ADC and of transversal relaxation time T
2. Specifically, ADC maps were calculated in a pixelwise manner by fitting the Stejskal-Tanner relation,
23
[
Histology of Tumors
The tumor samples were taken from zinc fixative and embedded to paraffin blocks. The blocks were then cut into consecutive sections with thickness of 2 μm through each tumor in orientations that represented best match to the orientations of the acquired MR images (presented in the orientation of the highest in-plane resolution). Orientation matching was enabled by tumor tagging prior to MRI. To estimate the percent of necrosis, every fifth section was stained with hematoxylin and eosin (HE), others were used for IHC staining of hypoxia marker HIF-1α. This study was conducted as a proof of principle and therefore HIF-1α staining was selected due to already optimized staining procedure and good experience from previous studies—the hypoxia level of related B16F10 control tumors was estimated only to 4.7% when stained for HIF-1α. 25 The primary antibodies against HIF-1α (ab2185; Abcam, Cambridge, Massachusetts) were applied at dilution 1:500 and then detected with a peroxidase-conjugated streptavidin-biotin system (Rabbit specific horseradish-peroxidase-diaminobenzidine [HRP/DAB] detection IHC kit, ab64261; Abcam) and counterstained with hematoxylin as described previously. 25 Each tumor was analyzed in 2 central HIF-1α-stained sections with the best match to the corresponding MR slices. The sections were analyzed in 10 randomly distributed regions per section that uniformly covered all of the tumor’s characteristic regions. From the regions, images of 300 × 400 µm2 were captured by a BX-51 microscope (Olympus, Hamburg, Germany) under 40× magnification (numerical aperture 0.85) using a DP72 CCD camera (Olympus). Hypoxic regions, that is, HL, was assessed by 3 independent researchers on the acquired images. Only the cells with brown-colored nucleus were considered hypoxic.
Correlation Analysis Between ADC and T2 Maps and HL
First, in each of the IHC slices, 10 randomly distributed ROIs with a size of 300 × 400 µm2 that uniformly covered all characteristic regions of the tumor excluding regions of stroma or tissue with an increased cellularity were selected and average HL values for the selected ROIs were calculated. Then, for each tumor sample, 2 central adjacent MRI slices that corresponded best to the histological slices of the same tumor were selected. Magnetic resonance maps of the selected slices were upscaled to matrix 768 × 384 using bilinear interpolation, and for each of the maps, up to 10 ROIs with the best match to the corresponding ROIs in histological slices were selected, that is, colocalization between ROIs in MR maps and IHC slices was performed. In the MR maps, the selected ROIs corresponded to regions of 12 × 16 pixels. In the next step, average ADC and T 2 values from the selected ROIs were calculated. Thus, N = 94 measured ADC and T 2 values of the tumors were obtained that were then further analyzed for their correlation with the corresponding HL values using Pearson correlation test.
Predictive Models for HL
Simple predictive models based on the multiple linear regression analysis of the measured HL (dependent variable) and ADC and T 2 (independent variables) data were obtained. The models included both independent variables (3-parameter model) or just ADC (2-parameter model). The regression analysis was performed with the OriginPro program (OriginLab Corporation, Northampton, Massachusetts).
Results
The histological analyses of tumors indicated heterogeneous composition of the studied tumors; predominately there were proliferative cells, some hypoxic and necrotic regions, few fat cells, as well as muscle and connective fibers. Such composition can be seen in Figure 1A that shows a histological (HE stained) image of a central slice across a representative B16F1 murine melanoma tumor. The image in Figure 1B from the neighboring slice of the same tumor is HIF-1α antibody stained to enable determination of HL for each of the selected ROIs. However, the determination is possible when the image is inspected under 40× magnification so that the structure of individual cells can be clearly seen. Images in Figure 1C correspond to 3 different characteristic regions of the tumor analyzed by ROIs with the size of 300 × 400 µm2 in identical positions in HE-stained (right) and HIF-1α-stained (left) images. The regions correspond to a viable tumor part (region 1), connective tissue (region 2), and necrosis (region 3). Viable tumor cells have intact cell nuclei that color in blue in the HIF-1α-stained images, while cell nuclei of hypoxic tumor cells color in brown in the same image. This is because the nuclei of hypoxic cells are altered by having present the transcription factor HIF-1α. The corresponding proportions of the altered cells against all cells in ROI were considered as HLs (Figure 1).

A histologically analyzed B16F1 murine melanoma tumors. Hematoxylin and eosin staining (A) and IHC detection of HIF-1α marker (B) indicated on a several tumor parts. Scale bar = 1 mm. Different tumor parts (C) were further analyzed under 40× magnification (scale bar = 100 µm) with HE (C, left) and hypoxia-inducable factor 1-alpha (C, right). The tumor sections represented viable tumor part (1), connective tissue (2), and necrosis (3). The positive hypoxic cells have brown-colored nucleus. HE indicates hematoxylin and eosin; IHC, immunohistochemistry.
Corresponding tumor slices, which were analyzed by IHC for determination of HL, were firstly scanned by MRI with a protocol consisting of T 1-weighted imaging and ADC and T 2 mapping. Figure 2 shows an example of the images obtained for the same tumor and slice as shown in Figure 1. The T 1-weighted image in Figure 2A indicates tumor anatomy; however, it does not offer much information on its structural and functional properties. For providing these, MR maps are much more appropriate. The highest sensitivity to structural changes associated with hypoxia can be seen in the ADC map (Figure 2B), which has relatively uniform low ADC background with values less than 0.8 µm2/ms. In the hypoxic region, it can increase substantially and can go up to 2 µm2/ms, which is almost ADC of bulk water. Differences among grades of tissue hypoxia are less pronounced in the T 2 map (Figure 2C), where the increase of T 2 values in the hypoxic region in comparison to the nonhypoxic tissue background is close to 50%, that is, from approximately 40 milliseconds to up to 60 milliseconds or even more (Figure 2).
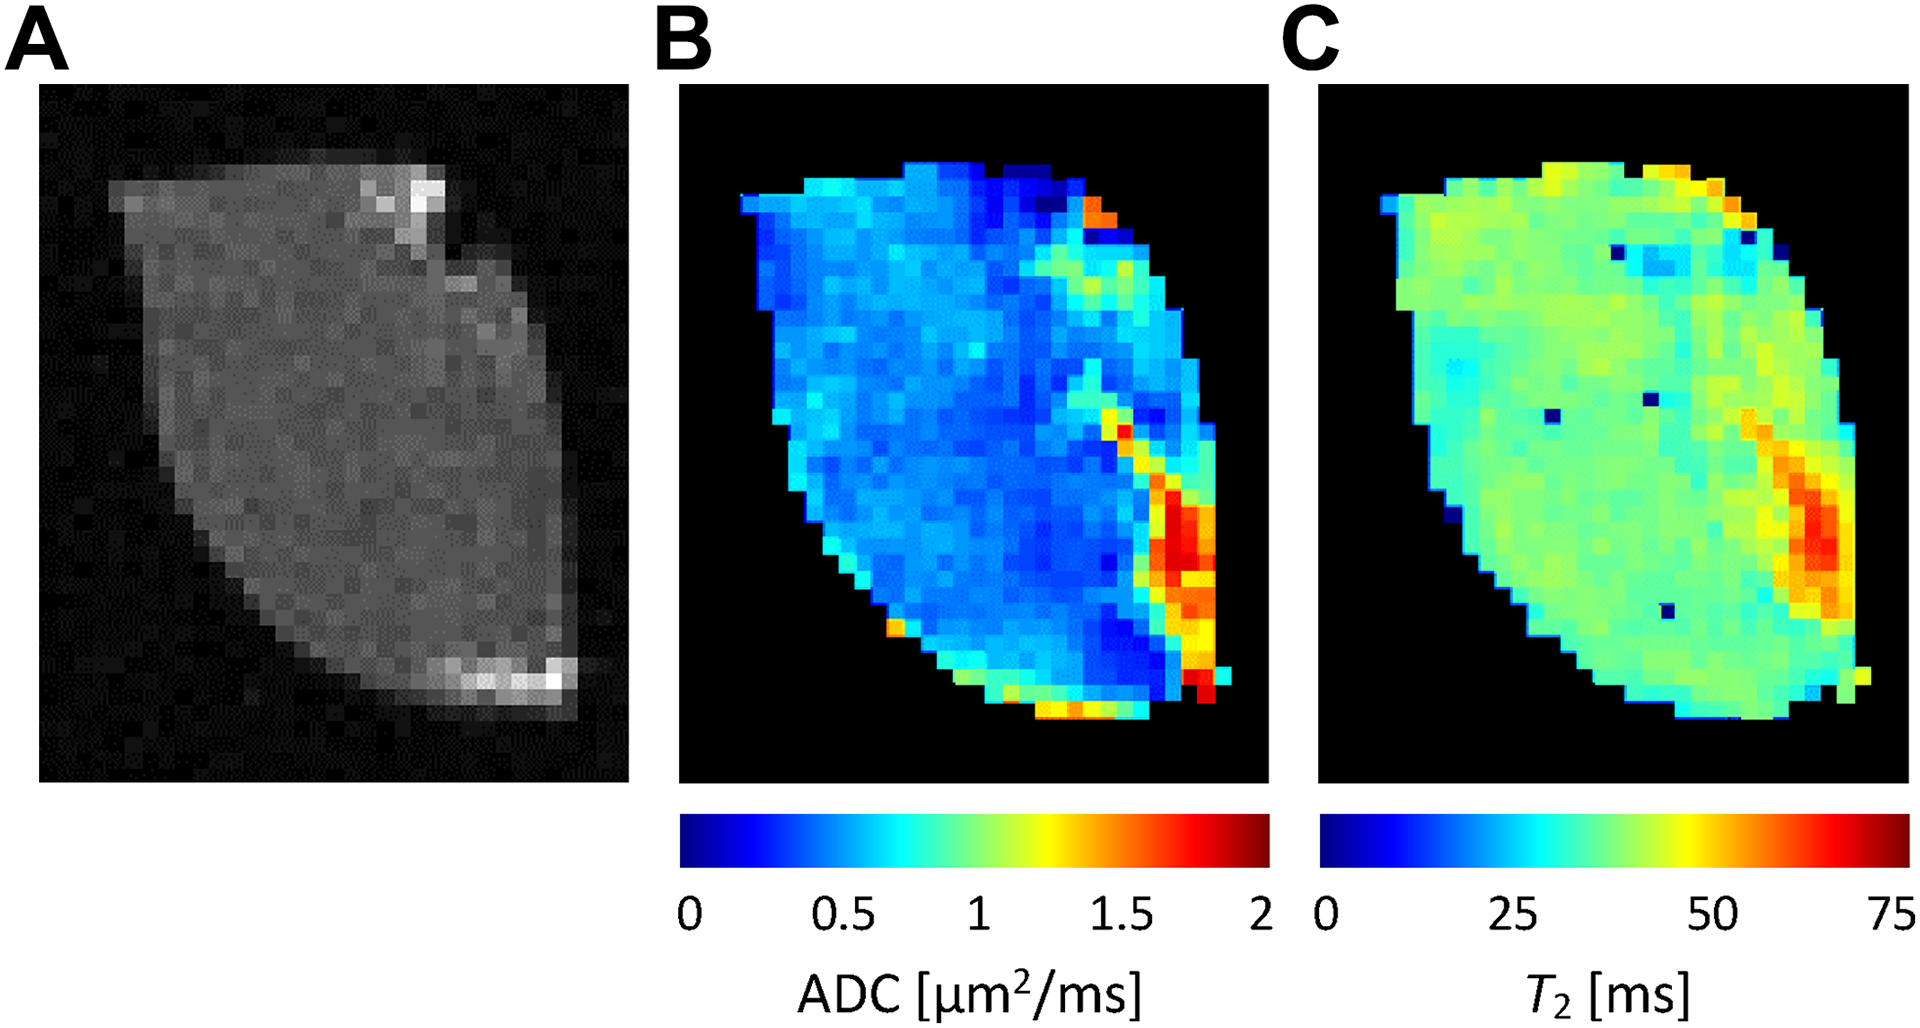
T 1-weighted image (A) and MR maps of ADC (B) and T 2 (C) values of the same tumor and slice as shown in Figure 1. Among all maps, the ADC map exhibited the largest variability of its values that well correlate with hypoxia; high ADC values were found in the region that coincides with the hypoxic region in Figure 1. Less pronounced correlation with hypoxia was observed for T 2 values. ADC indicates apparent diffusion coefficient; MR, magnetic resonance.
Correlations between the measured HL values and the corresponding ADC and T 2 values, as obtained from the selected ROIs of all the tumors, are shown in the graphs in Figure 3. It can be seen that the correlation is higher between HL and ADC (Person correlation coefficient; ρ = 0.56, P < .00001) than between HL and T 2 (ρ = 0.38, P < .00001). Dashed lines in the graphs in Figure 3 correspond to trend lines obtained by linear regression, which are given by equations: ADC = 0.010 µm2/ms/% HL + 0.50 µm2/ms (coefficient of determination R 2 = 0.31) and T 2 = 0.12 ms/% HL + 36 µm2/ms (R 2 = 0.14). From the graphs it can also be seen that most measured data points (pairs of HL and the corresponding values of ADC and T 2) were obtained with low HL values and fewer with high HL values. This can be explained by a domination of tumors of smaller volumes that were still well oxygenized at the excision time (Figure 3).
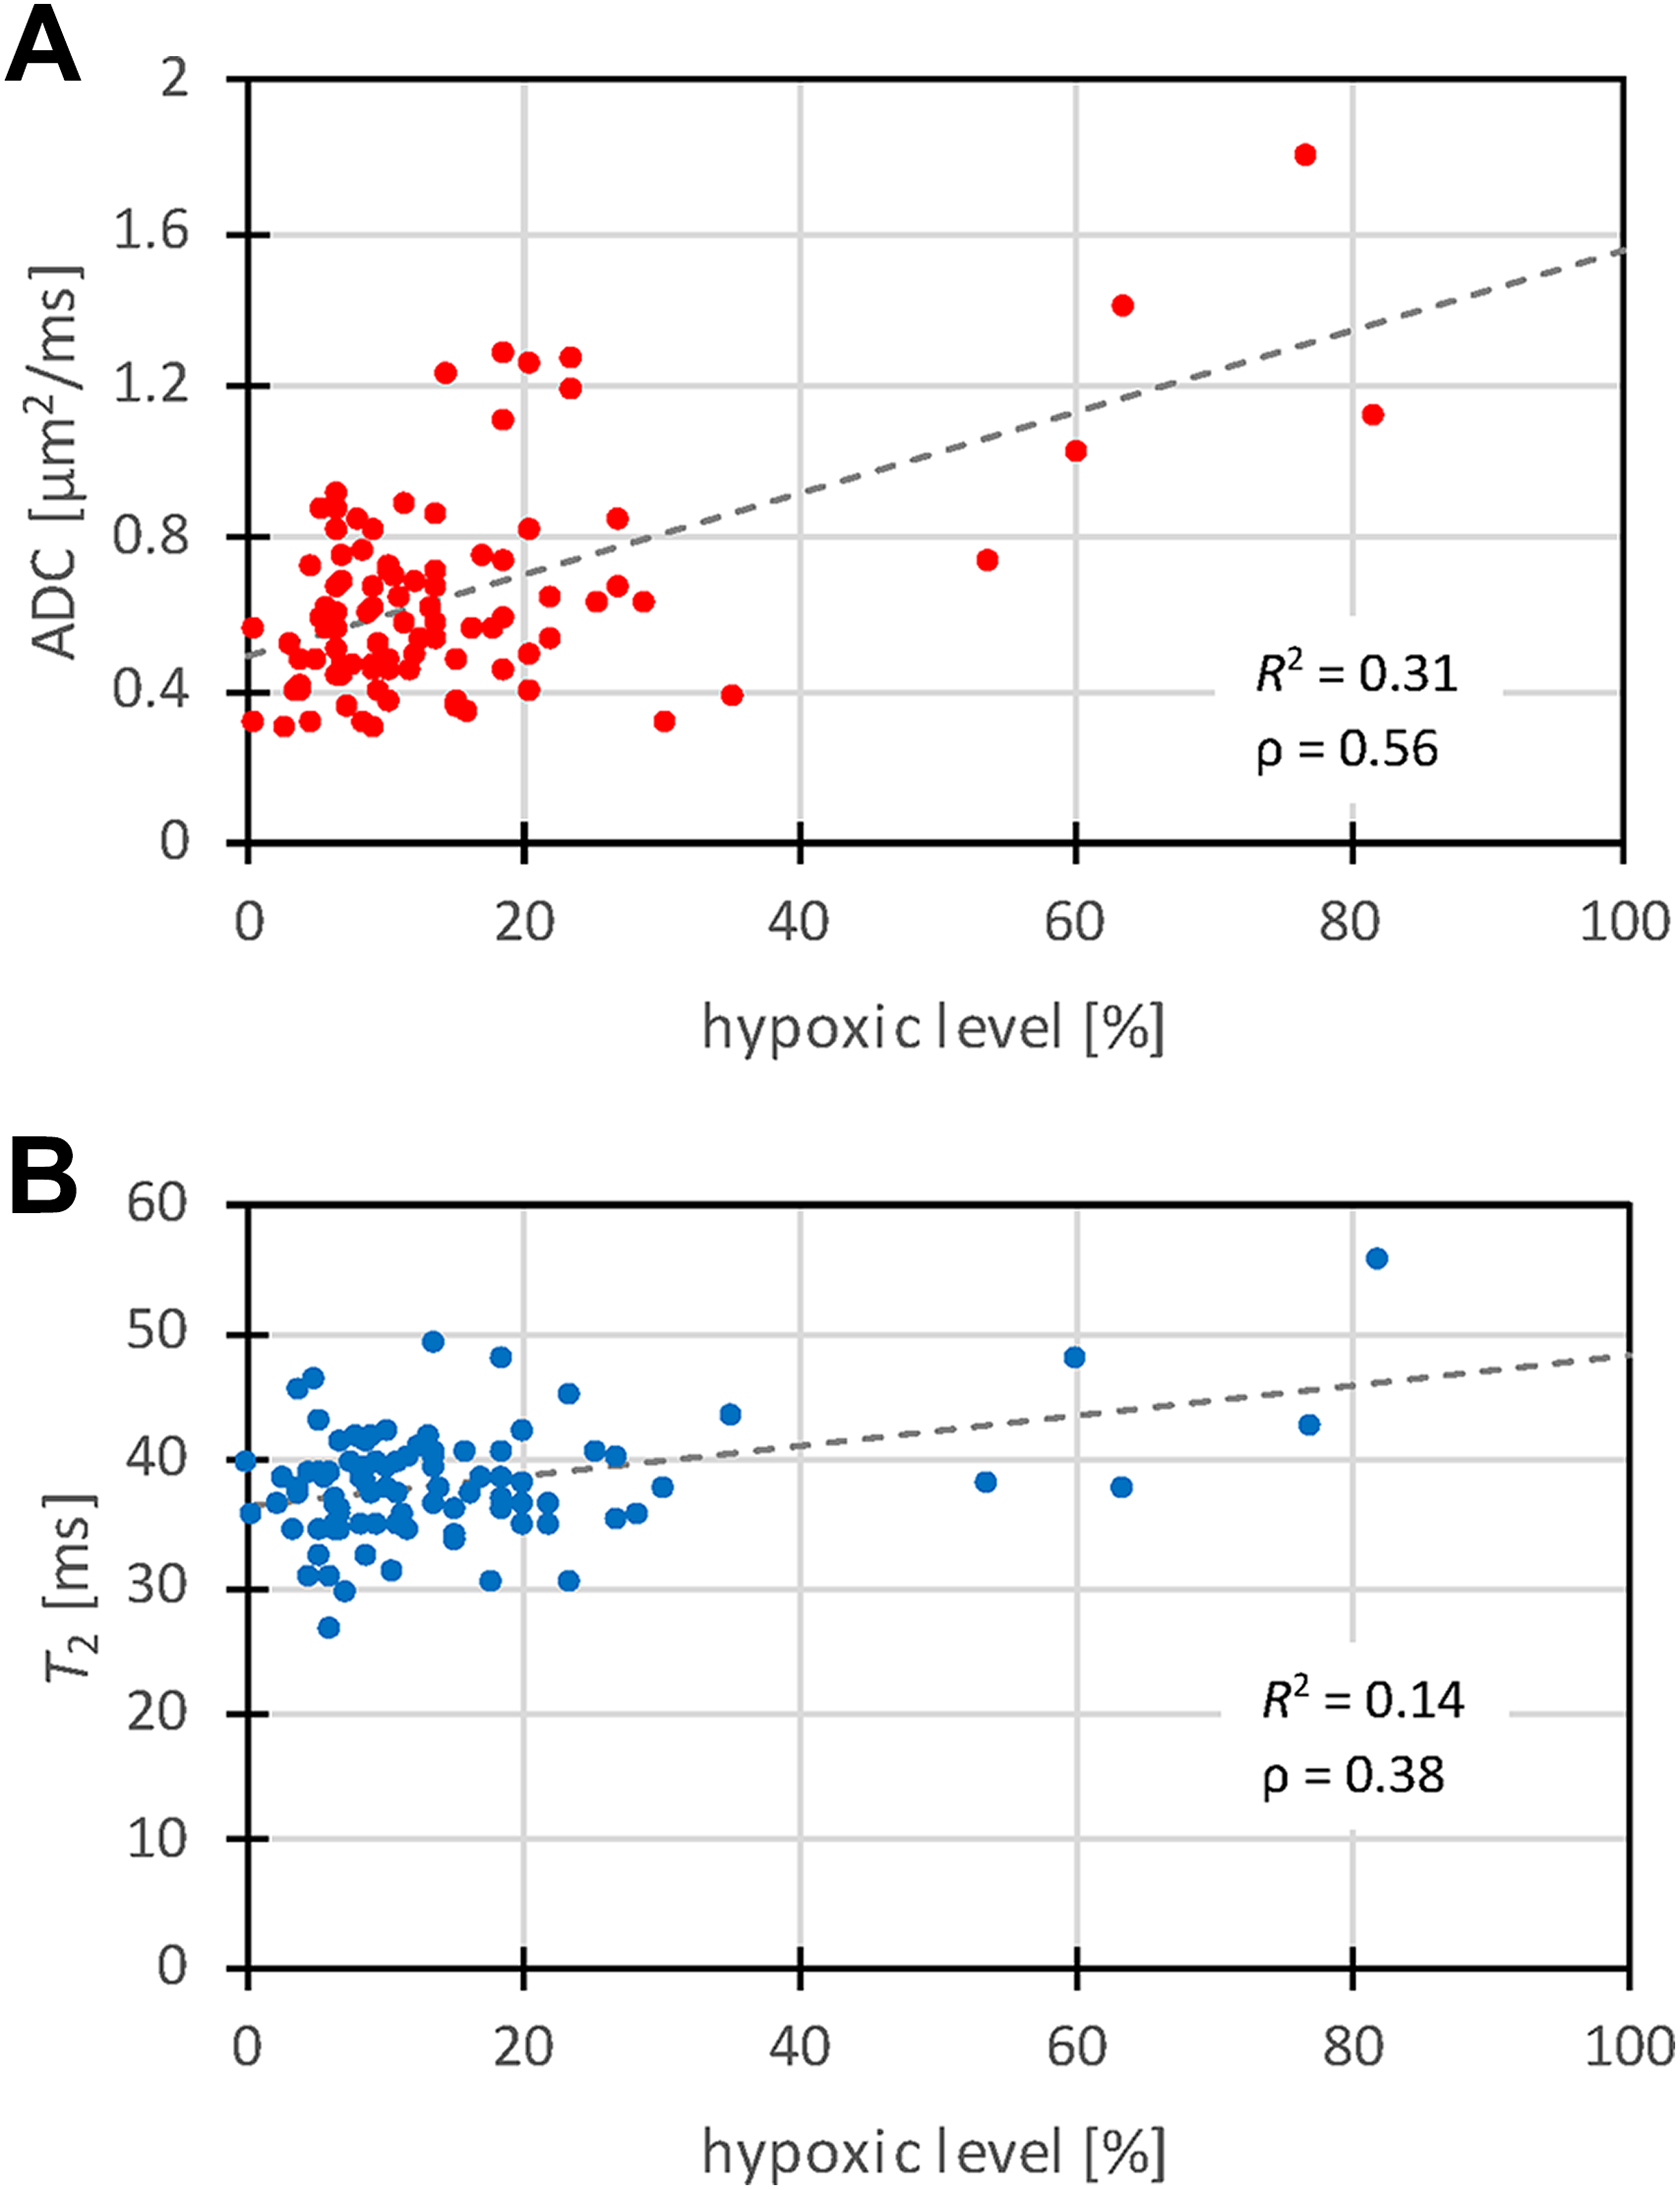
Graphs of correlation between hypoxic level and the corresponding ADC (a) and T 2 (b) values as measured from the selected ROIs for all tumors (N = 94). The correlation is higher between HL and ADC than between HL and T 2. Dashed lines in the graphs correspond to trend lines. ADC indicates apparent diffusion coefficient; HL, hypoxic level; ROI, region of interest.
Two different multiple linear regression models for HL prediction were fitted to the data: 3-parameter model with independent variables ADC and T 2 and 2-parameter model with the independent variable ADC. The best fit model parameters are shown in Table 2. From the table it can be seen that the 3-parameter model has a better quality of the fit (R 2 = 0.36) than the 2-parameter model (R 2 = 0.31). The graph in Figure 4 depicts correlation between the measured HL and the predicted HL with the 3-parameter model. The error of the prediction is ΔHL = 11.7%, while the correlation coefficient between the measured and the predicted HL values is equal to ρ = 0.60, P < .00001. The dashed line in the graph represents a line of the ideal correlation (ρ = 1; Figure 4).
Best Fit Model Parameters.

Abbreviations: ADC, apparent diffusion coefficient; HL, hypoxic level.
a Three-parameter model HL = k ADC ADC + k T2 T 2 + b.
b Two-parameter model HL = k ADC ADC + b.
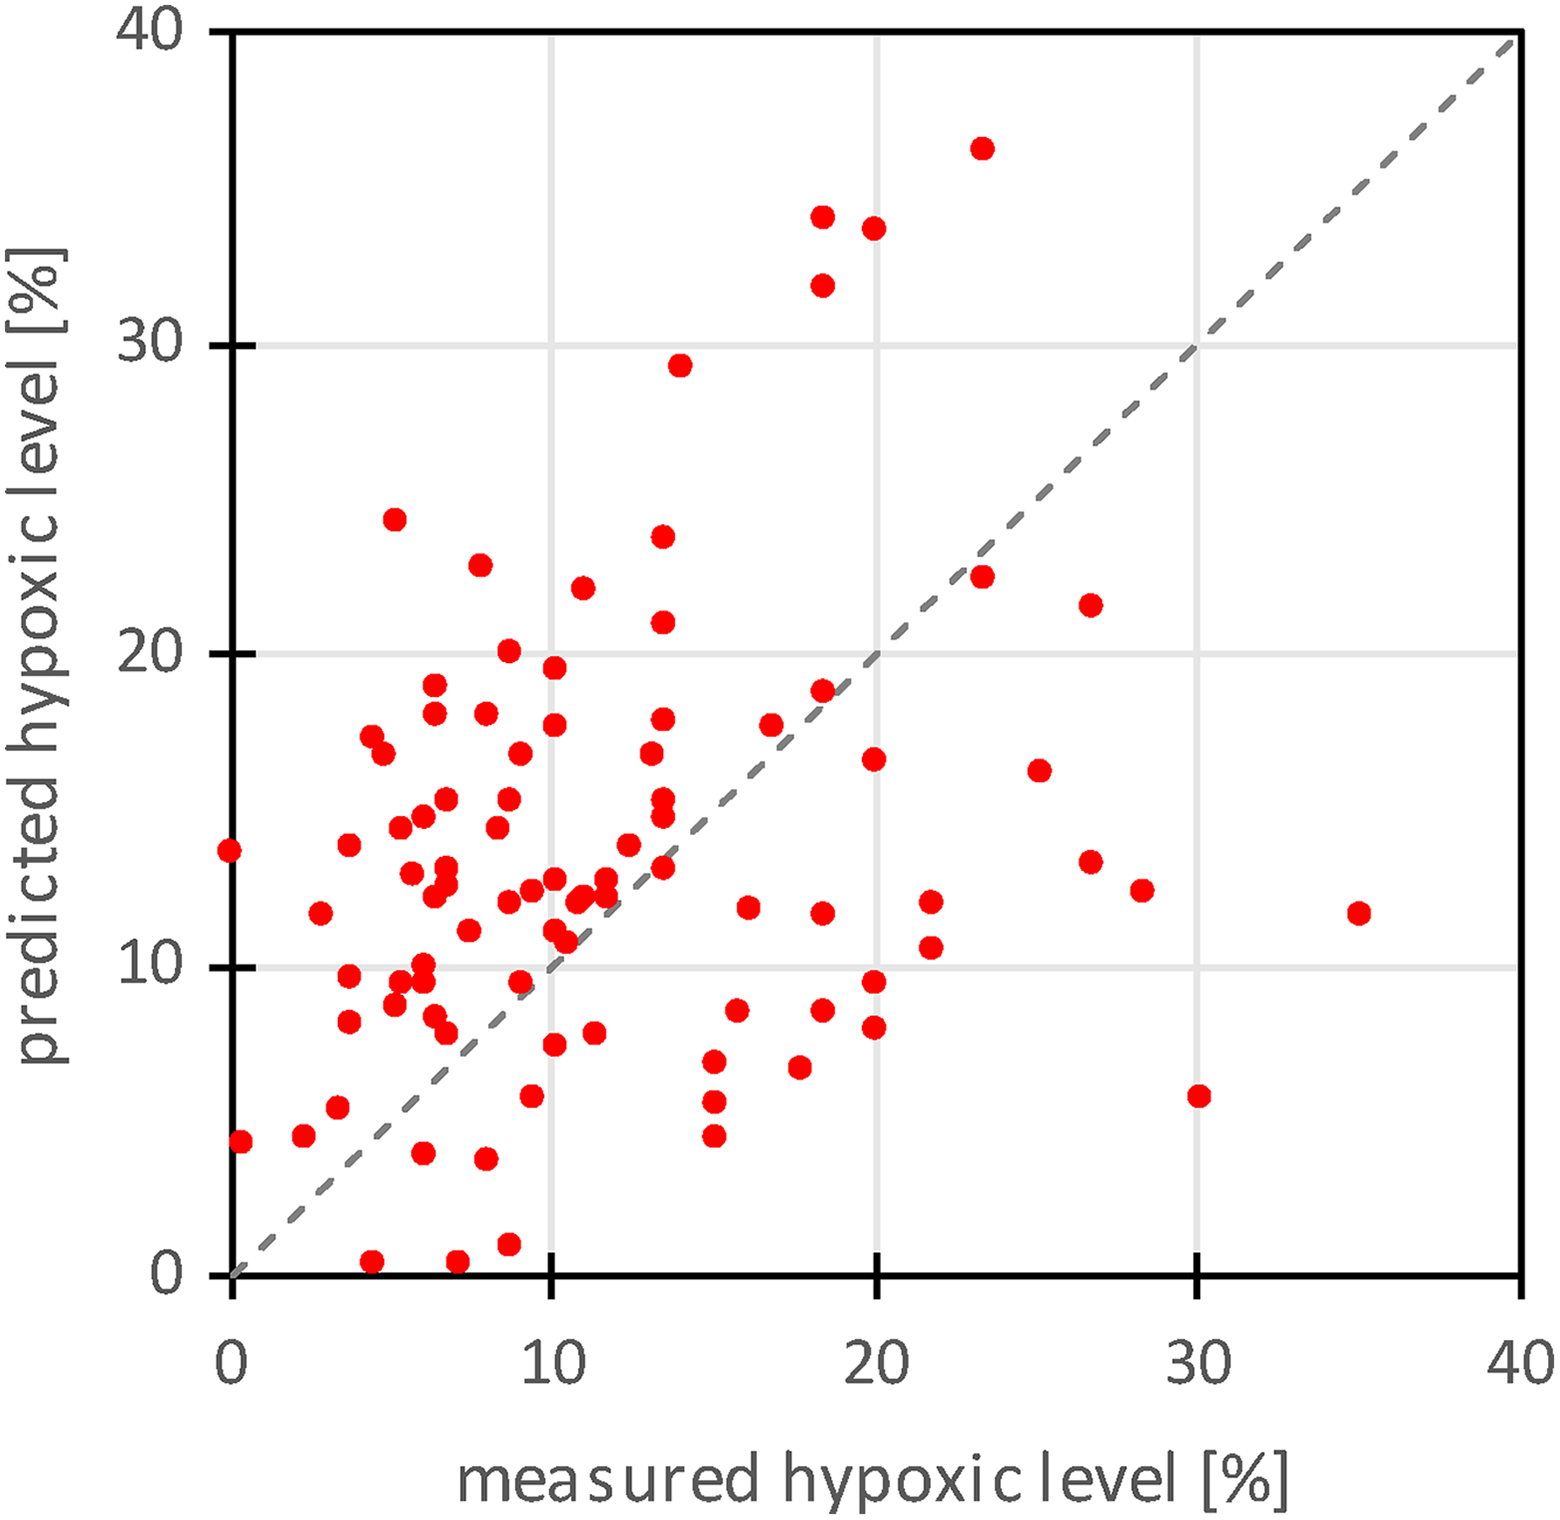
A graph of correlation between the measured hypoxic level (HL) and the predicted HL using the 3-parameter model that required measurement of ADC and T 2 maps. Dashed line in the graph represents a line of ideal correlation (ρ = 1). ADC indicates apparent diffusion coefficient.
Figure 5 depicts a map of predicted HL for the tumor and slice from Figure 2. The map was calculated from the corresponding ADC and T 2 maps by using the 3-parameter model for HL prediction (Table 2). Comparison of the map with the ADC and T 2 map shows identical region of an increased signal, however with a much responsive function to changes of ADC and T 2. In the HL map, there is a bigger difference between the signal in the hypoxic region and the nonhypoxic background than in the corresponding ADC and T 2 maps (Table 2; Figure 5).

A predicted map of HL as obtained from ADC and T 2 maps by using the 3-parameter model for the same tumor and slice as shown in Figure 2. ADC indicates apparent diffusion coefficient.
Discussion
The aim of our study was to find a possible correlation between immunohistochemically determined HL in tumors and standard MR maps (ADC and T 2). This study was motivated by the studies where ADC mapping was found as an efficient marker for the integrity of tumor cellularity 17,18 ; however, a correlation between HL and ADC or other standard MR maps was not analyzed. The study was performed on murine melanoma tumors B16F1 of different sizes that were not subjected to any therapy. These tumors are highly proliferative and they were excised when their volumes were still small (up to 100 mm3) and were therefore still well oxygenated. Due to this fact, the level of hypoxia was in average low, especially in the viable tumor parts. Therefore, the study could be expanded to larger tumors with more hypoxia in the future. The higher percentage of hypoxic cells was detected in necrotic cells, prior to cell death. High predicted values for the HL were found also in nontumor connective tissues; however, these values could be inaccurate as predictive model parameters were calculated by excluding these tissues from the analysis. In the remaining tissues, the measured HL values are in accordance with different cell density and tissue structure across the tumor.
The study was performed ex vivo, that is, tumors were excised, MR scanned, and then histologically analyzed. During the analysis, the tumor tissue oxygenation was low. Therefore, the methods that can measure only current tissue oxygenation would give irrelevant results for hypoxia in live tumors. For that reason, the study was focused on the reliable and permanent markers for hypoxia. Such is the transcriptional factor for HIF-1α, which can be detected accurately after proper tissue excision and storage. HIF-1α is a tumor hypoxia marker and it’s a key regulator of cellular and developmental response. 26 Although other markers are also used for assessing hypoxic regions, such as CAIX, GLUT-1, MCT1, or pimonidazole, neither of them strongly and consistently correlates with hypoxia, but were demonstrated to colocalize in tumor sections. 27 Therefore, a combination of these markers could better predict hypoxic regions, also due to the fact that HIF-1 can also be upregulated under other stimulants. 28 Adequate markers for physiological conditions of tumors before their excision are also MRI-measurable values of ADC and T 2. Apparent diffusion coefficient is sensitive to the internal structure of the tumor in relation to the mobility of water molecules. Its value is high when the ratio between extracellular and intracellular fluid is high, so that there is a lot of free space for water molecules to diffuse freely. On the other hand, its value is low when cells are compacted, which presents restrictions for diffusive motion of water molecules. Relaxation time T 2 is sensitive to the microenvironment of the water molecules, which can be in tumor tissue considered as a porous structure. Molecules close to the surface experience an increased T 2 relaxation, due to the surface relaxation strength posed by paramagnetic centers in the cell walls, while molecules further away have T 2 relaxation of the bulk fluid. 29 Because of the effect, a tissue with compacted cells, where surface to volume ratio is high, has shorter T 2 value than the tissue with loosened cells where surface to volume ratio is lower. This effect also explains why ADC and T 2 values are in a positive correlation (which can be deduced from their positive correlation with HE in Figure 3A and B).
Results of our study are in accordance with results of a study by Moffat et al where functional diffusion maps were proposed as a biomarker for the early prediction of cancer treatment outcome. 18 It was found that in the vast part of the brain tumors treated with BCNU 9L, ADC values increased over the baseline and that the increase was dose proportional. The ADC increase was explained by the increase of the fractional volume of the interstitial space due to loss of cell membrane integrity and subsequent loss in overall cellular density. In our study, such tissue conditions are associated also with an increased HL and from there stems a positive correlation between HL and ADC, as well as between HL and T 2. However, such interpretation requires carefulness. In the same study, an opposite response to the treatment was found where ADC decreased due to the decrease in the interstitial fractional volume. This was found in some isolated tumor regions receiving lower drug doses. If HL was also increased in the tissue, then the trend for this part of the tissue would be the opposite (negative correlation between HL and ADC as well as between HL and T 2). As noted, such conditions could be expected at lower treatment doses, that is, lower ADC and HL changes. This could also explain large scattering of points at the origin of the HL and ADC, and HL and T 2 correlation plots (Figure 3A and B).
The study was not performed in vivo; therefore, ADC and T2 values of the excised tumors differ from the corresponding values that would be obtained in vivo. In a study by Fan et al, it is shown that there exists a strong correlation between in vivo and ex vivo for ADC and T 2 values of invasive tumors and that ADC values in vivo are higher than the corresponding ADC values ex vivo (mainly due to a slower diffusion at room temperature than at body temperature), while T 2 values of the tumors in vivo and ex vivo stay about the same. 30 Salinity of the suspension in which tumors were stored during MRI scanning could also influence the measured ADC based on the osmotic processes that result in the change of the ratio between intra- and extracellular water. Another limitation of the study is also a relatively low number of the analyzed sample points (94 points in 6 different tumors) with its associated use of the same data set for model development and its validation. Another possible source of error in the ROI-based measurement as opposed to the volumetric approach is bias introduced by difficulties in finding optimal match between ROIs selected in MRI and histological images. A disadvantage of the study design is also in inability of measuring tumor tissue oxygenation by other already established MRI methods, such as OE-MRI or DCE-MRI. 12,13 However, the ex vivo study design has also advantages. One is that the tumors were scanned longer and therefore at a higher spatial resolution. This in return enabled comparative examination of the tumors by ADC or T 2 MR mapping and HIF-1α histology in multiple points per sample; in the study, each tumor was examined in up to 20 points corresponding to different tumor characteristic structures. In most similar studies done in vivo, the examined tumors were studied as a whole, that is, each tumor in just 1 point representing its average properties. 19
This ex vivo study can serve as a proof of concept that ADC and T 2 maps of tumors can be used as markers for tumor hypoxia. Similar ADC- and T 2-based prediction models for tumor hypoxia to these presented in this study can be done also for other tumors in vivo. In addition, ADC and T 2 mapping sequences are standard of care and are available on most clinical MRI scanners, which makes the prediction models easily transferable to clinical environment. Accurate prediction models can be of significant clinical relevance as they can be used to evaluate therapeutic outcomes. In cancer research, they are important also as a tool for studying the role of hypoxia in cancer treatment or they could have impact on studying other medical phenomena as well.
Conclusion
A simple, yet efficient 3-parameter linear prediction model for prognosis of HL in tumors is presented. Input parameters for the model are ADC and T 2 maps that were found relevant for the prognosis. Based on the model, a map of HL can be calculated. The presented approach can be translated to other tumors in vivo so that the corresponding models could help in assessment of tumor treatment and to better understand the role of hypoxia in cancer progression.
Footnotes
Acknowledgments
The authors thank Ana Sepe for providing technical assistance for the study.
Declaration of Conflicting Interests
The author(s) declared no potential conflicts of interest with respect to the research, authorship, and/or publication of this article.
Funding
The author(s) disclosed receipt of the following financial support for the research, authorship, and/or publication of this article: This work was supported by the Slovenian Research Agency grant P3-0003 (Development and evaluation of new approaches to cancer treatment).