
Abstract
We used a shifted-excitation Raman difference spectroscopy method for the ex vivo classification of resected and formalin-fixed breast tissue samples as normal (healthy) tissue, fibroadenoma, or invasive carcinoma. We analyzed 8 tissue samples containing invasive carcinoma that were surrounded by normal tissue and 3 tissue samples with fibroadenoma only. We made various measurement sites on various tissue samples, in total 240 measurements for each type of tissue. Although the acquired raw spectra contain enough information to clearly differentiate between normal and tumor (fibroadenoma and invasive carcinoma) tissue, the differentiation between fibroadenoma and invasive carcinoma was possible only after the shifted-excitation Raman difference spectroscopy isolation of pure Raman spectra from the heavily fluorescence interfered raw spectra. We used 784 and 785 nm as excitation wavelengths for the shifted-excitation Raman difference spectroscopy method. The differences in the obtained pure Raman spectra are assigned to the different chemical compositions of normal breast tissue, fibroadenoma, and invasive breast carcinoma. Principal component analysis and linear discriminant analysis showed excellent classification results in the Raman shift range between 1000 and 1800 cm−1. Invasive breast carcinoma was identified with 99.15% sensitivity, and the absence of invasive carcinoma was identified with 90.40% specificity. Tumor tissue in tumor-containing tissue was identified with 100% sensitivity, and the absence of tumor in no-tumor containing tissue was identified with 100% specificity. As gold standard for the determination of the sensitivity and the specificity, we considered the conventional histopathological classification. In summary, shifted-excitation Raman difference spectroscopy could be potentially very useful to support histopathological diagnosis in breast pathology.
Keywords
Introduction
Breast cancer is one of the most frequent cancers worldwide. Each year 1.38 million new cases are detected while 458 000 people die from this cause. 1 Breast tumors can be detected and localized using different well-established noninvasive methods such as ultrasound, mammography, computer tomography, magnetic resonance imaging, and positron emission tomography. 1 –3 Nevertheless, invasive biopsy and a subsequent histopathological analysis is required for the classification of the tumor as benign or malign. 1 Furthermore, the boundaries between normal breast parenchyma and malignant tumors from resected tissues need extensive histopathologic analysis from many locations in order to define resection status, and thus, it is time consuming. Evidently, this shows the importance of developing fast and objective methods for the diagnosis of breast tumors. The formation of tumor significantly changes the structure and composition of tissue, such as the content of carbohydrates, lipids, proteins, and nucleic acids. 4 These changes occur even before the clinical symptoms emerge. 4
Biological material such as proteins, carbohydrates, lipids, nucleic acids, and DNA feature different molecular structures 5 with this different Raman spectra. 6 –8 Thus, the composition of biological tissues can be identified based on their Raman spectrum. 9 When any physiological change or pathological process changes the biochemistry of the tissue, this leads to a change in its Raman spectrum. 10 This provides the potential for classifying diseases, such as breast tumors, in the early stage.
Manoharan et al 11 investigated breast tissues using near-infrared (NIR) Raman spectroscopy. They stated that the Raman spectrum of normal tissue is governed by lipid bands, whereas the spectrum of the malign tissue is governed by protein bands. While normal cells store their energy in the form of lipids, pathological cells synthesize large amounts of protein for the modulation and maintenance of cellular activities of their uncontrolled growth. 12 By assigning Raman signal peaks or bands to molecular vibrations, they confirmed the histopathologically derived knowledge that the majority of the proteins in the tumor is collagen.
Li et al 4 discovered that the raw Raman spectra of normal breast tissue feature clearly detectable Raman signal peaks, while the spectra of tumors, irrespective of whether they are malignant or benign, are dominated by a strong and broadband autofluorescence interference, which makes the identification of Raman signal peaks challenging. The fluorescence increase in the tumor tissue may be related to the generation of precursors of fluorescent compounds during the depletion of lipids. 13
Haka et al 14 demonstrated that Raman spectroscopy is a promising new tool for real-time diagnosis of breast tissue abnormalities. By applying a diagnostic model based on fit coefficients for collagen and fat, they differentiated between normal tissue and malign and benign tumors.
Various techniques based on Raman scattering such as conventional NIR Raman spectroscopy, 15 –20 surface-enhanced Raman spectroscopy (SERS), 1,2,21,22 and resonance Raman spectroscopy 13,23,24 have been used to analyze breast tumors. They all have in common that they are optimized to the enhancement of the desired Raman signals with respect to the undesired autofluorescence interferences or to the suppression or attenuation of the undesired autofluorescence interferences. Conventional Raman spectroscopy gives optimal performance for the characterization of breast tissues at excitation wavelength in the NIR spectral region 25 because of the relatively low excitation of the autofluorescence background. Nevertheless, the undesired fluorescence background still interferes with the desired Raman signals, especially in the spectra acquired from tumor tissues. The purification of the Raman spectra from the autofluorescence interfered spectra using mathematical baseline correction methods 26 –28 bears the risk of not only eliminating the interfering fluorescence but also eliminating or influencing Raman signatures.
Resonance Raman spectroscopy is a variant of conventional Raman spectroscopy that involves the careful selection of the excitation laser energy to nearly coincide with an electronic transition of the target molecule. As a consequence, the detection limits and measurement times can be significantly decreased. 29 However, only the resonantly excited transitions can be probed, which makes multispecies detection and tissue composition analysis challenging.
Surface-enhanced Raman spectroscopy is another variant of Raman spectroscopy that features especially a high sensitivity. Here, a material, usually metallic nanoparticles, that supports the enhancement of the Raman signal coming from the molecules in the proximity of its surface has to be added to the probed sample. 30,31 Applying SERS, Vargas-Obieta et al 1 reported a strong Raman signal enhancement and the differentiation between patients with breast cancer and healthy patients with high sensitivity and specificity. Biocompatible and nontoxic nanoparticles have been developed, which allow SERS to become applicable in an in vivo setting. 32,33 However, the signal enhancement depends on several factors including the properties of the metal, the shape and size of the nanoparticle, and the excitation wavelength. Thus, SERS requires an intensive sample preparation and a complex experimental setup.
We here applied shifted-excitation Raman difference spectroscopy (SERDS) for the purification of Raman signals from heavily fluorescence-interfered spectra of invasive breast carcinoma (malignant breast tumors) and fibroadenoma (benign breast tumors). To the best of our knowledge, this is the first report of using SERDS for breast tumor identification. This technique has been established as a useful tool for applying Raman spectroscopy to samples with strong fluorescence interference. 34 –36 Shreve et al 34 were the first to propose the SERDS technique for fluorescence rejection. It is based on Kasha rule 37 that the fluorescence signal is nearly insensitive to small photon energy excitation changes in contrast to the Raman spectrum, which shifts according to the excitation photon energy change. Thus, subtracting 2 raw spectra, each one excited with a slightly different photon energy, enables the elimination of the fluorescence background, while a Raman difference spectrum remains. da Silva Martins et al 38 described SERDS as a very systematic and reproducible method for the elimination of undesired fluorescence interferences. The SERDS technique is very effective, as it does neither require any kind of sample preparation nor a complex experimental setup and is capable of eliminating both, fluorescence interferences and systematic noise from spectra. 39 The charm of the SERDS technique is that the fluorescence is eliminated mainly because of physical approach. Thus, in contrast to purely mathematical-based baseline correction approaches, it does not affect the Raman features of the spectrum.
Materials and Methods
Sample
Spectra were collected from resected formalin-fixed samples of invasive breast carcinoma, fibroadenoma, and normal breast tissues. The formalin fixation does not interfere with the tissue analysis using Raman spectroscopy, 40 as it will be demonstrated also in the results section of this article. A total of 11 breast tissue samples were obtained from female patients undergoing breast cancer diagnosis at the Department of Gynaecology and Obstetrics at the Institute of Pathology, University Hospital Erlangen.
The 11 breast tumor samples included 3 fibroadenoma and 8 invasive breast carcinoma. The study protocol was approved by the Ethics Committee of University Hospital Erlangen (178_16 Bc). Figure 1 shows resected formalin-fixed breast tissue samples of an invasive carcinoma surrounded by healthy tissue at the top and a fibroadenoma tumor at the bottom.

Illustration of breast tissue samples. Invasive carcinoma (top) including healthy safety margin and fibroademona (bottom).
Experimental Setup
Figure 2 shows the setup of the self-developed Raman sensor. A diode laser (Toptica DLpro, Munich, Germany) with a variable laser wavelength tunable between 770 and 810 nm, and a linewidth of <500 kHz was used as the excitation light source. The excitation beam is launched into a glass fiber, which guides the laser radiation to a Raman probe. Inside the Raman probe, a short pass filter (785 nm cutoff wavelength) suppresses wavelengths longer than 785 nm originating from fiber–light interactions when the excitation light passes through the glass fiber. The excitation laser beam is then reflected via a dichroic mirror, which is highly reflective for the excitation wavelength but transparent for wavelengths longer than 785 nm. It is then focused through a lens onto the sample with a focal spot diameter of approximately 200 μm. A portion of the excited signals (these are mainly elastic light scattering signals, fluorescence, and the desired Raman signals) is detected in back-scattering direction through the same lens. The red-shifted fluorescence and Raman signals pass the dichroic mirror toward another lens focusing them onto a detection glass fiber bundle guiding the signals from the Raman probe to the spectrometer (Ventana from Ocean Optics, Largo, Florida). The elastic light scattering signals are filtered out, first, by the dichroic mirror reflecting them toward the excitation glass fiber and, second, by a long pass filter mounted between the dichroic mirror and the signal focusing lens. The Ventana spectrometer analyzes the spectra between 800 and 940 nm, which corresponds to Raman shifts from 200 to 2000 cm−1. The spectral resolution is specified at 810 nm to be 10 cm−1. At 810 nm, a wavenumber difference of 10 cm−1 corresponds to approximately 0.6 nm. Therefore, signals with a wavelength difference of minimum 0.6 nm can be spectrally resolved as 2 different peaks. With 1024 pixels along the spectral axis of the detector, one pixel corresponds to approximately 0.137 nm (∼2.44 cm−1), which is below the spectral resolution.

Custom-built, compact, and portable Raman sensor consisting of a tunable diode laser, a fiber-coupled spectrometer and Raman probe.
Three combined and electrically driven linear translation stages (NRT150 from Thorlabs, Newton, New Jersey) were used to move the handheld Raman probe to selected points on the sample in the xyz-space. The 3-dimensional (3D) coordinates of a selected measurement point on the sample were provided by a 3D visualization system (Ensenso N10 stereo camera). This combination of translation stages and 3D camera made the subsequent detection of Raman spectra from many different measurement points on the tissue sample efficient.
Measurement Procedure
From each of the 8 tissue samples containing an invasive carcinoma, 30 measurement points were selected in the region of the invasive carcinoma, and another 30 measurement points were selected in the healthy tissue safety margin surrounding the carcinoma. From each of the 3 fibroadenoma samples, 80 measurement points were selected. A minimum distance of 1 mm was maintained between the selected measurement points on each tissue sample, which is more than 4 times the focal spot size of the laser. Thus, in summary, Raman spectra of invasive carcinoma were obtained from 240 measurement points (30 points × 8 patients), Raman spectra of healthy tissue were also obtained from 240 measurement points (30 points × 8 patients), and Raman spectra of fibroadenoma were obtained from 240 measurement points (80 points × 3 patients). The visual selection of the measurement points was confirmed by a responsible surgeon from the Institute of Pathology of the University Hospital of Erlangen.
At each of the selected measurement points, first 50 spectra were acquired using the excitation wavelength 784 nm. The acquisition of 1 spectrum took 300 milliseconds, and the acquisition of 50 spectra took consequently 15 seconds. Then, the excitation wavelength was automatically shifted to 785 nm, and from the same measurement point another 50 spectra were recorded. For both excitation wavelengths, the mean spectra were computed. Afterward the same procedure was repeated at the next measurement point to which the Raman probe moved automatically. For the elimination of the interfering fluorescence background from the acquired spectra according to the SERDS method, the computed mean spectra were used.
Data Analysis
The extraction of pure Raman spectra from heavily fluorescence interfered spectra according to the SERDS method is described by Gebrekidan et al 41 in detail. It is described here briefly. We used simulated Gaussian peaks and a simulated fluorescence background to illustrate the SERDS method diagrammatically in Figure 3. Through a slight shift in the excitation wavelength, 2 different mean spectra are acquired. The 2 mean spectra, one for each excitation wavelength (784 and 785 nm), are first z score normalized to bring the similarity of the 2 fluorescence contributions closer to the Kasha rule, which states that the fluorescence emission is unaltered for a small change in the excitation photon energy, while the Raman spectrum shifts according to the excitation photon energy change as mimed in Figure 3A. Then, 1 of the 2 z score normalized mean spectra is subtracted from the other one, that is, signal “b” subtracted from signal “a” in Figure 3A. As the fluorescence background is supposed to be not influenced by the excitation wavelength, the majority of the fluorescence background is eliminated by this subtraction via a physical approach. On the contrary, the spectral position of the Raman peaks is a function of the excitation wavelength (excitation photon energy). Ideally, the subtraction would result in a pure Raman-difference spectrum. However, due to photo bleaching, in practice, the resulting difference spectrum, as shown in Figure 3B (blue line), still contains fluorescence residuals. The residual fluorescence interference, which compared to the original fluorescence levels is orders of magnitude less, is eliminated further following mathematical approaches. First, the center of the difference spectrum is identified using an asymmetric least squares fit which is illustrated in Figure 3B (red line). It is then subtracted from the difference spectrum (signal “c” minus signal “d” in Figure 3B) to give a center-corrected difference spectrum shown in Figure 3B (black line). Figure 3C (blue line) shows a spectrum reconstructed from the center-corrected difference spectrum using a mathematical recurrence relation. The obtained reconstructed spectrum still contains a weak fluorescence background which is eliminated further by applying a baseline correction based on piecewise asymmetric least squares fitting that is illustrated in Figure 3C (red line). Finally, a pure Raman spectrum is obtained as shown in Figure 3D. Automatic acquisition of spectra from selected measurement points and subsequent extraction of pure Raman spectra following the SERDS method were performed using an in-house developed software application in LABVIEW 2014 graphical programming language.

Illustration of efficient isolation of Raman spectrum from extreme fluorescence interference.
In order to distinguish between healthy breast tissue, fibroadenoma, and invasive carcinoma based on their purified Raman spectra, we implemented a multiclass linear discriminant analysis (LDA) 42 using in-house written scripts in the MATLAB programming environment (MathWorks, Inc., Natick, Massachusetts). In order to improve the performance of LDA, we performed a dimensionality reduction in the Raman spectra based on principal component analysis (PCA). 43 The PCA transforms the original data set into a new data set with transformed variables (principal components) that are linear combinations of the original variables. The principal components are arranged such that the variability of the original data set is contained in descending order in the first principal components.
We performed the differentiation between the different types of breast tissues by dividing the data set into training and test data sets in an iteration loop based on the leave-one-out cross validation. In each cross-validation iteration, 10 of the 11 tissue samples (training data set) were used to train the PCA/LDA classifier. For the 11th tissue sample (test data set), the probability to belong to the class “invasive breast carcinoma,” “fibroadenoma,” or “healthy tissue” was predicted using the previously trained PCA/LDA classifier. The optimal number of principal components that resulted in the minimum classification error is selected in each iteration loop.
Results and Discussions
Figure 4A shows typical mean raw spectra acquired from normal breast tissue, fibroadenoma, and invasive breast carcinoma using 785 nm as excitation wavelength. Although one clearly can see the Raman peaks in the raw mean spectrum acquired from the normal tissue, the Raman signatures are not visible in the raw mean spectra acquired from the fibroadenoma or the invasive carcinoma. The spectra of fibroadenoma and invasive carcinoma are dominated by the extremely strong autofluorescence and look very similar. Therefore, a differentiation between normal breast tissue and tumor breast tissue, irrespective of whether it is fibroadenoma or invasive carcinoma, can be based solely on the very different appearance of their raw spectra. 13,14 For the differentiation between the 2 different tumor tissues, fibroademona and invasive carcinoma, the pure Raman spectrum, which contains the desired and valuable information about the chemical composition of the tissue, has to be refined from the interfering fluorescence background. We here follow the SERDS approach as described and motivated earlier.

A, Mean raw spectra acquired from the 3 different breast tissue sites, normal (broken black line), fibroadenoma (solid black line), and invasive breast carcinoma (solid gray line) using 785 nm excitation wavelength. B, Reconstructed mean Raman spectrum of fibroadenoma (dashed black line), invasive carcinoma (dotted black line), and normal tissue (solid black line) together with standard deviation (shaded gray area).
Figure 4B shows as lines the mean SERDS reconstructed Raman spectra of fibroadenoma, invasive breast carcinoma, and normal tissue that were averaged from the 240 measurements made per tissue type. The gray background shows the standard deviation of the 240 measurements. Due to the relatively small fluorescence interference in the raw mean spectra of normal tissue, also the standard deviation of the reconstructed Raman spectra of the normal tissue is relatively small.
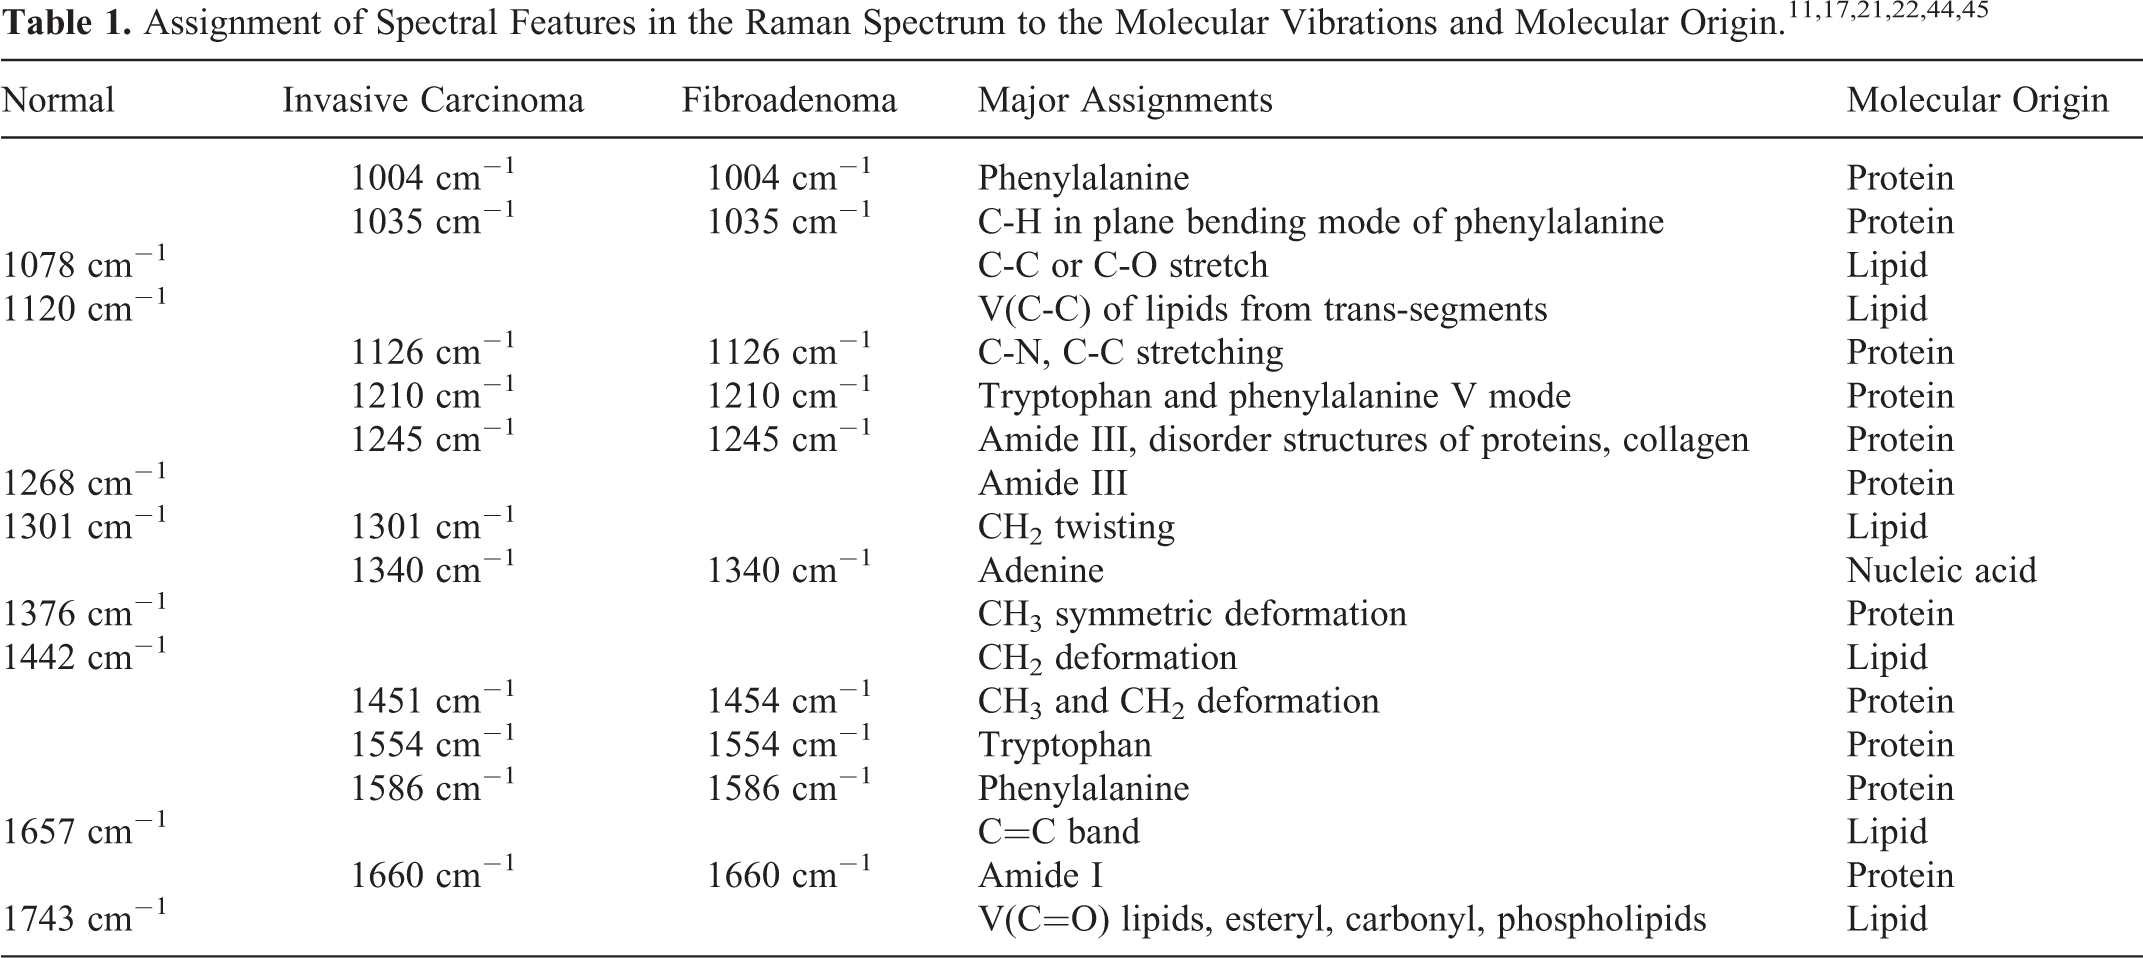
Figure 5A compares the mean reconstructed Raman spectra of normal tissue (blue line), invasive breast carcinoma (red line), and fibroadenoma (black line) and assigns to the Raman signatures of their molecular origin. 11,17,21,22,44,45 Additionally, the Raman spectrum of the fixation liquid formalin is provided as gray line. Figure 5B shows in the form of a difference spectrum where the main differences between the Raman spectra of fibroadenoma and an invasive breast carcinoma can be found. Table 1 in detail assigns the Raman signatures to the respective molecular vibrations.
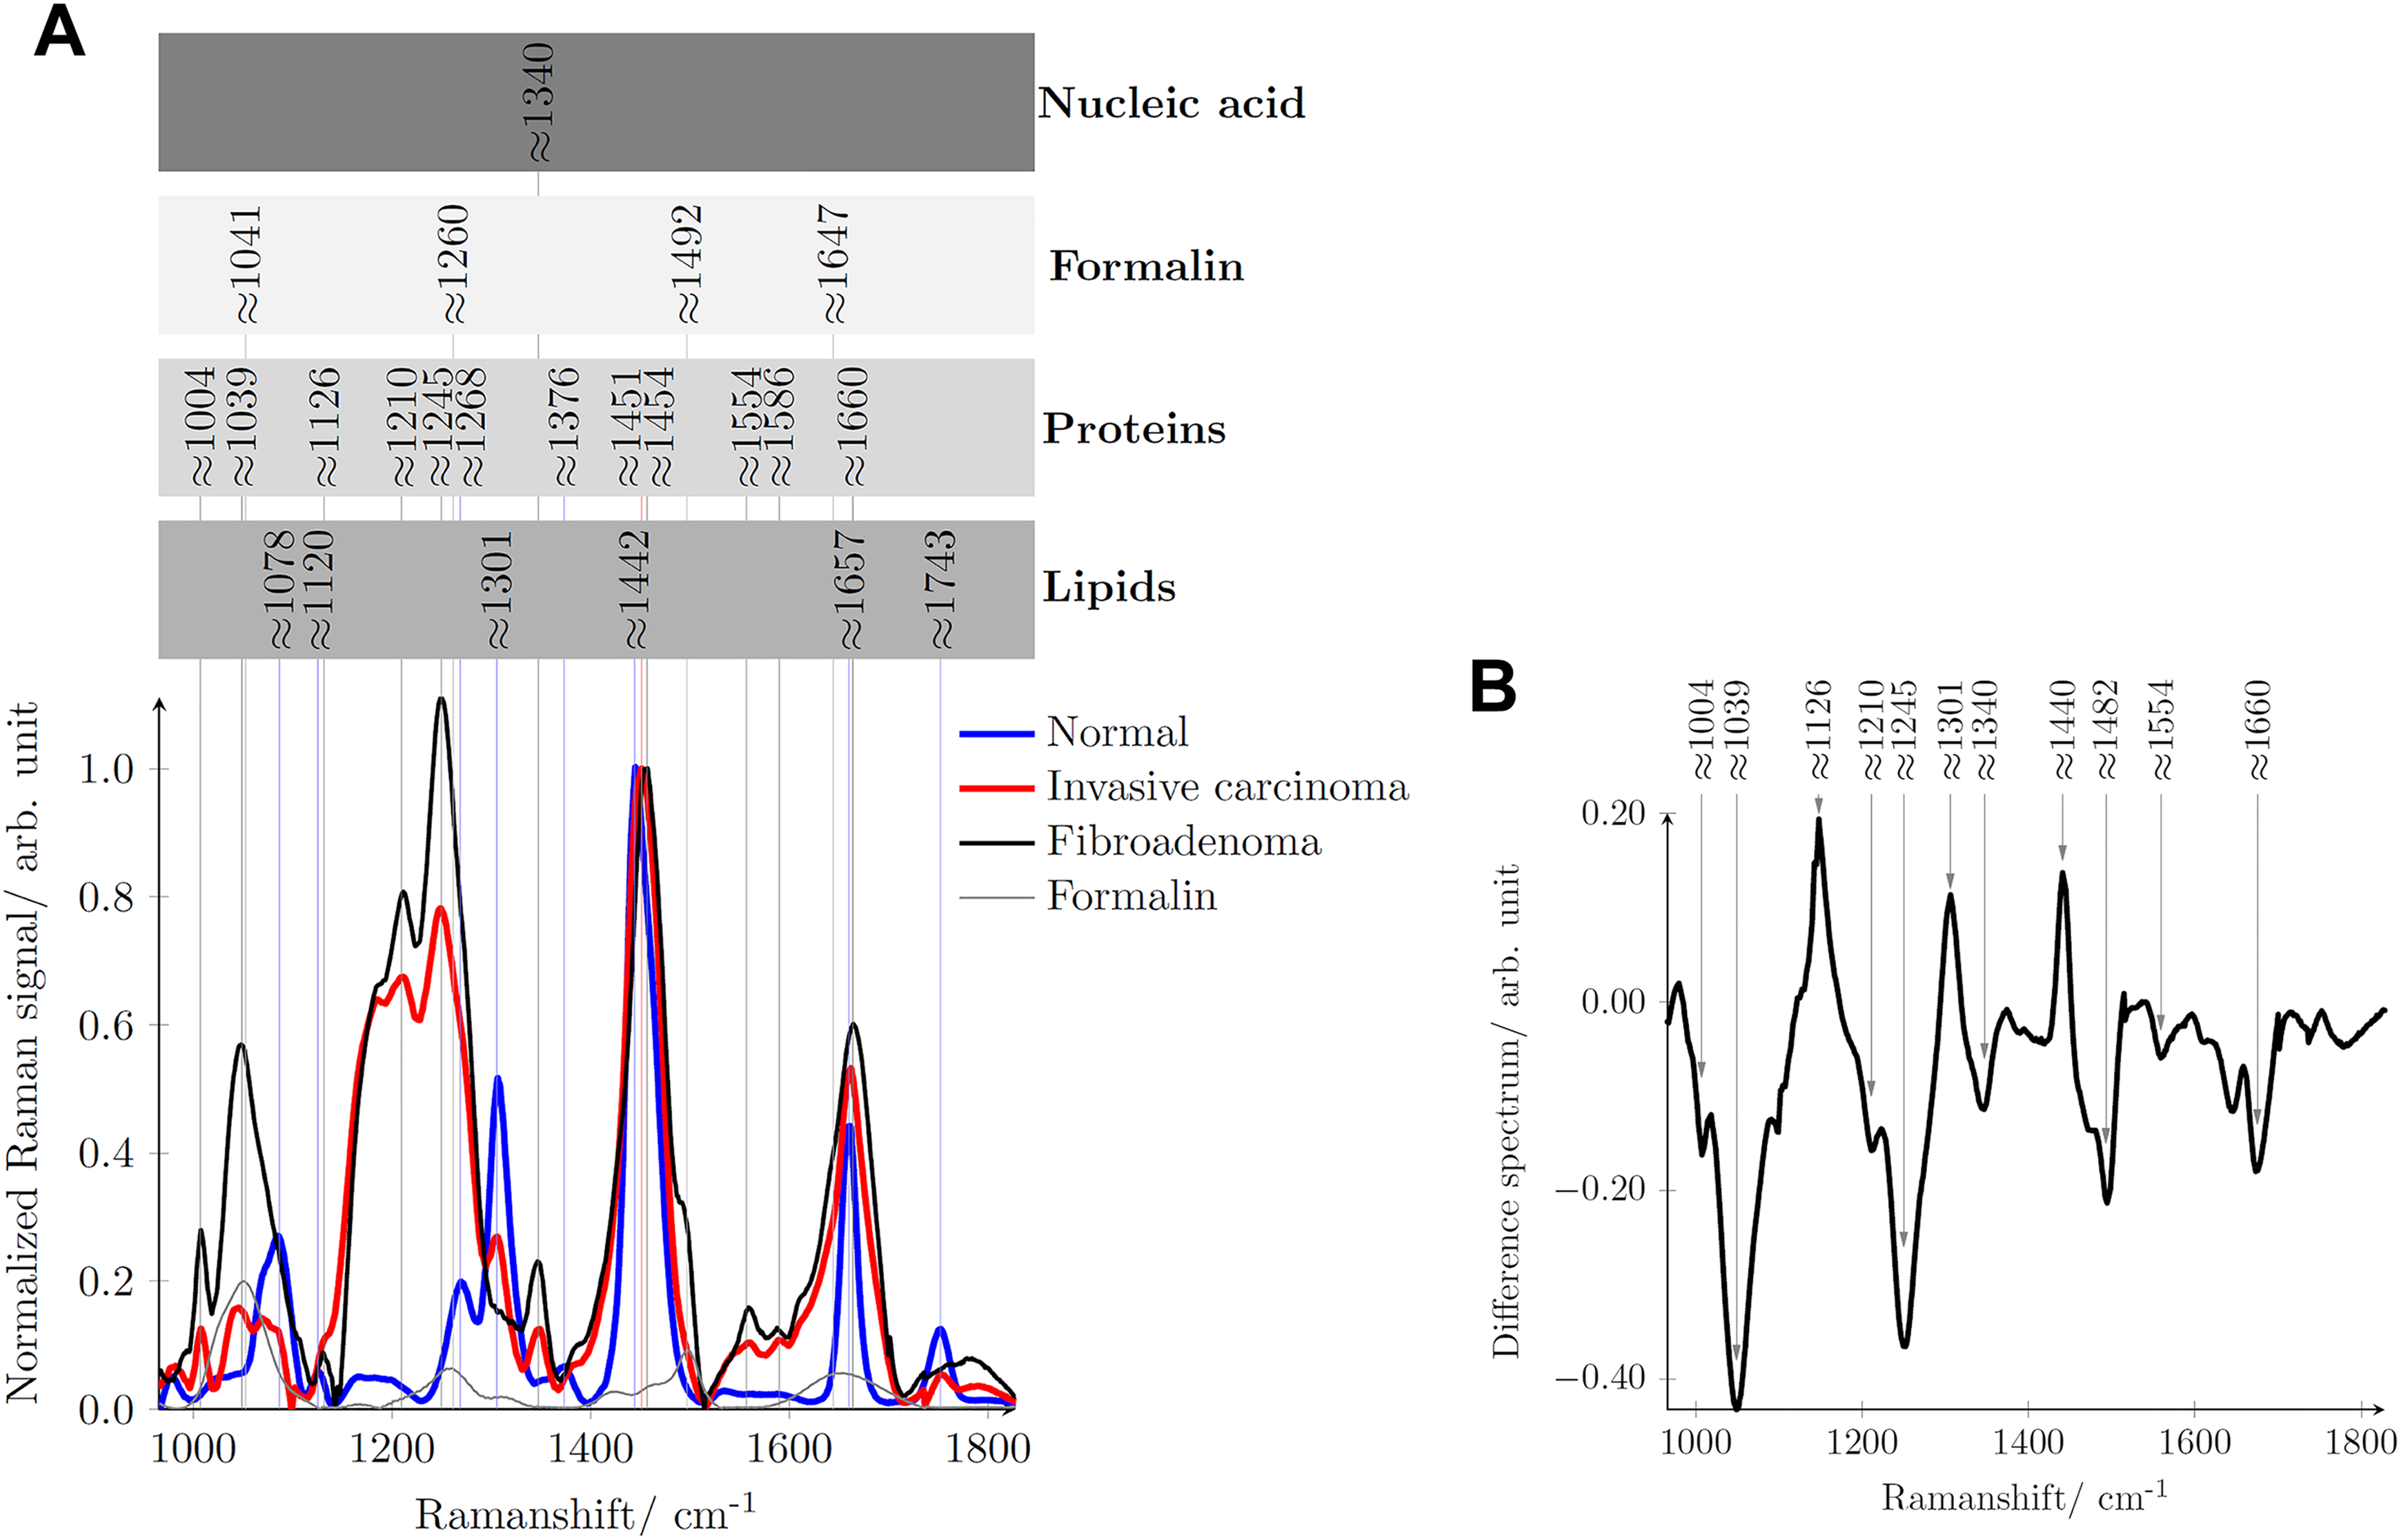
A, Mean reconstructed Raman spectrum of normal tissue (blue line), invasive carcinoma (red line), fibroadenoma (black line), and formalin (thin gray line) with peak position assignment to their respective molecular origin. B, Difference spectrum when the mean Raman spectrum of fibroadenoma is subtracted from the mean Raman spectrum of invasive breast carcinoma.
The majority of the Raman bands/peaks of the normal tissue originate from lipids, as normal breast tissue is mainly composed of fat with only small contributions from collagen. 14 On the contrary, the majority of the spectral features of tumor tissue originates from proteins. 14
The normal tissue features strong lipid bands at 1078, 1120, 1301, 1442, 1657, and 1743 cm−1 assignable to C-C or C-O stretch vibrations, C-C vibration from trans-segments, CH2 twisting vibrations, CH2 deformation vibrations, C=C bend, and C=O vibrations of lipids. Weak protein bands at 1268 and 1374 cm−1 are visible due to amide III of proteins and CH3 deformation vibrations of protein, respectively. Tumor tissue, irrespective of whether it is a fibroadenoma or an invasive carcinoma, shows more protein Raman signatures. The characteristics peaks at 1004, 1245, 1340, 1451, and 1660 cm−1 are due to phenylalanine, amide I, nucleic acid, the CH2 bend, and amide III, respectively. The phenylalanine Raman peak due to the C-H in plane bending mode appears at around 1035 cm−1. 22,44 In our case, it appears shifted to around 1039 cm−1 probably due to the minimal interference with the largest Raman peak of formalin at around 1041 cm−1.
Considering the reconstructed Raman spectra shown in Figure 5A, several clear spectral features differentiate between normal breast tissue and tumor tissue, irrespective of whether the tumor is fibroadenoma or an invasive breast carcinoma. In normal breast tissue, the C=C band of lipids at 1657 cm−1 is sharper than the amide I band (1660 cm−1) of protein in the tumor tissue. The shift between the CH2 band of lipids and proteins around 1442 and 1451 cm−1 can also be considered as a criterion for differentiation. In contrast to the amide III band of normal breast tissue at 1268 cm−1, the tumor tissues feature a broader amide III band at 1245 cm−1. The absence of the phenylalanine (1004 cm−1) and the nucleic acid (1340 cm−1) Raman bands in the Raman spectrum of normal tissue is another criterion for classification. Moreover, the intensity of the entire Raman spectrum in the shown spectral range can be considered to differentiate between normal and tumor breast tissue.
However, the differences between the 2 tumor tissues, fibroadenoma and the invasive carcinoma, are significantly less pronounced but are made visible in the difference spectrum in Figure 5B. The negative peaks at 1004, ∼1035, 1210, 1245, 1554, and 1660 cm−1 indicate the presence of relatively more proteins in fibroadenoma than in invasive carcinoma. 15,17 Furthermore, the positive peaks indicate the presence of relatively more lipids in the invasive carcinoma than in fibroadenoma. As reported by Chowdary et al, 17 this could be due to the more stromal component in fibroadenoma tissue relative to more cellular components of invasive carcinoma tissue.
Considering the reconstructed Raman spectra shown in Figure 5A again, criteria for the differentiation between fibroadenoma and invasive carcinoma could be for example (1) the small shift of the CH3 and CH2 deformation band of protein from 1451 to 1454 cm−1 (2) or at 1301 cm−1, the lipid peak of the invasive breast carcinoma, which we did not see in the spectra of fibroadenoma.
We followed a PCA method to objectively differentiate between the different tissue types. Figure 6 shows the PCA of the 240 measurements per tissue type for the principal components 1 and 2 in a plane. The scattering of the data points, which are rectangles for normal breast tissue, circles for fibroadenoma, and triangles for invasive carcinoma visualizes the possibility of differentiating between them and the reproducibility from one measurement to another. The high concentration of rectangles in a rather small region indicates that the 240 reconstructed Raman spectra of normal breast tissue are reproducible, irrespective of measurement location on 1 tissue sample and even irrespective of the patient the tissue type came from. The clear separation of the rectangles from the triangles and from the circles indicates that the 240 reconstructed Raman spectra of normal breast tissue can clearly be separated from tumor tissue. The first principal component accounts for 72.67% of the total variance in the reconstructed Raman spectra.

Principal component analysis scores of Raman spectra of invasive breast carcinoma, fibroadenoma, and health breast tissue collected from 11 human female patients.
Figure 7 illustrates the loading plot for the first 4 principal components as a function of the Raman shift. The main contributions to the first principal component are the C-C or C-O stretch- (1078 cm−1), the CH2 twisting- (1301 cm−1), the CH2 deformation- (1442 cm−1), and the C=C band vibration of lipids (1657 cm−1) and amide III (1268 cm−1).
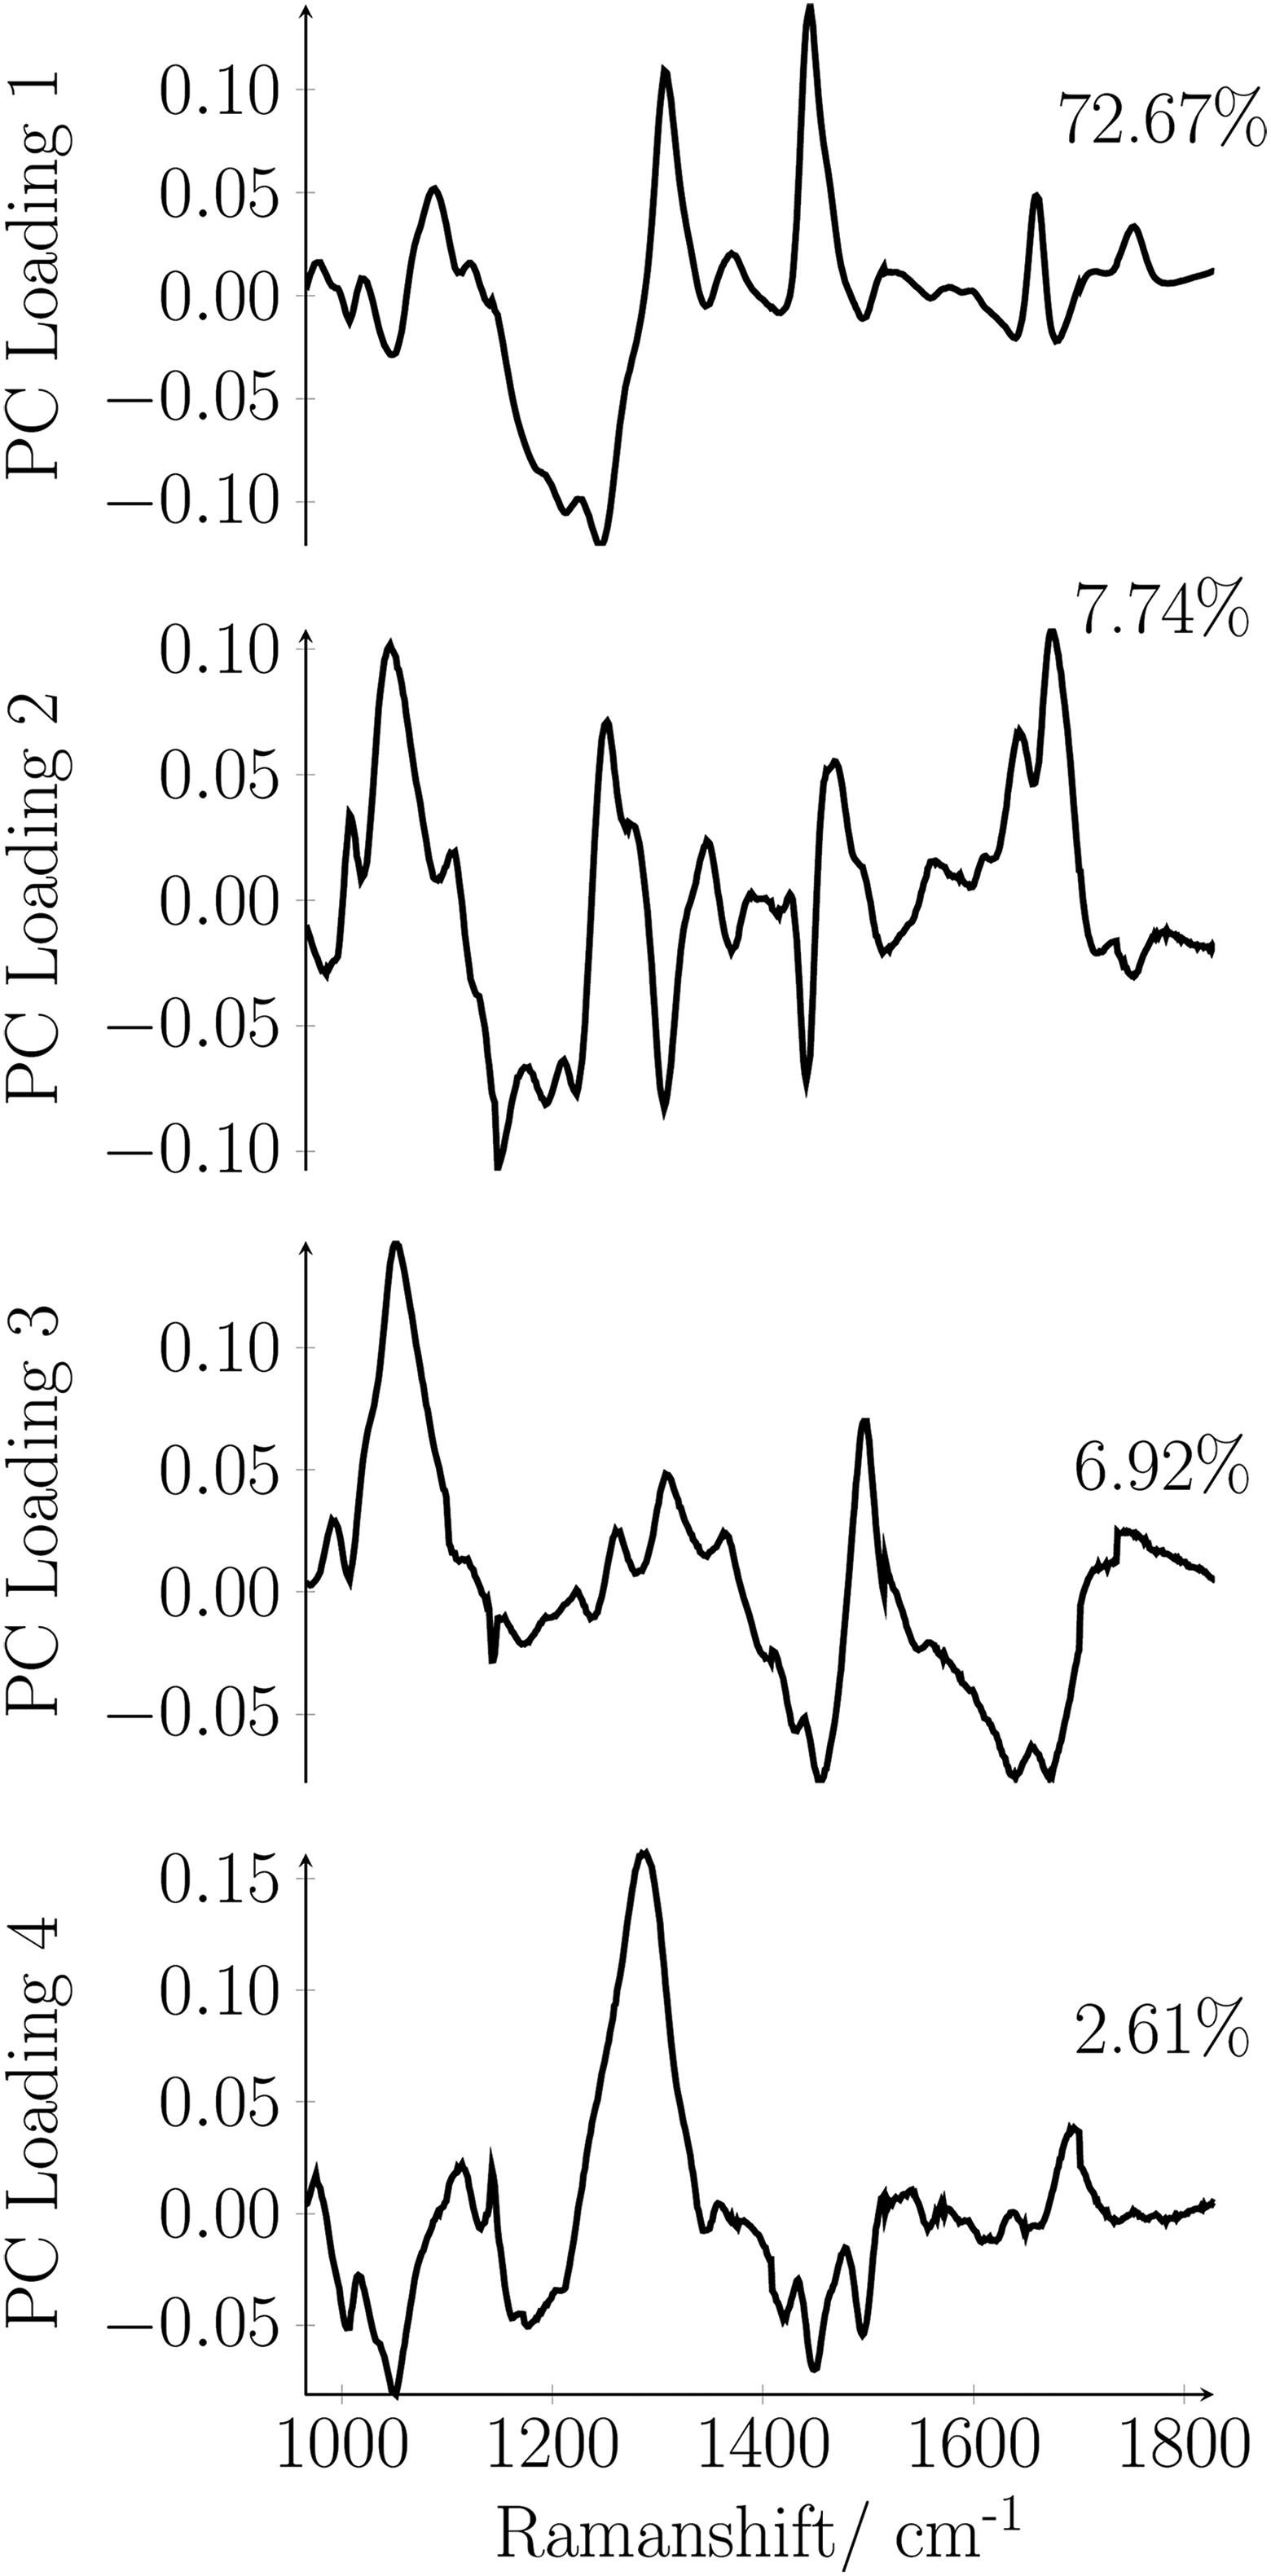
Loading plot for the first 4 principal components as a function of Raman shift.
The second principal component contains 7.74% of the spectral variation related to the vibrations of phenylalanine (1004 cm−1), the C-N or C-C stretching vibration of proteins (1126 cm−1), the amide III - (1245 cm−1), amide I - (1660 cm−1), and nucleic acid vibration (1340 cm−1). The third principal component comprises 6.92% of the data variance assignable mainly to vibrations of phenylalanine (1004 cm−1) and the CH3 and CH2 deformation vibration of proteins (1454 cm−1). The fourth principal component accounts to 2.61% of the data variance mainly assignable to amide III (1268 cm−1). The variance content of the principal components demonstrates that the differentiation between the breast tissues types is sensitive to the composition of the tissue. Figure 6 shows that based on the PCA also fibroadenoma can be differentiated efficiently from an invasive breast carcinoma. There is only a little overlap between the region comprising the triangles and the region comprising the circles. The large scatter of the 240 triangles and the 240 circles is due to (1) the worse quality of the reconstructed Raman spectra obtainable from tumor tissue (compare Figure 4B) and (2) due to the higher variation in the biochemical composition of tumor tissue. Nevertheless, the general differentiability between the 3 different tissue types with PCA confirms that the standard deviation from one measurement point to another measurement point, from sample to sample and from patient to patient, is small compared to the differences originating from a variation in the molecular composition.
Figure 8 illustrates the receiver–operating characteristic curve that explains the performance of the classifier. The normal tissue can be differentiated from the tumor tissues with zero classification error. Additionally, our results indicate a high sensitivity (true positive rate) of 99.15% for invasive breast carcinoma and a high specificity (true negative rate) of 90.40% for fibroadenoma.

Receiver–operating characteristic (ROC) curve explaining the performance of the principal component analysis (PCA)/ linear discriminant analysis (LDA) classifier, between normal and tumor tissue (blue curve, sensitivity of 100%, specificity of 100, and area under the curve [AUC] of 1), and between invasive breast carcinoma and fibroadenoma (black curve, sensitivity of 99.15%, specificity of 90.40%, and AUC = 0.9455).
Several pathology studies 4,15,17,44,45 show the predominance of lipids in normal tissues and proteins in tumor tissues. The Raman bands/peaks shown in our results in relation with their molecular origin presented in Table 1 confirm this relationship. In the study by Frank et al, breast cancer samples stored in a solution of 10% formalin with 50 mmol/L phosphate buffer (pH 6-7) were analyzed using Near-IR Raman spectroscopy. Frank et al 45 noted significant and reproducible differences between normal and tumor tissues mainly contributed due to the shift of the Raman band/peak at around 1442 cm−1 in normal tissue to around 1451 cm−1 in tumor tissues. They also reported the differences between benign and malign lesions were less obvious. Concerning the differences between the tumor tissues, our results correlate well with the studies of Chowdary et al 17 and Haka et al. 15 Chowdary et al 17 applied Raman spectroscopy to diagnose breast tissue specimens, from routine surgical resections, procured in ice-cold saline and reported very good classification of normal, benign, and malign tissues. Applying spectral deconvolution, they found the dominance of lipid bands (1301 and 1442 cm−1) in normal tissue and lowest contribution of these spectral features in fibroadenoma. Besides, they showed strong presence of protein bands (1246, 1455, and 1656 cm−1) in fibroadenoma than in invasive carcinoma which reflects our findings in Figure 5B. Similarly, Haka et al 15 confirmed the dominance of protein bands in fibroadenoma as compared to invasive carcinoma by analyzing breast tissue samples snap-frozen in liquid nitrogen. By applying a diagnostic model based on fit coefficients for collagen and fat, they showed the percentage of collagen is higher in fibroadenoma while the percentage of fat is maximal in normal tissue.
Conclusion
Our results show that invasive breast carcinoma can be differentiated from fibroadenoma with a high accuracy by isolating the “pure” Raman spectrum of the respective tissue from its heavily fluorescence interfered raw spectrum following the SERDS method. Still this method relies on the prior resection of the tissue from the patient but in principle enables fast and objective screening of the resected tissue directly in the surgery hall without any kind of sample preparation. Of course, it will not substitute the detailed histopathological analysis, which will provide the final decision on the classification of the resected tissue, but in the intraoperative surgical setting, it can provide a first indication to the surgeon whether or not the resection margins of the surgical specimen are carcinoma free.
Footnotes
Acknowledgments
The authors gratefully acknowledge funding of the Erlangen Graduate School in Advanced Optical Technologies (SAOT) by the German Research Foundation (DFG) in the framework of the German excellence initiative.
Declaration of Conflicting Interests
The author(s) declared no potential conflicts of interest with respect to the research, authorship, and/or publication of this article.
Funding
The author(s) received no financial support for the research, authorship, and/or publication of this article.