
Abstract
The thermo-stamping process of CFRTP has been widely used in aerospace and automotive applications. However, unreasonable process parameters can cause defects which affect the mechanical properties and assemblability of the workpiece. In this paper, an integrated simulation method for the CFRTP thermo-stamping process chain (including forming-cooling-demolding stage) is proposed, which tries to convey more forming history variables than the traditional method, and aims to accurately predict the forming defects and springback deformation. In detail, the material models used in the different stages are calibrated based on the material data obtained from the experiments, and non-isothermal simulations of the forming stage are performed to predict the relevant defects and to obtain information on the stress, temperature, and thickness of the workpiece after forming. Then, an cooling simulation model was constructed using the history information of the forming stage as the initial condition to obtain the molding results of the workpiece at the end of the cooling stage. Finally, the results obtained during the cooling phase are used to predict the springback of the part after demolding. The simulation method was validated by experiments on hat-shaped beam. The results show that the integrated simulation method of CFRTP process chain can accurately predict the forming results such as fiber shear angle distribution, thickness change, and springback deformation of hat-shaped beams, in which the error of the predicted value of shear angle is 4.08%, the error of the predicted value of thickness is 7.11%. The error of the predicted value of springback is 5.71%.
Keywords
Introduction
With the background of global energy challenges and the escalating demand for environmental protection, the attempt to further reduce carbon emissions and carbon footprints across various industries has been relentless. This drive has significantly propelled the widespread application and rapid advancement of lightweight materials within the automotive and aerospace sectors.1,2 In contrast to metallic materials, such as aluminum alloys and high-strength steels, continuous fiber-reinforced polymer composites (FRPs) exhibit superior specific strength and stiffness,2–4 rendering them extensively utilized in automotive and aerospace applications.5–7 However, the low processing efficiency and poor recyclability of thermoset resin matrix composite parts have limited their large-scale promotion and application in the automotive industry.8,9 Continuous fiber-reinforced thermoplastic composites (CoFRTP) have the advantages of high damage tolerance, low preservation condition requirements, short molding cycle time, suitability for automated mass production, and recyclability,10–13 which have been widely valued by academics and industries.
14
As shown in Figure 1, the steps of the CFRTP thermo-stamping process are similar to the thermo-stamping process of sheet metal, in which the prepreg is first preheated to a higher temperature. Then the sheet is transferred between the punch and die by mechanical fixtures and quickly closed, and the final part is obtained after the holding and demolding processes.15,16 CFRTP thermo-stamping Process.
Complex molding processes with multiple procedures often lead to defects such as wrinkles, springback, thickness reduction, and other defects after molding, which affect the mechanical properties and dimensional accuracy of the workpieces. Therefore, it is important to study the mechanism of defects in the molding process and improve the molding quality. A large number of scholars have made a lot of contributions to the research in this area. Schug et al. 17 used a complex mold structure to test the forming performance of UD-GF/PP material. They found that a lower closing rate and lower initial mold temperature would cause increased thickness deviation and local wrinkling of the formed part. McCool et al. 18 used the initial sheet temperature, compaction, and mold preheating temperature as the process parameters. Based on Taguchi’s method of designing experiments, it was found that changes in the preheating temperature of the sheet and the mold have a large impact on the crystallinity, surface roughness, and flexural strength of the final formed part. Harrison et al. 19 found that changes in boundary conditions during the forming process caused significant differences in the angular distribution of fibers after forming and that incorrect configuration of the boundary conditions caused a concentration of tension, leading to defects such as micro flexure in the face as well as localized areas of high shear force. Haanappel et al. 20 investigated the effect of different mold curvatures on the forming results, and molds with smaller curvatures at the fillet excesses caused non-uniform stresses there, leading to significant thickness variations. Liu et al. 21 found that different sheet heating methods and initial sheet temperatures have a greater effect on the final shape of the formed parts. Tatsuno et al. 22 studied the spring phenomenon of hat‐shaped parts during processing by controlling the process parameters such as side mold pressure and mold temperature. Too high initial mold temperature and too large mold sidewall pressure would increase the spring of the sample after molding. Salomi et al. 23 analyzed the springback behavior of thermoplastic hat‐shaped parts after forming. They found that defects generated by processing, such as changes in fiber distribution at the fillet transitions, non-uniformity of thickness, and wrinkles, affect the springback behavior of the parts after demolding.
Most of the above studies are based on the experimental method to investigate the effects of different process parameters on the forming quality and springback deformation of CFRTP components during thermo-stamping process. Still, the disadvantage of this method is the long cycle time and high cost.24,25 In contrast, the newly developed numerical simulation technique is an advanced method to study CFRTP thermo-stamping process.15,16,26 Gong et al. 27 proposed a lamination model combining thermoplastic resin with woven fabric reinforcement, which can effectively predict the effects of factors such as forming temperature and crimping force on wrinkles. Ziegs et al. 28 modeled the temperature-dependent characteristics of CFRTP in the stamping and forming process by using MAT-249 in LS-DYNA, considering the quality variation of formed parts under different initial temperatures and lay-up conditions of the sheet material. Çobanoğlu et al. 29 performed a non-isothermal thermo-stamping simulation considering the resin crystallization process based on the Ani-form software. The results showed that critical process parameters such as the structure of the workpiece (angle of the wall extractor) and the position and number of springs used for crimping often affect the forming quality of the workpiece. The studies of Gong et al., 27 Ziegs et al., 28 and Çobanoğlu et al. 29 focused only on a single stage of the forming process and did not investigate the variation of forming quality during the forming process from a multi-process perspective. Limaye et al. 30 established a CFRTP hat-shaped beam simulation process chain from fabrication to response (MTR). They investigated the effect of the forming and cooling processes on the dynamic/static mechanical response of the final structure through the MTR simulation route. Stamopoulos et al. 31 introduced a multi-process simulation optimization methodology to consider the reduction of the sheet size without introducing additional defects, in order to reduce the manufacturing cost as well as pollution to the environment. Stamopoulos and Limaye et al. discussed the effect of the forming process on the mechanical properties of the workpiece after forming from a multi-process perspective. Still, they did not predict the amount of springback after the workpiece is demolded.
In contrast, Zhai et al. 32 used a thermoplastic wing leading edge as the object of study and predicted the springbcak of the workpiece after demolding by thermo-mechanical coupling analysis. It was shown that the thickness of the interface layer has a great influence on the prediction results. Hwang et al. 33 combined experimental and numerical simulation methods to study the springback behavior of woven carbon fiber/polycarbonate thermoplastic composites, and the results showed that the stacking order of the layers has a significant effect on the springback behavior of the workpiece. However, the study by Zhai and Hwang et al. did not predict the defects associated with the forming stage, nor did it take into account the effect of the forming process on the springback behavior of the workpiece. Ryu et al. 34 found that the simulation accuracy of springback prediction could be improved by considering the history information of the forming process, and the prediction error could be reduced from 23.07% to 8.65%. However, Ryu et al. only considered the history of nodal temperatures during the forming process. They did not include more data on the forming process, such as stress and thickness variations, which are extremely important for springback deformation. 23 In this study, we also included this history information in the simulation.
In summary, there are two main limitations of the existing studies: (1) most of existing studies carry out independent analyses for only a single process stage, which can only predict the occurrence of individual defects. (2) the existing models only incorporate some of the forming history information (nodal temperatures) into the simulation of the cooling and demolding stages, which may lose some of the springback prediction accuracy. Therefore, an integrated simulation method that can characterize the whole process of CFRTP thermo-stamping is proposed in this work. The main steps include: material property testing and material card generation, non-isothermal simulation in the forming stage, cooling analysis in the cooling stage, and springback analysis in the demolding stage. According to the characteristics of the different stage, different solvers and solving strategies are selected to realize the integrated simulation method for the whole process. Finally, the accuracy of the integrated simulation method of the forming process chain proposed in this paper is verified by comparing the simulation results with the hat-shaped beam parts obtained from the corresponding experiments The structure of the paper is arranged as follows: Section 2 describes the integrated simulation method of CFRTP thermo-stamping process chain; Section 3 carries out the material property characterization test of GF/PP plain weave composites in forming-cooling-demolding phase and thermo-stamping experiments of CFRTP hat-shaped beams; Section 4 introduces the integrated simulation method of CFRTP process chain in detail and carries out the molding prediction and experimental validation; Section 5 summarizes the whole paper by conclusion and outlook.
Materials and methods
CFRTP thermo-stamping process chain integration simulation methods
This study proposes a simulation method for the CFRTP thermo-stamping process chain using LS-DYNA (see Figure 2), comprising four key steps: (1) material property testing and material card generation, (2) non-isothermal forming stage simulation, (3) cooling stage analysis, and (4) springback analysis during demolding stage. Step 1 involves material characterization through tests (e.g., picture frame shear, fabric tension, cantilever beam bending, and bias-extension) to obtain MAT-249 and MAT-23 parameters. Uniaxial tensile tests at varying temperatures were conducted to determine temperature-dependent mechanical properties. An FE model was validated against experimental data to ensure simulation accuracy. Step 2 constructs a thermo-mechanical coupling model for forming process using MAT249, simulating CFRTP forming under non-isothermal conditions to capture fiber angle changes, thickness variations, temperature distribution, and residual stress. Step 3 develops a cooling process simulation model using MAT23, mapping forming history (temperature, thickness, and stress distributions) to analyze residual stress evolution during in-mold cooling. Step 4 performs springback process simulation using MAT23, mapping cooling results to the final model. Excess mold mesh is removed, and boundary conditions (constraints, gravity, and convective heat dissipation) are applied to simulate springback after demolding. Integrated simulation method for the thermo-stamping process of CFRTP materials.

This four-step approach enables the CFRTP thermo-stamping chain simulation, transitioning between thermo-mechanical coupling explicit/implicit and static springback analysis, ensuring accurate result transfer and simulation precision.
Characterization of CFRTP material forming properties
The CFRTP thermo-stamping process transforms a 2D sheet into a 3D component, involving diverse deformation mechanisms such as in-plane shear, out-of-plane bending, and in-plane tension. Moreover, during the transfer stage and subsequent press molding, the thermoplastic resin experiences heat exchange with the surrounding air and the cooler mold, as depicted in Figure 3. The thermoplastic resin gradually solidify as the temperature decreases, and it is also crucial to capture the mechanical properties of the thermoplastic matrix during this process. The temperature dependence and deformation modes of the CFRTP materials are experimentally characterized in this section. Temperature variation during molding of thermoplastic composites.
Material types.

Material properties of GF/PP composite.

Characterization of matrix mechanical properties at different temperatures

Material properties of the PP 34 .


Temperature dependence of PP materials: (a) modeled temperature dependent stiffness of pp matrix; (b) flow curves of matrix.
For material characterization of the flow behaviour o of the matrix, the well-known Gosh-Ansatz method
28
was used to obtain its flow curve at high temperatures by extrapolating the yield behavior of the matrix at lower temperatures. The method utilizes equation (2), in which the yield stress of thermoplastic 
Figure 4(b) demonstrates the experimentally obtained flow curves at the lower temperatures versus the extrapolated flow curves at the higher temperatures.
Characterization of in-plane tensile behavior of GF/PP fabrics
The fibers dominate the in-plane tensile properties of the material during the forming process and are less affected by temperature variations.
37
The sample size was 200 mm × 35 mm, and was loaded at a constant rate of 1 mm/min in the test. Three replicate tests were performed. The stress-strain curves recorded from the tests are shown in Figure 5. Fabric tensile test test results.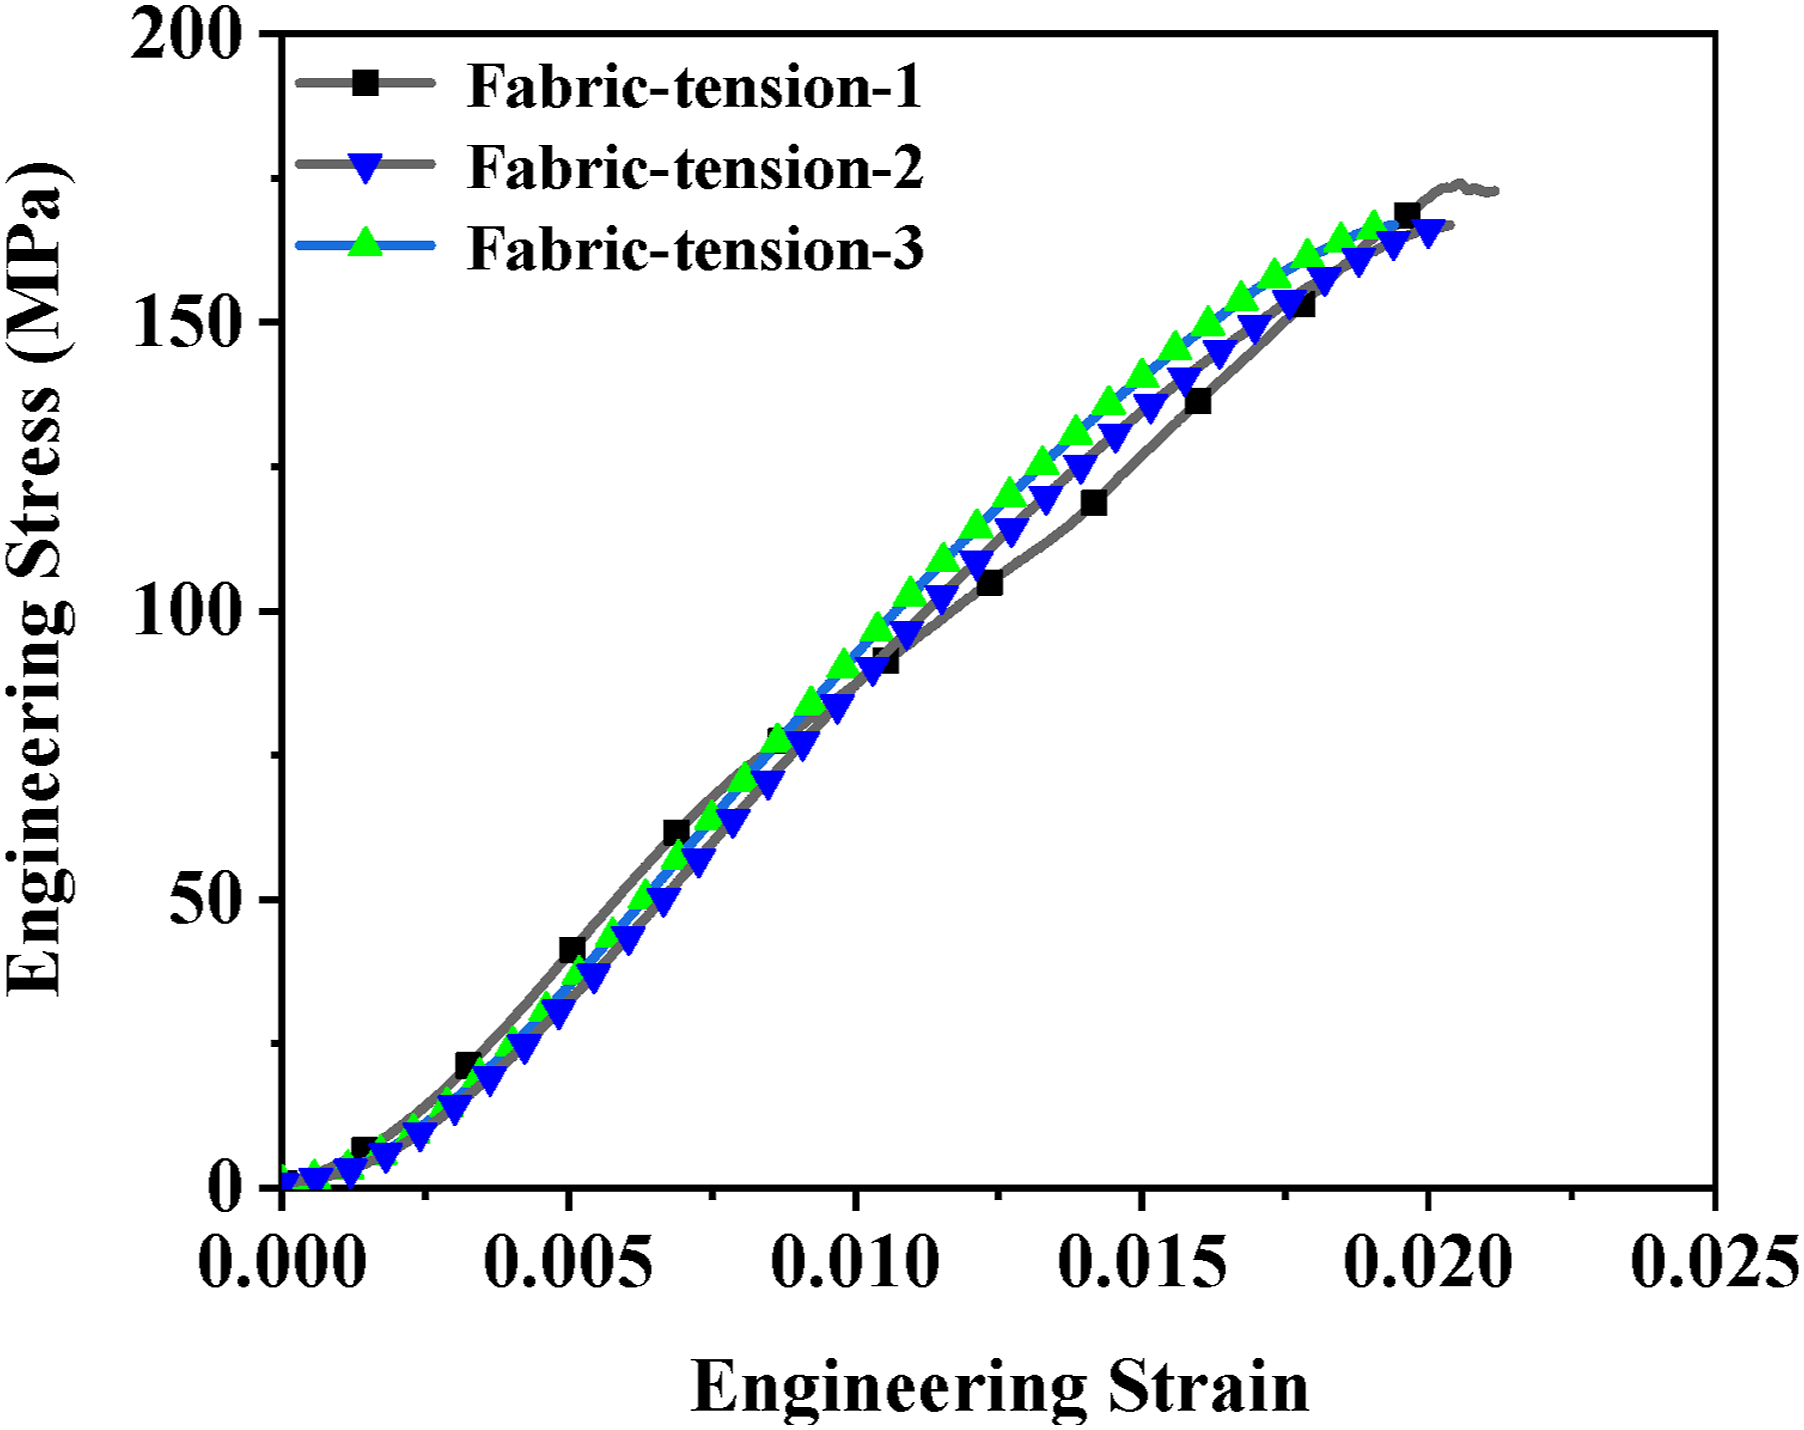
Characterization of in-plane shear behavior of GF/PP fabrics at room temperature
A picture frame device was used to characterize the in-plane shear deformation behavior of # (0/90) fabrics of GF/PP at room temperature, as shown in Figure 6. For testing, the fabric was clamped to a hinged frame equipped with four equal-length rods. Then, a uniform displacement of 25 mm/min is applied to the frame’s diagonal, and the resulting tensile force deforms the frame, moving it from an initial square structure to a diamond-shaped structure. To record the test process and ensure its accuracy, the tests designed in this paper used a DIC device to record the displacement data.38,39 The picture frame device involved in this paper has an initial frame size of 190 mm, and the samples used for the tests were obtained by further cutting from a material with a size of 200 × 200 mm2, with a center area of 120 × 120 mm2. As shown in Figure 7, several sets of test were conducted, and three sets of test data with good consistency were obtained. Picture Picture

Characterization of in-plane shear behavior of GF/PP prepreg at high temperatures
Considering that the materials degrade at high temperatures, the in-plane shear behavior of 0.5 mm #(±45) single-layer prepreg at high temperatures is characterized by bias-extension test. In view of the fact that there is no clear and unified standard in the field of prepreg bias-extension test, in order to ensure the standardization of the test process and the reproducibility of the results, some of the operation procedures in the test refer to the ASTM D 3039 standard.
39
The size of the sample used in this test is 50 × 110 mm, and during the test, the oven is heated at a rate of 10°C/min, and when the temperature in the oven reaches 170°C, the temperature is maintained for 5 min, and then the sample is loaded at a tensile rate of 5 mm/min. To ensure the accuracy of the experimental results, the experimental results were recorded by a DIC device. Several repetitions of the experiments were carried out, and three sets of experimental results with good consistency were obtained, as shown in Figure 8. In contrast to the shear behavior of fabrics at room temperature, the in-plane shear behavior of prepregs at high temperatures shows a large shear stiffness region at the beginning of the shear deformation due to the ideal plasticity of the polymer above the melting temperature of Tm. The experimental results in Figures 7 and 8 can visualize this difference.
40
Bias-extension test results.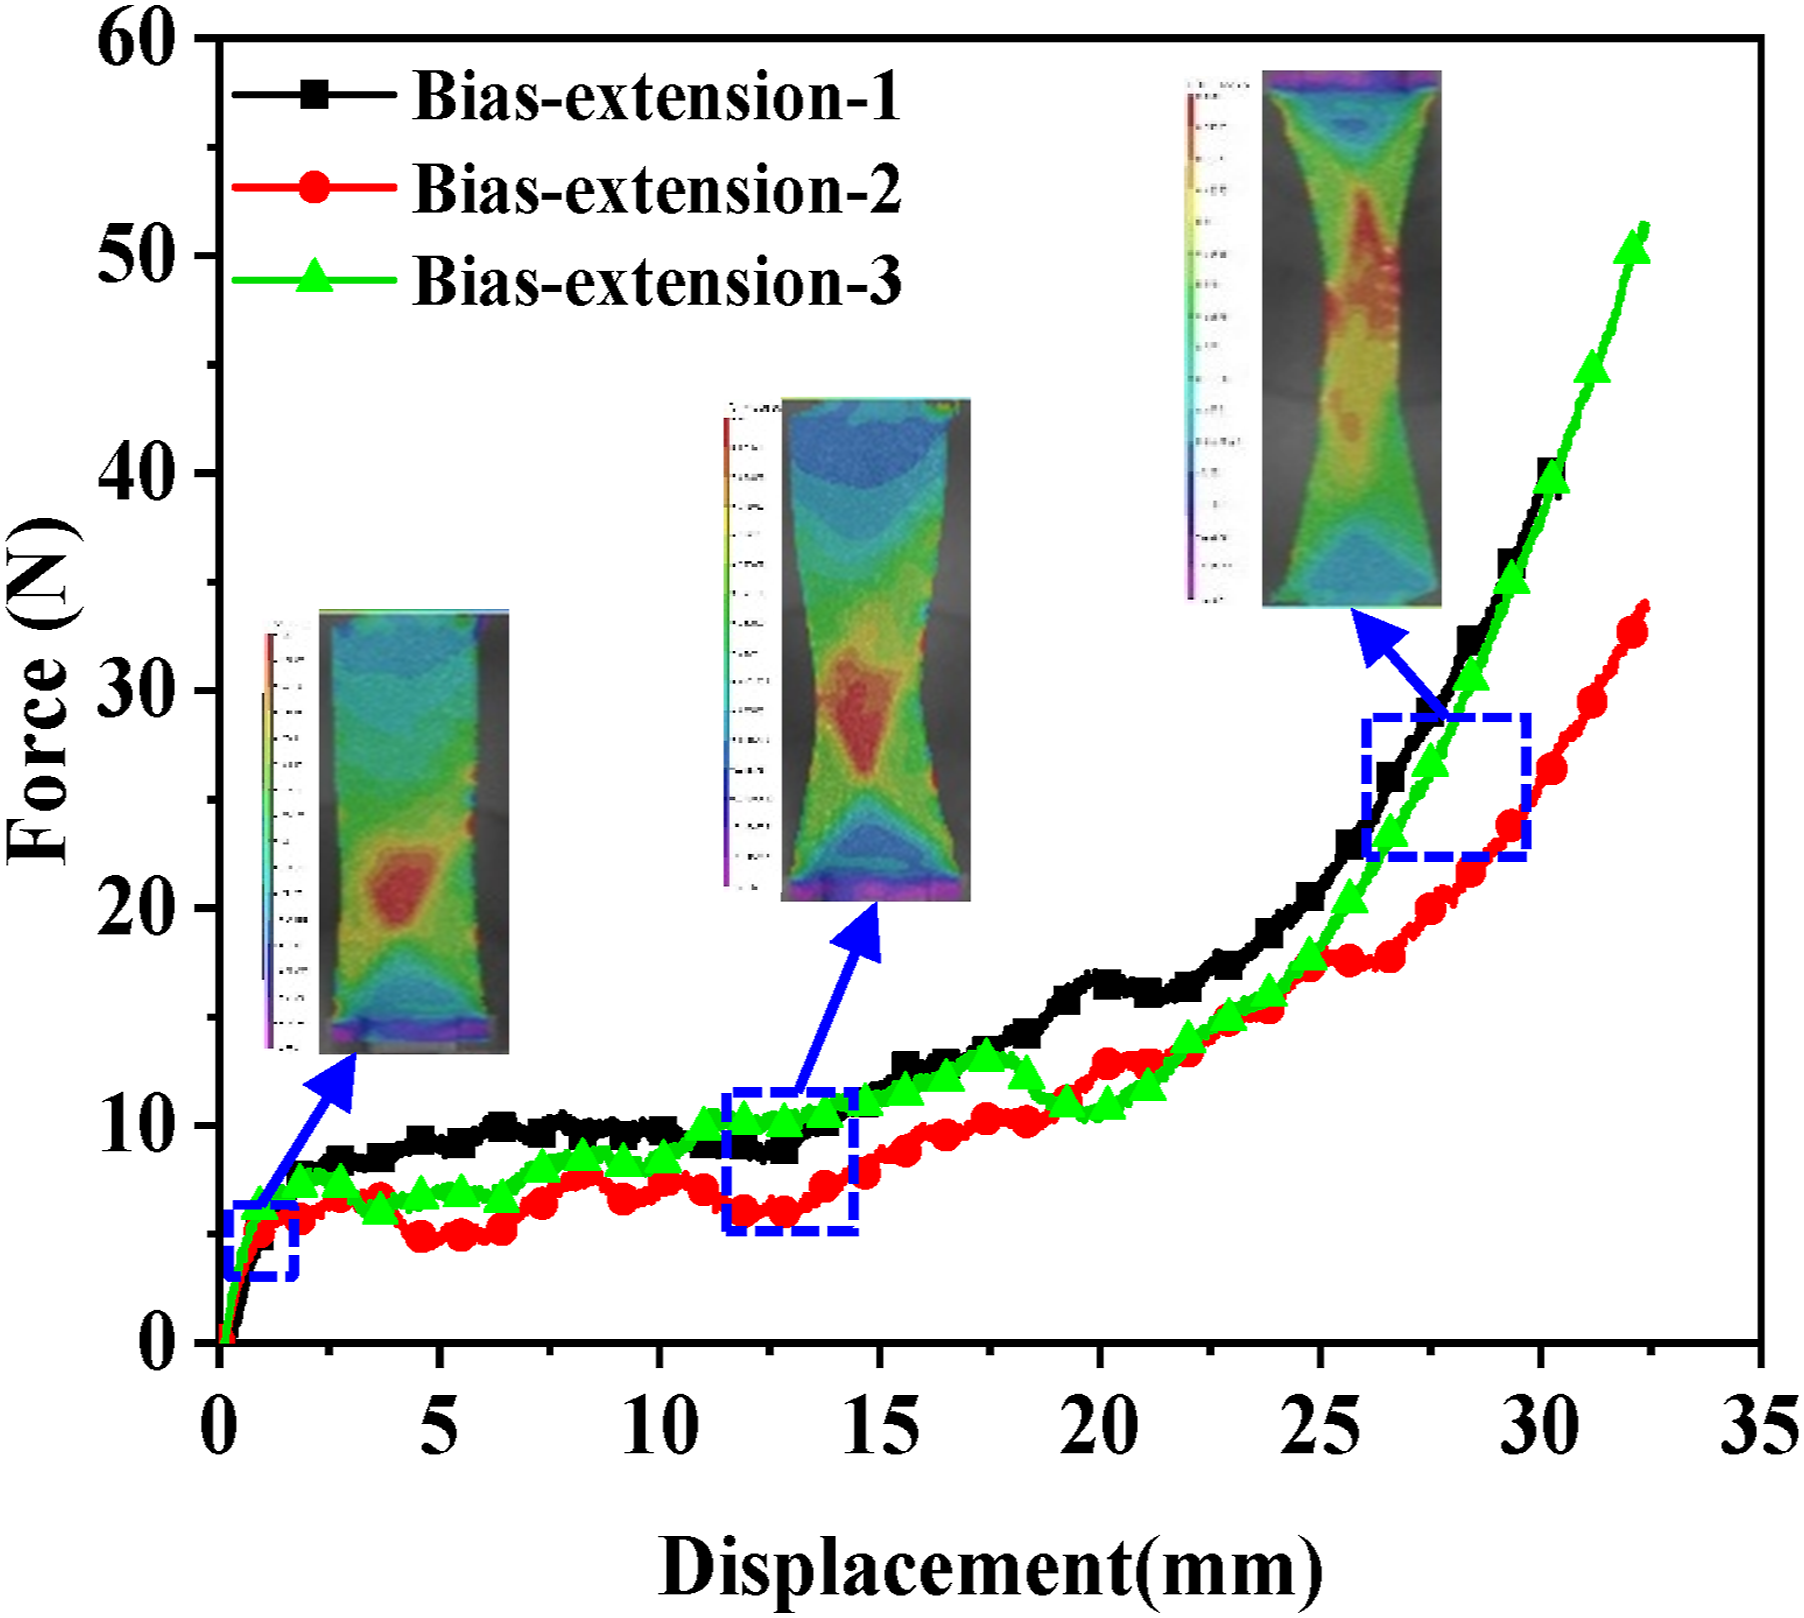
Characterization of out-of-plane bending behavior of GF/PP prepregs
The out-of-plane bending stiffness of GF/PP prepregs was calibrated using the gravity cantilever beam test according to the test standard ISO 9073-7:1995.
41
A 0.5 mm # (0/90) single-layer prepreg was used for this experiment. The cantilever beam specimen used for testing was 15 cm long. As shown in Figure 9(a), the construction of the test setup required clamping and fixing one end of the specimen on top of a ramp, the slope of the ramp is 41.5°. A special clamping device was used to connect the innermost specimen of a strip to one end of a thermocouple. In contrast, the other end of the thermocouple was connected to a temperature signal receiver. A laptop computer reads the temperature data from the temperature signal receiver to accurately monitor the specimen’s temperature change during the test. The inclined plane was placed in an oven with a heating rate of 10°C/min, and after heating, until the sample temperature was observed to reach the forming temperature of 190°C and held for 5 min, the door of the oven was quickly opened. An image of the sample was recorded using a digital SLR camera. After the experiment, the acquired images were processed using ImageJ software to obtain the deformation of the sample under high temperatures due to the gravity effect. Figure 9(b) shows the final results of the experiment. Cantilever beam experiment on prepreg: (a) construction of a cantilever beam test setup; (b) cantilever beam experimental results.
Characterization of material properties during cooling and springback stage
After the forming stage, the punch and die remain in place, and the workpiece is gradually cooled using heat transfer methods such as thermal contact, thermal radiation, and thermal convection. During this process, the workpiece gradually generates residual stresses due to temperature changes and the interaction between the mold and the workpiece. This is because composites’ mechanical properties and thermal expansion behaviors in the fiber and matrix directions vary greatly with temperature during the holding process due to their anisotropic characteristics, which induce residual stresses inside the workpiece.42,43 These residual stresses affect the angular and bending deformation (dimensional instability) of the part after the part is de-molded. To model this feature, this paper experimentally determines the mechanical properties of GF/PP composites at different temperatures with coefficients of thermal expansion in the in-plane and out-of-plane directions.
Mechanical properties of thermoplastic composites at different temperatures
To obtain the mechanical properties of the composites at different temperatures, the tensile tests were carried out at three temperatures: 23°C, 100°C, and 170°C, respectively. All the tensile tests were performed on a Zwick Z100 TEW universal testing machine with an oven, and the strain data were collected using a DIC system with a 100 kN 2580 series static piezometric element with a test speed of 1 mm/min and a heating rate of 10°C/min. The test results are shown in Figure 10(a) and (b). Table 4 further demonstrates materials’ elastic and shear moduli at different temperatures. Uniaxial tensile tests: (a) tensile stress-strain curves of PP/woven GF 0/90° orientation at RT, 100°C, and 170°C; (b) tensile stress-strain curves of PP/woven GF 45° orientation at RT, 100°C, and 170°Ccurves 0/90°orientation at RT. Mechanical properties of PP/GF at different temperatures.

Thermal properties of thermoplastic composites and molds
Coefficient of thermal expansion of material.

Thermo-stamping experiment of CFRTP hat‐shaped beams
The thermo-stamping unit used in this experiment, as shown in Figure 11, consists of two forming tools (punch and die) and a binder device. The punch and die are matched with each other by two guide posts at the diagonal positions of the dies to ensure the accuracy of the die positions during the forming process. The binder is connected to air springs, each with a pressure of 70 N. During the gradual descent of the punch, the binder compresses the air springs to exert a force on the sheet. Compared to conventional springs, the air springs maintain a constant force of 70 N on the binder during forming stage. The initial size of the sheet was 400*217 mm, and all forming tests were carried out on a pressure tester with a 500 kN Series 2580 static load cell. During the thermo-stamping experiments, it is first necessary to apply WOCAX-710 liquid release agent on the surface of the upper and lower molds to prevent the cooled parts from sticking to the molds during demolding. Afterwards, the molds with thermocouples attached and the sheets were put into different heating chamber and heated to 120°C and 190°C, respectively. After reaching the required temperature for the test, the sheet and the thermo-stamping test device were quickly transferred to a test stand. A force application rate of 5 kN/min was applied until a pre-set load of 22 kN was reached. The average pressure of the thermo-stamping was estimated to be 2 MPa. After maintaining pressure and cooling for 20 min, the mold was opened, and the workpiece was removed and allowed to cool down to room temperature under natural convection. At the end, the angle of the workpiece after demolding was measured. Thermo-stamping experiment of CFRTP hat‐shaped beams setup.
CFRTP process chain integration simulation detailed modeling pathway
This sections details the construction process of the LS-DYNA-based CFRTP thermo-stamping simulation process chain. The whole construction process is divided into four steps. In the first step, FE models of the experimental processes, such as the picture frame shear test, the in-plane tension test, and the out-of-plane bending test, are built to calibrate the material card parameters used for simulation. In the second step, the material cards obtained in the first step were used to simulate the experimental process of forming the sheet at 190°C. In the third step, the forming simulation results (thickness distribution, stress distribution, temperature results) are mapped to the cooling model to perform the cooling analysis of the workpiece under holding pressure. In the fourth step, after the cooling analysis, the workpiece acquires a new stress state, and the results of the new state are mapped to a pure workpiece FE model without a mold to simulate the workpiece’s springback response after demolding.
Material-level simulation and validation
To ensure the accuracy of the simulation of the forming process, the in-plane (tensile, shear) and its out-of-plane behavior (bending) during the forming process were aligned using MAT-249
44
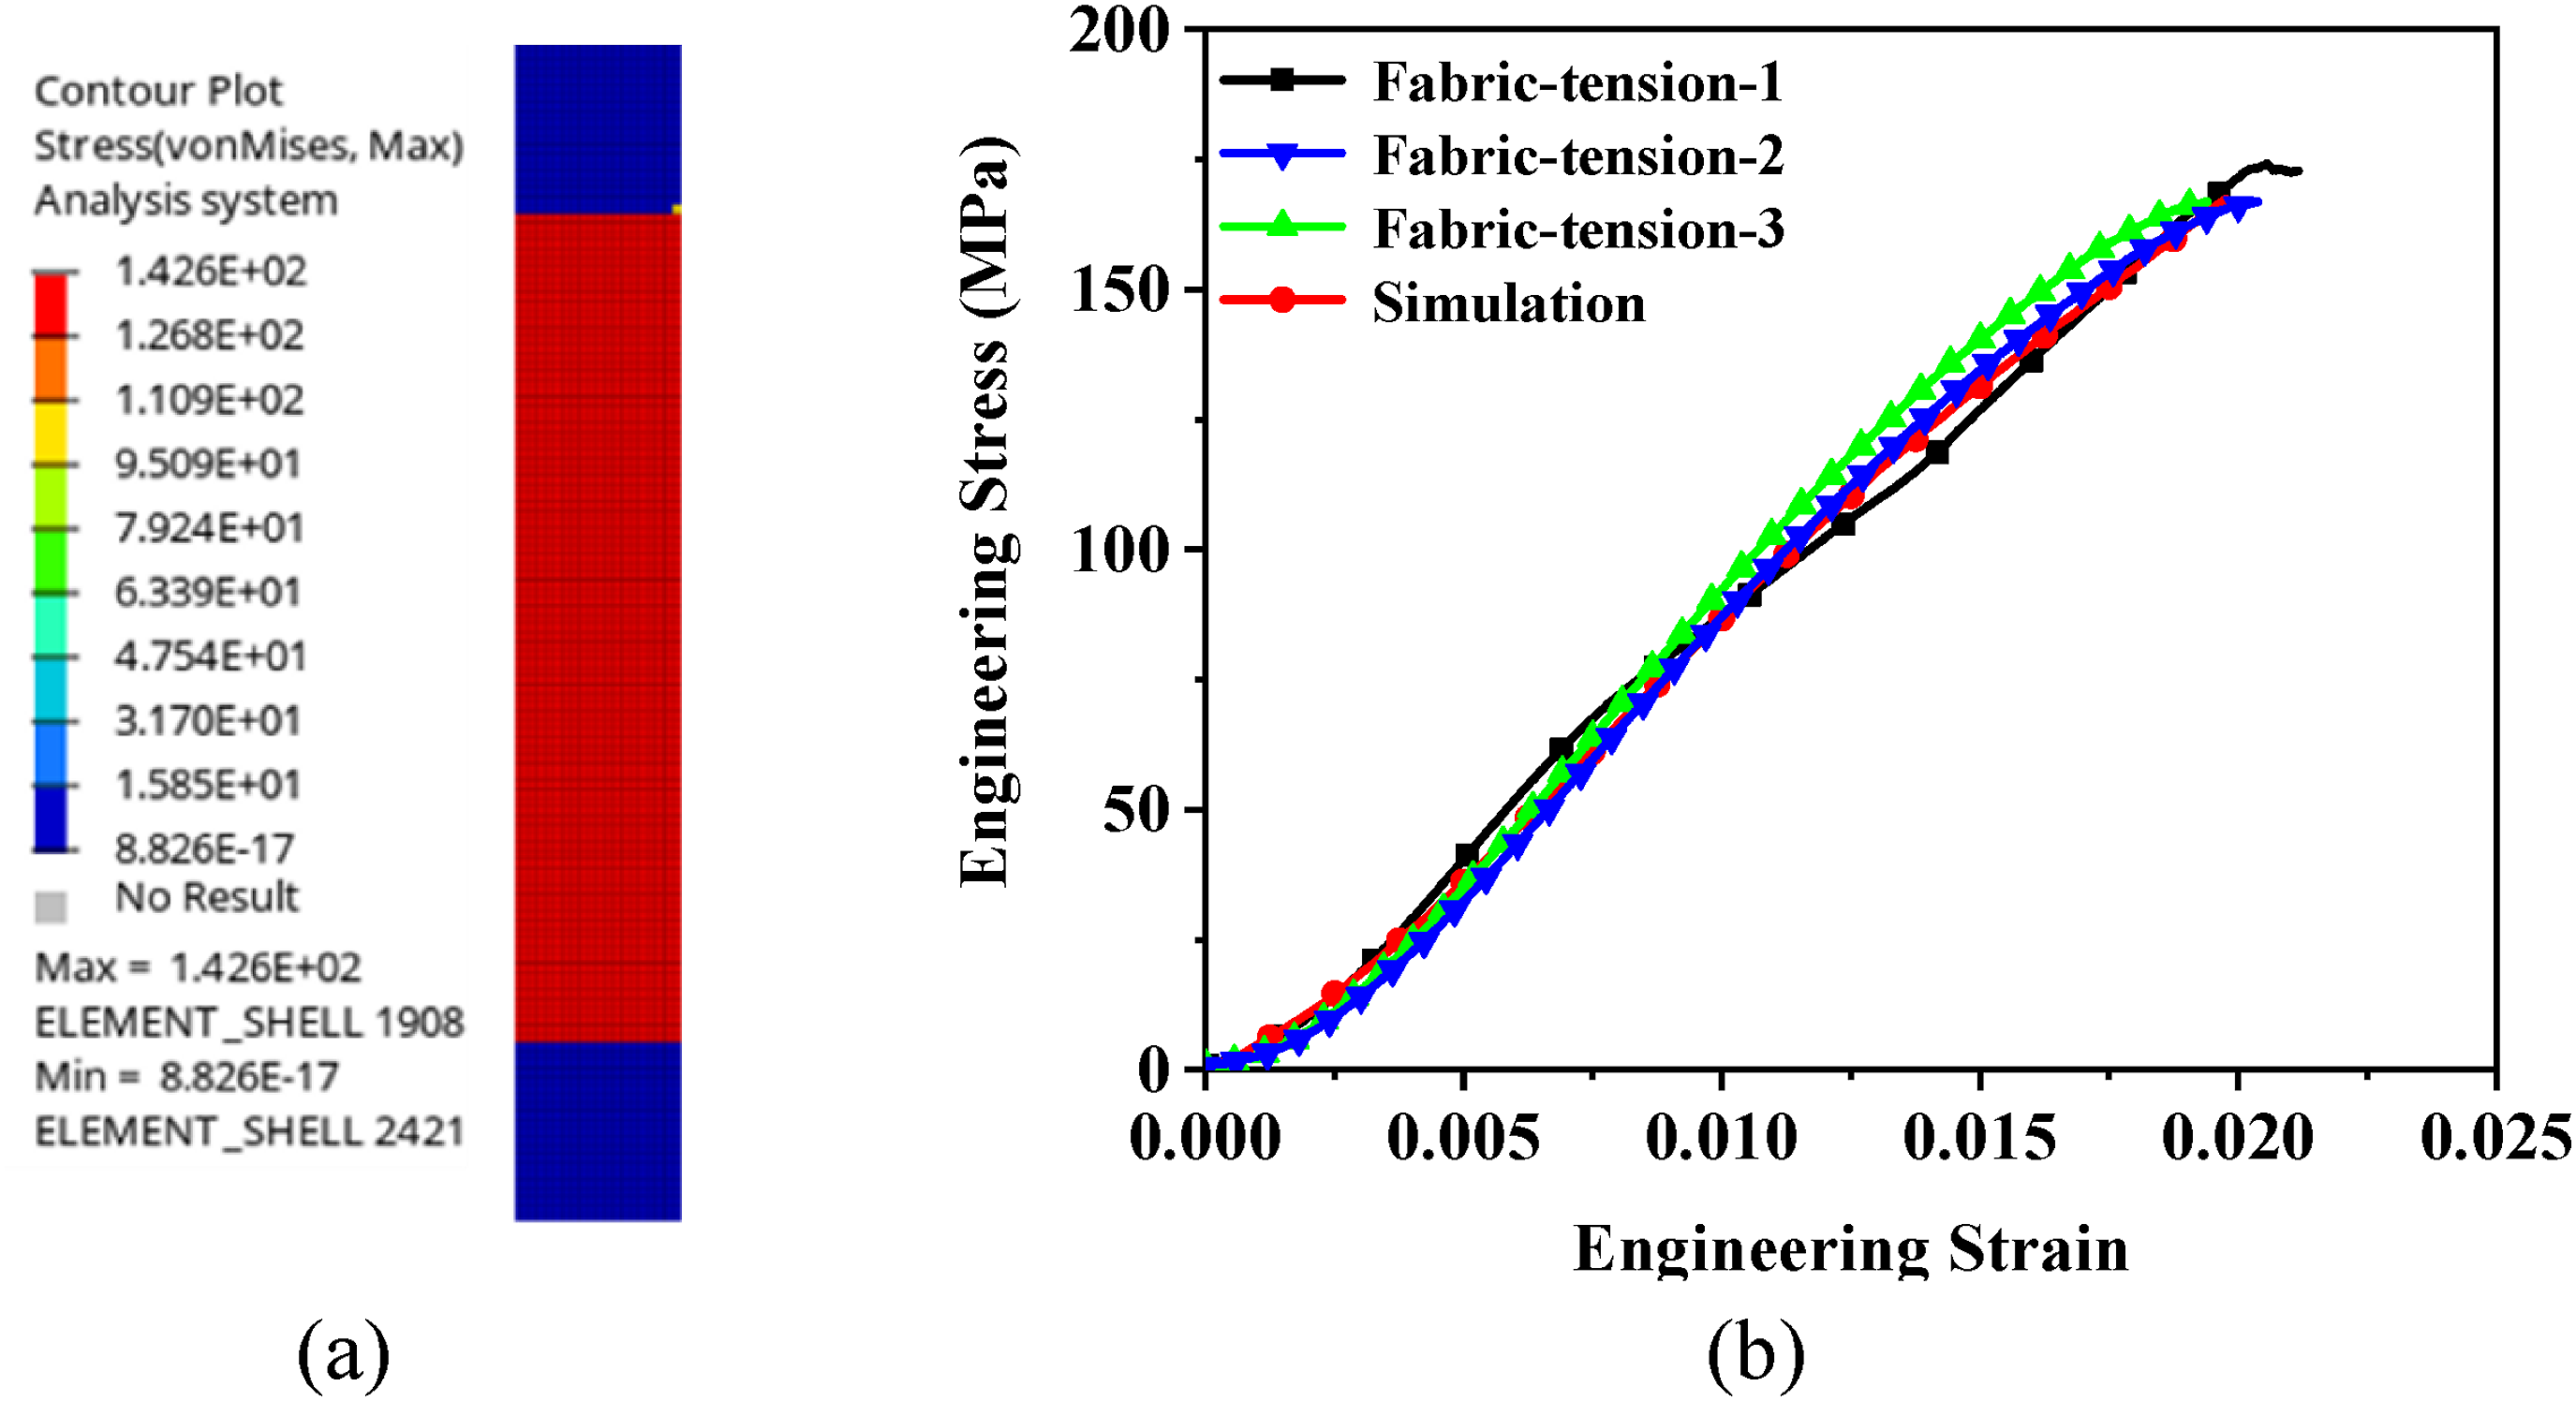
which is a new anisotropic material model developed by LS-DYNA to provide advanced simulation solutions for CFRTP thermo-stamping and fabric preform processes. In this material model, matrix and fiber modeling are considered separately, and the overall stress 
The matrix is first modeled using a thermally isotropic elastic-plastic formulation, and equation (4) gives its deformation, with the total deformation 
This constitutive equation allows the modeling of the thermoplastic matrix’s temperature dependence, where the matrix’s mechanical properties in the elastic phase can be defined as a function of temperature. For the plastic phase, the model employs the Von-Mises flow criterion, and flow curves at different temperatures can be defined to characterize the evolution of the plastic deformation. Figure 4 describes the temperature-dependent properties of the matrix.
Fibers are described using a nonlinear hyper-elastic formula that defines up to three fiber families with fiber orientations. Equation (5) describes the tensile or compressive properties of fibers. FE modeling and validation for tensile conditions: (a) FE modeling for tensile conditions; (b) comparison of experimental and simulation results.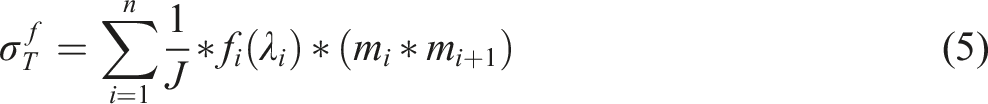
The MAT-249 model also uses a three-parameter model to characterize the in-plane shear behavior of prepregs, which uses the initial shear modulus 
Therefore, the whole in-plane shear performance alignment work was divided into two steps. Firstly, the experimental data of fabrics at room temperature in Figure 7 were aligned in order to obtain the specific values of FE modeling and validation for picture frame shear test conditions: (a) FE modeling for picture frame she test conditions; (b) comparison of experimental and simulation results. Values of the three-parameter model. FE modeling and validation for Bias-extension test conditions: (a) FE modeling for Bias-extension test conditions; (b) strain contour plots during the experiment recorded by DIC; (c) comparison of experimental and simulation results.


The above analysis of the constitutive model shows that the MAT-249 constitutive model cannot decouple the bending behavior from the in-plane behavior during the material-forming process. To solve this problem, this paper adopts the method of extended integration points
45
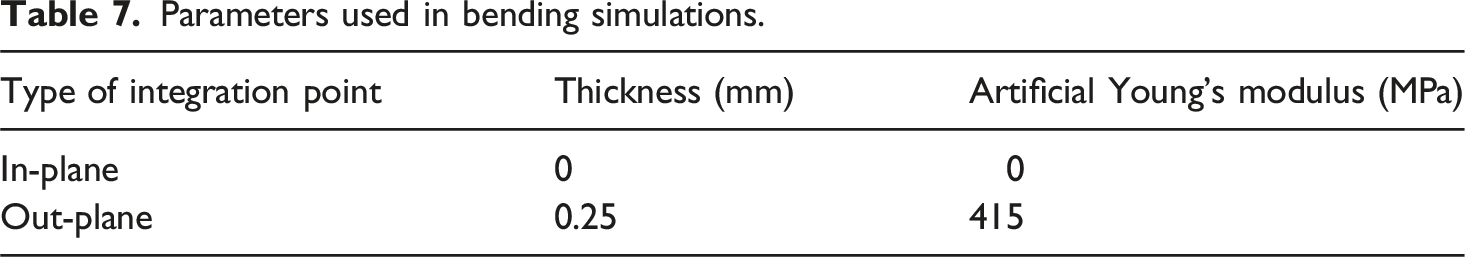
in modeling the bending behavior of thermoplastic composites, i.e., the central integration point is used to describe the in-plane properties. In contrast, the external integration points simulate the out-of-plane properties by adding an artificial Young’s modulus, as shown in Figure 15. Extended integration point approach.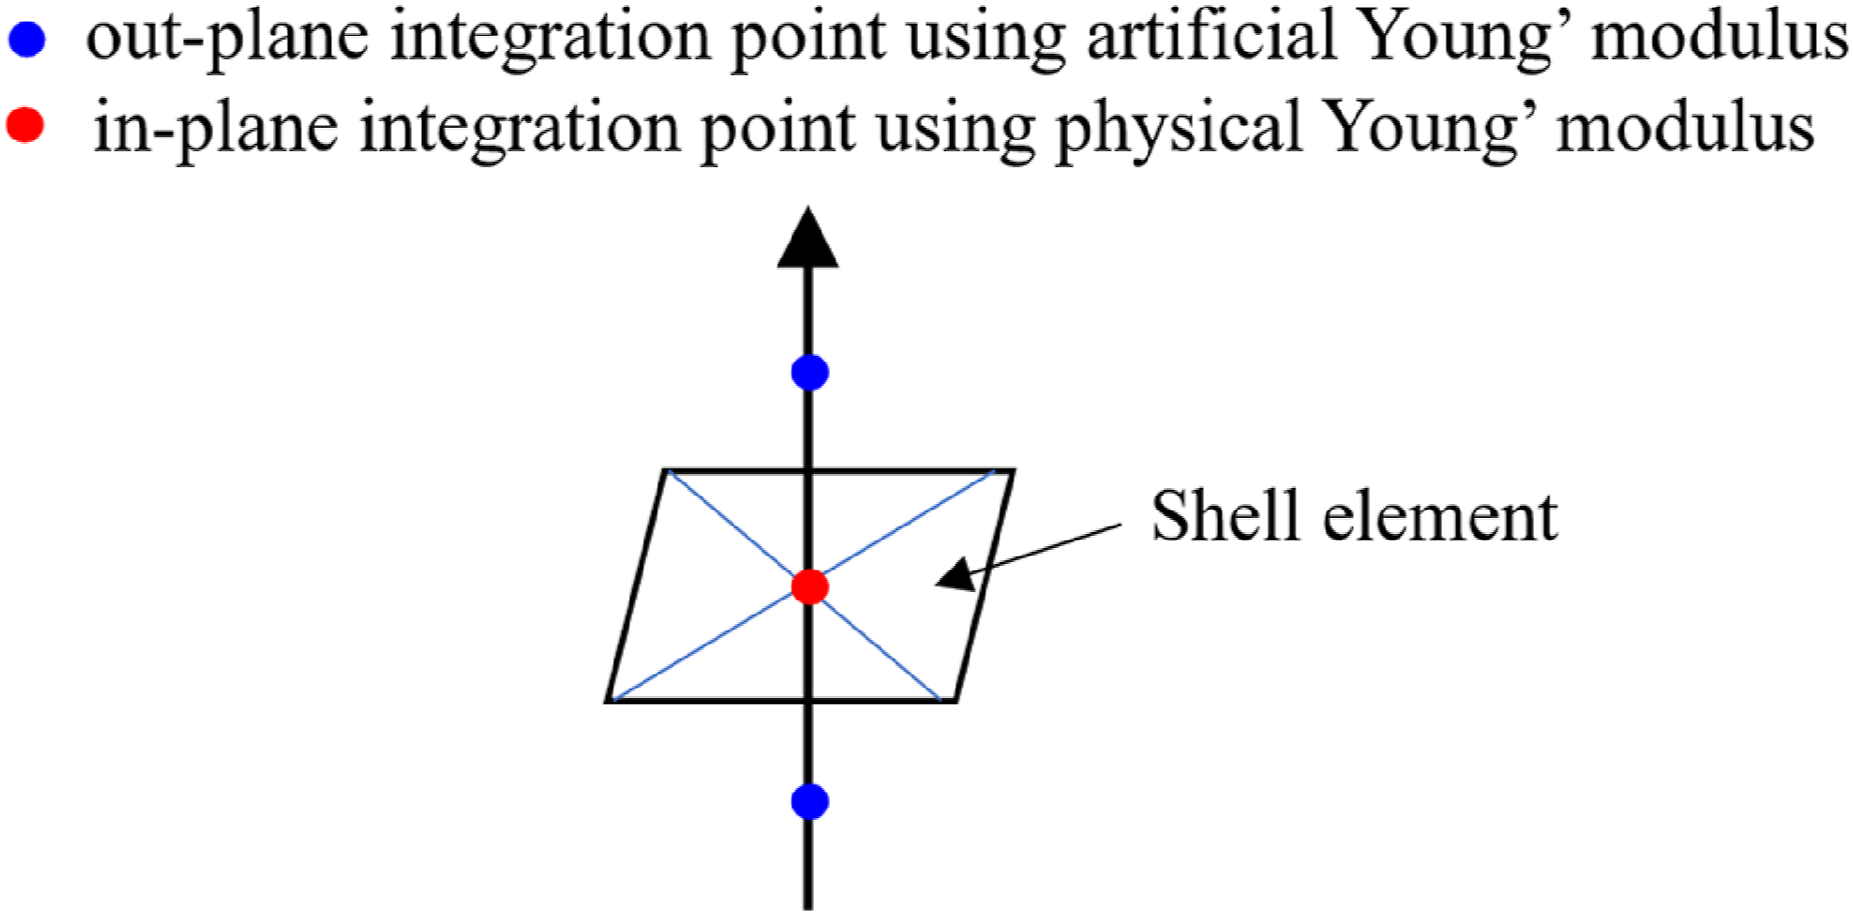
Parameters used in bending simulations.
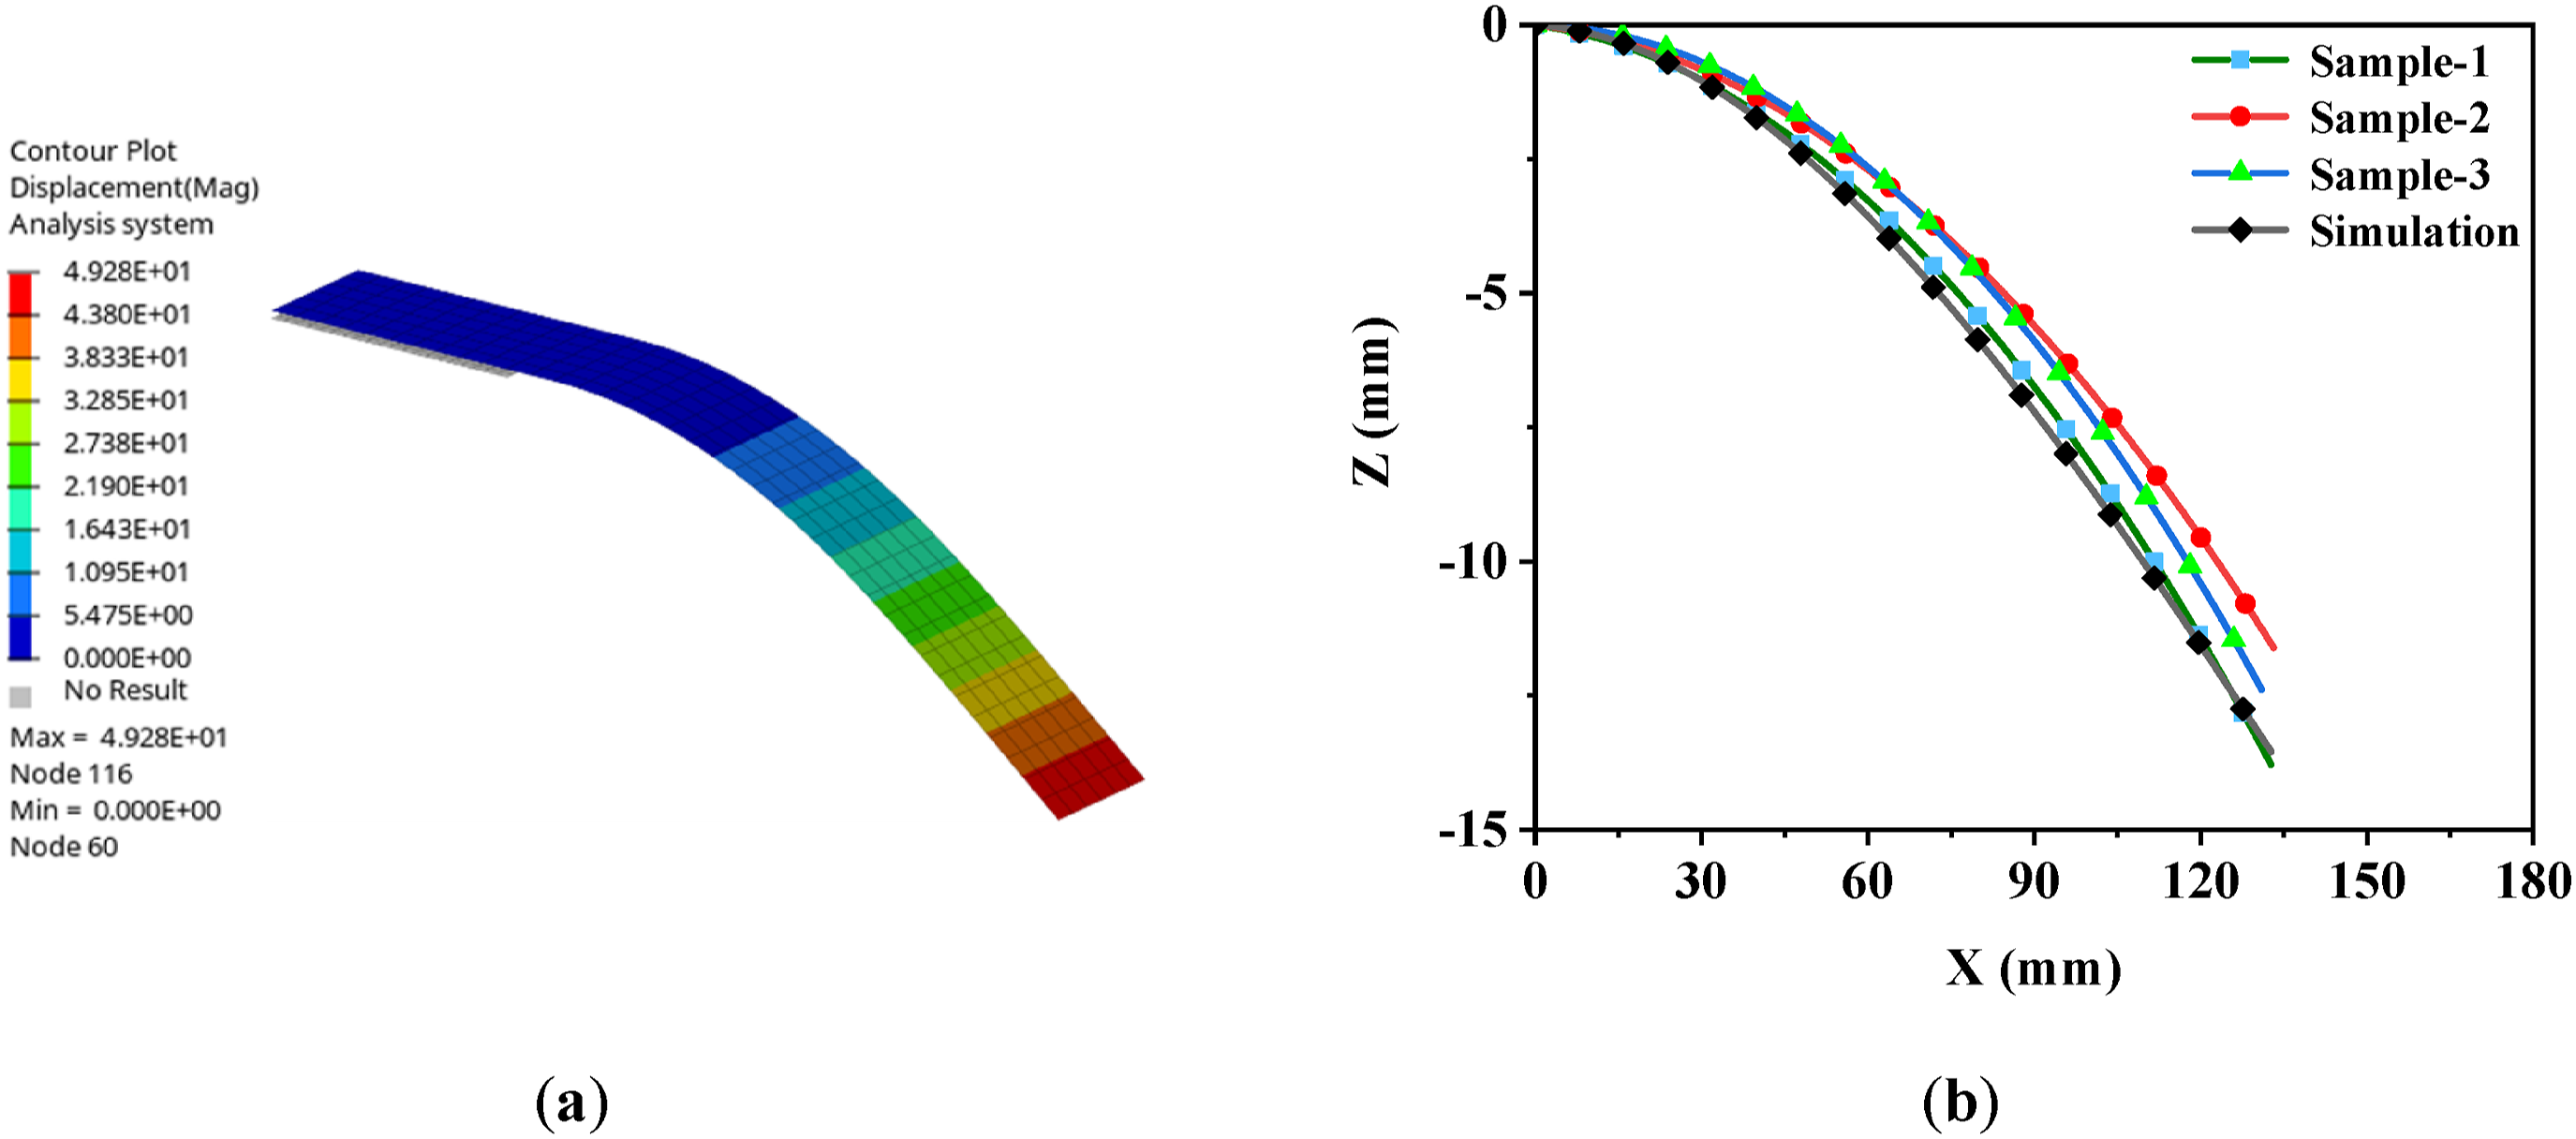
FE modeling and validation for cantilever beam test conditions: (a) FE modeling for cantilever beam test conditions; (b) comparison of test results with simulation results.
Forming simulation
The FE model constructed in the first step for the forming stage simulation is shown in Figure 17, which consists of sheet, punch, die, and two binders similar to the experiment. The molds and binder are discretized using Belytschko-Tsay type shell element and given rigid body properties. The plates are discretized using fully integrated shell element and are given the MAT-249 material. FE model of forming simulations.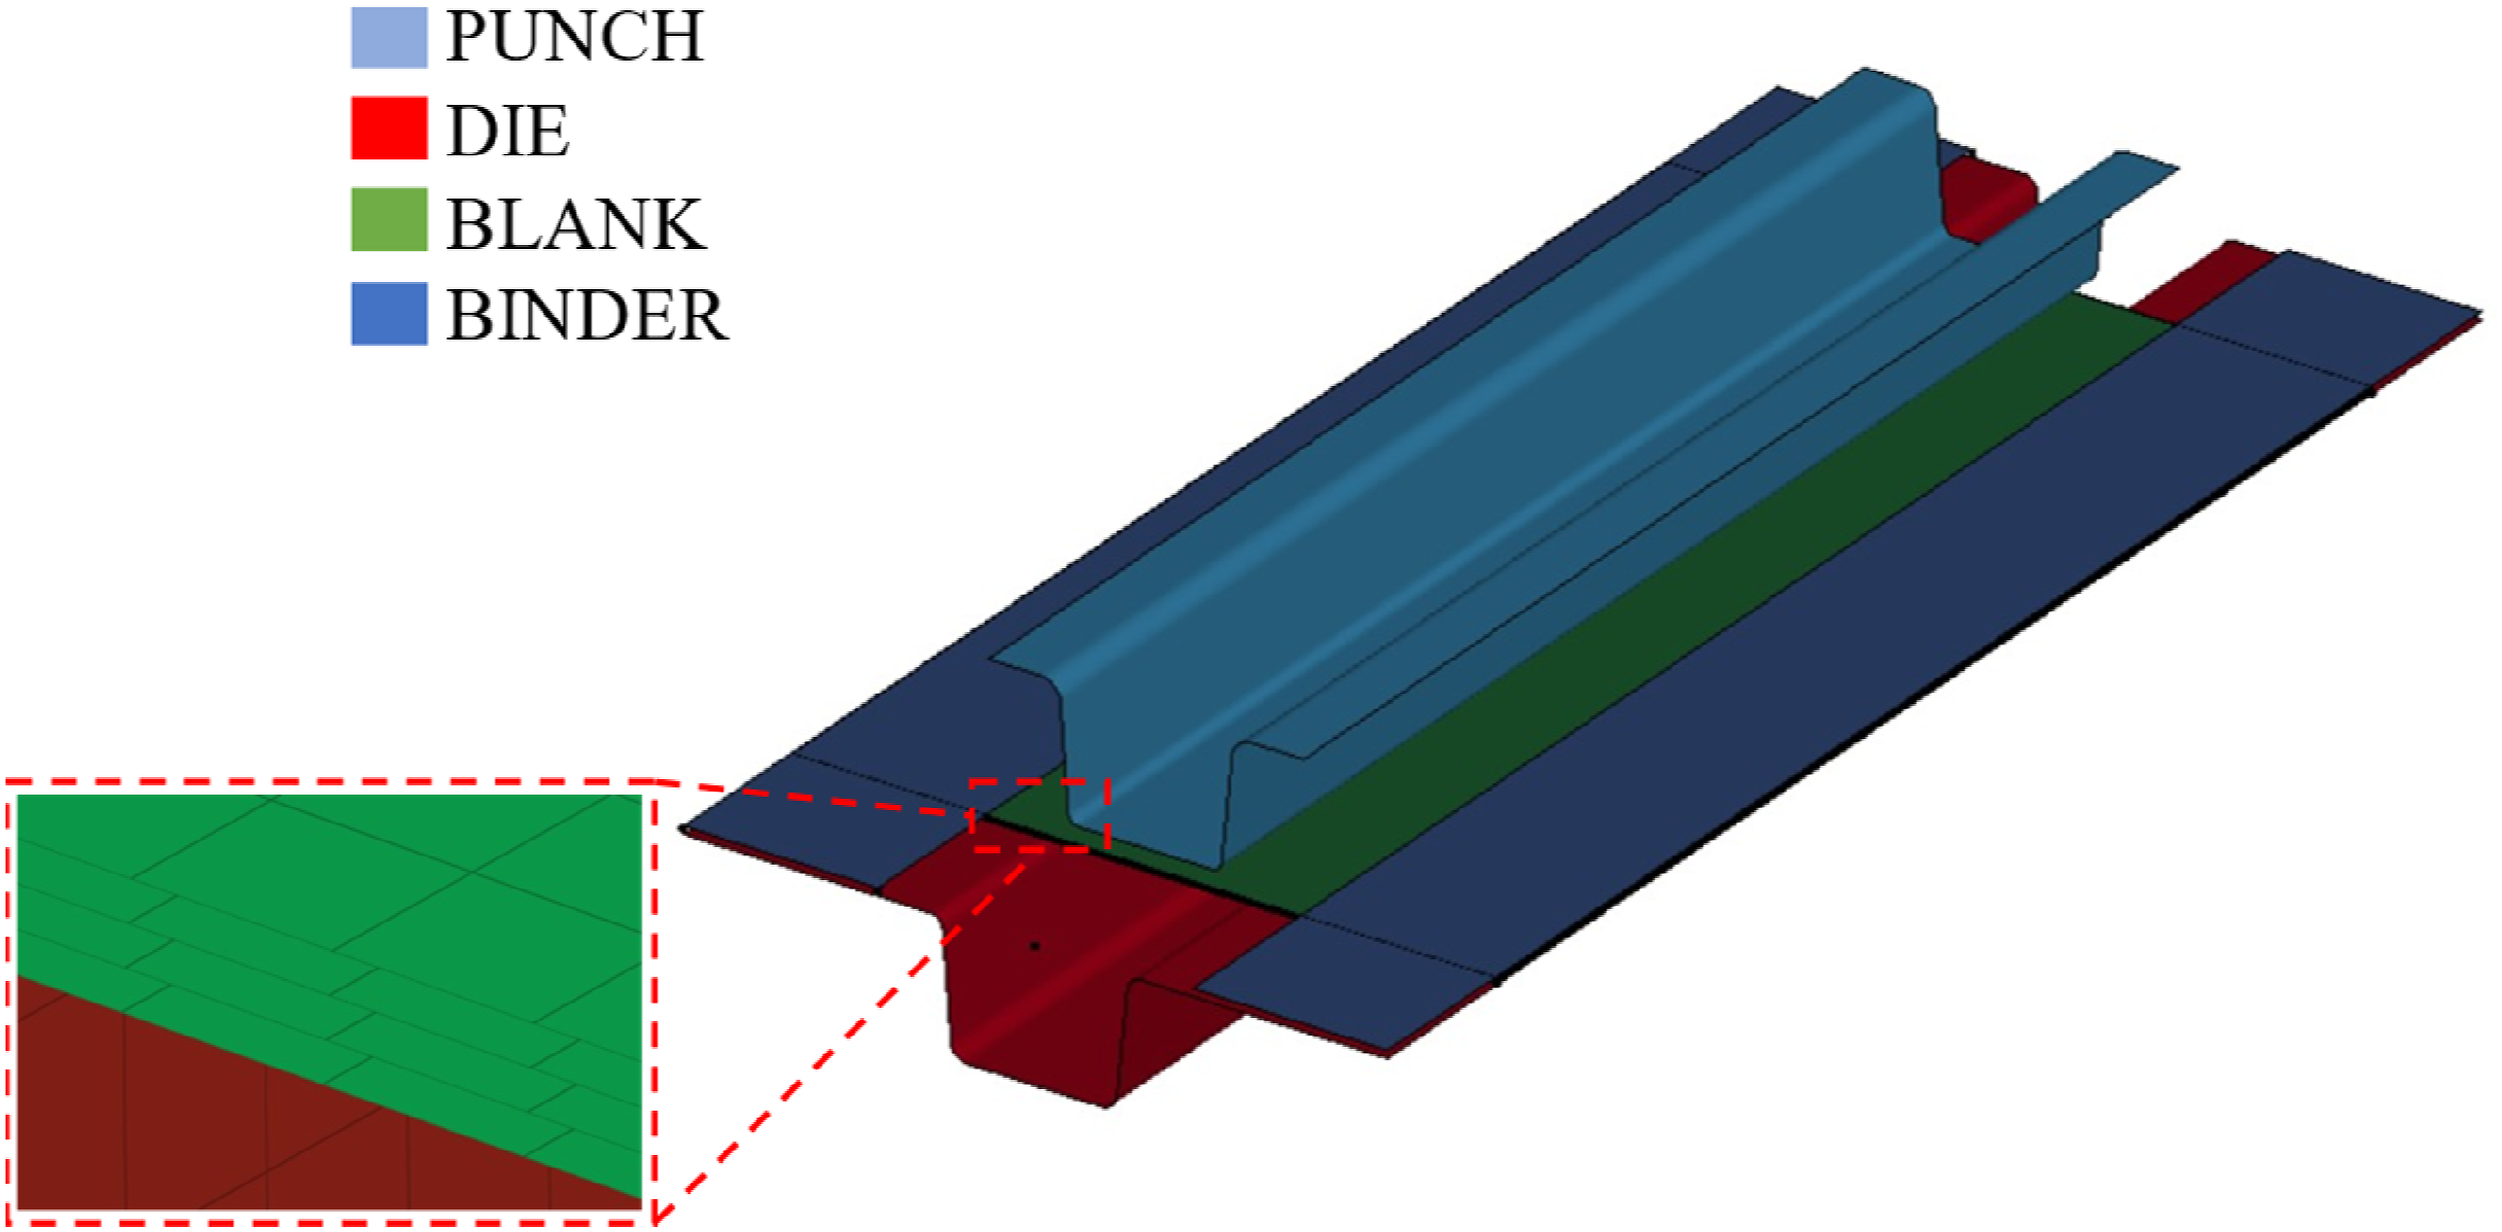
Friction coefficients and heat transfer coefficients of ply-ply and ply-mold.
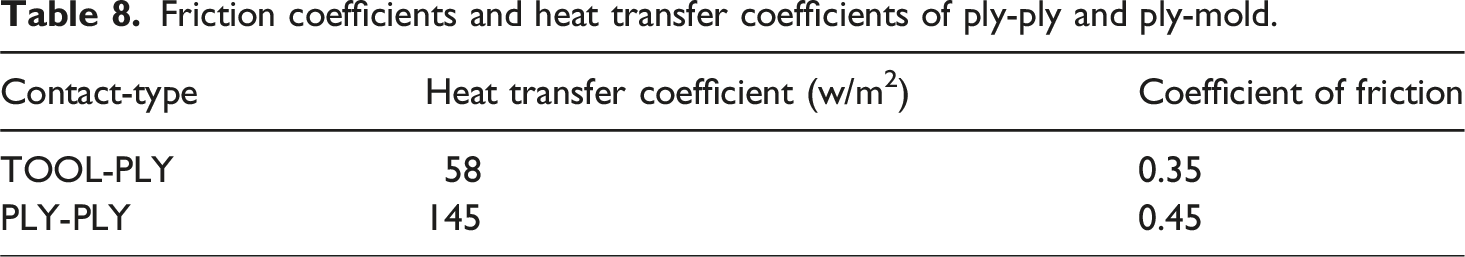
Considering the influence of temperature on the forming results, the thermo-dynamic effect of the material is taken into account in the modeling, so the thermo-mechanical coupling analysis module in LS-DYNA is used in the solution process. The sequence “Coupled Thermal-Mechanical Solution Method” is first started by the keyword *Control_solution, and the temperature field solver is added using *Control_thermal_solver. Then, the keyword *Initial_tempreature is used to add the initial temperatures for the different structures, where the initial temperature of the sheet is set to 190°C, which is in line with the experiment, and the temperatures of the mold and the binder are set to 120°C. Finally, time steps were set for the thermal analysis based on *Control_thermal_timestep. In the forming analysis, it is assumed that the strain energy is only consumed in the deformation of the during the loading process (movement of the punch towards the die), and the unloading effect is not considered.
Cooling simulation
The actual manufacturing process of a workpiece is a continuous process consisting of forming and cooling. Therefore, the FE simulation of the cooling process must be combined with the forming simulation to ensure the accuracy of the final springback simulation. In this study, the thickness distribution, temperature history and stress data of the formed workpiece were transferred to the cooling model by using the DYNAIN method in LS-DYNA. When using this method, a DYNAIN file is automatically generated after the forming analysis is completed, which contains historical information such as the node position of the workpiece, residual stress, thickness distribution, and node temperature. Based on this file, we can directly add new structural elements, boundary conditions, material models and change the solution types in it. The cooling process is a standard static process, so the cooling analysis based on the implicit algorithm is carried out by utilizing the thermo-mechanical coupling module.
In addition, the interaction between the workpiece and the mold due to thermal contraction during the cooling process is often considered as one of the sources of residual stresses in the workpiece.
44
In order to incorporate this point into the simulation, the molds were modeled as elastomers and an isotropic coefficient of thermal expansion was defined. The laminate is modeled using MAT-23. It is an orthogonal elastic material model, which is usually used to simulate the temperature dependence of mechanical properties in different directions of composite materials and allows for the definition of anisotropic thermal expansion coefficients. The mold surface’s initial temperature and the sheet’s initial temperature are used as the nodal temperatures at the end of the forming stage simulation. As shown in Figure 18, the boundary condition of convective heat dissipation is imposed on the mold surface by *BOUNDARY_CONVECTION, and the heat dissipation between the mold and the workpiece is carried out by thermal contact with the thermal conductivity between the sheet and the mold as shown in Table 5. FE simulation model of cooling stage.
Springback simulation
To simulate the demolding and springback process, it is necessary to map using the dynain method the nodal temperature and stress results of the workpiece obtained in the cooling simulation to the springback simulation model shown in Figure 19. The workpiece’s temperature does not completely drop to room temperature after demolding, so the springback of the workpiece proceeds gradually with the temperature change. To simulate this process, the *BOUNDARY_CONVECTION keyword is used to impose convective heat dissipation boundary conditions on the upper and lower surfaces of the workpiece, and the *LOAD_BODY keyword is used to add gravity boundary conditions. In the static analysis of springback, the rigid body motion degrees of freedom of the plate must be constrained. If no constraints are applied, even a small force applied to the sheet will result in an infinite rigid-body displacement while the stresses remain constant. To eliminate the degrees of freedom of the sheet in all six directions, appropriate constraints must be applied to the sheet. By using the keyword *BOUNDARY_SPC_NODE, it is possible to constrain the sheet at three nodes, which are usually set at the bottom of the formed part, and to ensure that the three points are not in the same straight line to avoid constraint failure. Once the workpiece temperature has dropped to room temperature, the final springback of the hat-shaped beam can be read. FE modeling of the springback stage.
Grid-independent verification
In order to exclude the influence of different mesh sizes on the finite element results, this paper selects 1.0 mm, 1.5 mm, 2 mm, 2.5 mm, and 3.0 mm element sizes for the analysis under the premise that the rest of the molding parameters remain consistent. To comprehensively show and compare the prediction results with the test results, different post-processing detection points were selected for comparison for different prediction objects. Figures 20 and 21 (a-b) show the specific distribution of points used for post-processing. The post-processing results for thickness variation, distribution of inter-fiber shear angle, and corner angle after forming the workpiece are shown in Figure 22. It can be found that the simulation results of thickness gradually converge when simulation at 2.0 mm, 2.5 mm, and 3.0 mm sizes. At the same time, when analyzed with 3 mm elements, the prediction of shear angle deviated significantly. In the springback analysis, both 1.0 mm and 3.0 mm element sizes resulted in relatively large amounts of springback. Also considering the computational time, a 2.5 mm element was used for modeling in the subsequent study. Specific distribution of thickness detection points. (a) Detection points distribution for shear angle post-processing (b) corner numbering after forming the workpiece. Forming results of different element sizes (a) thickness variation (b) shear angle (c) springback angle.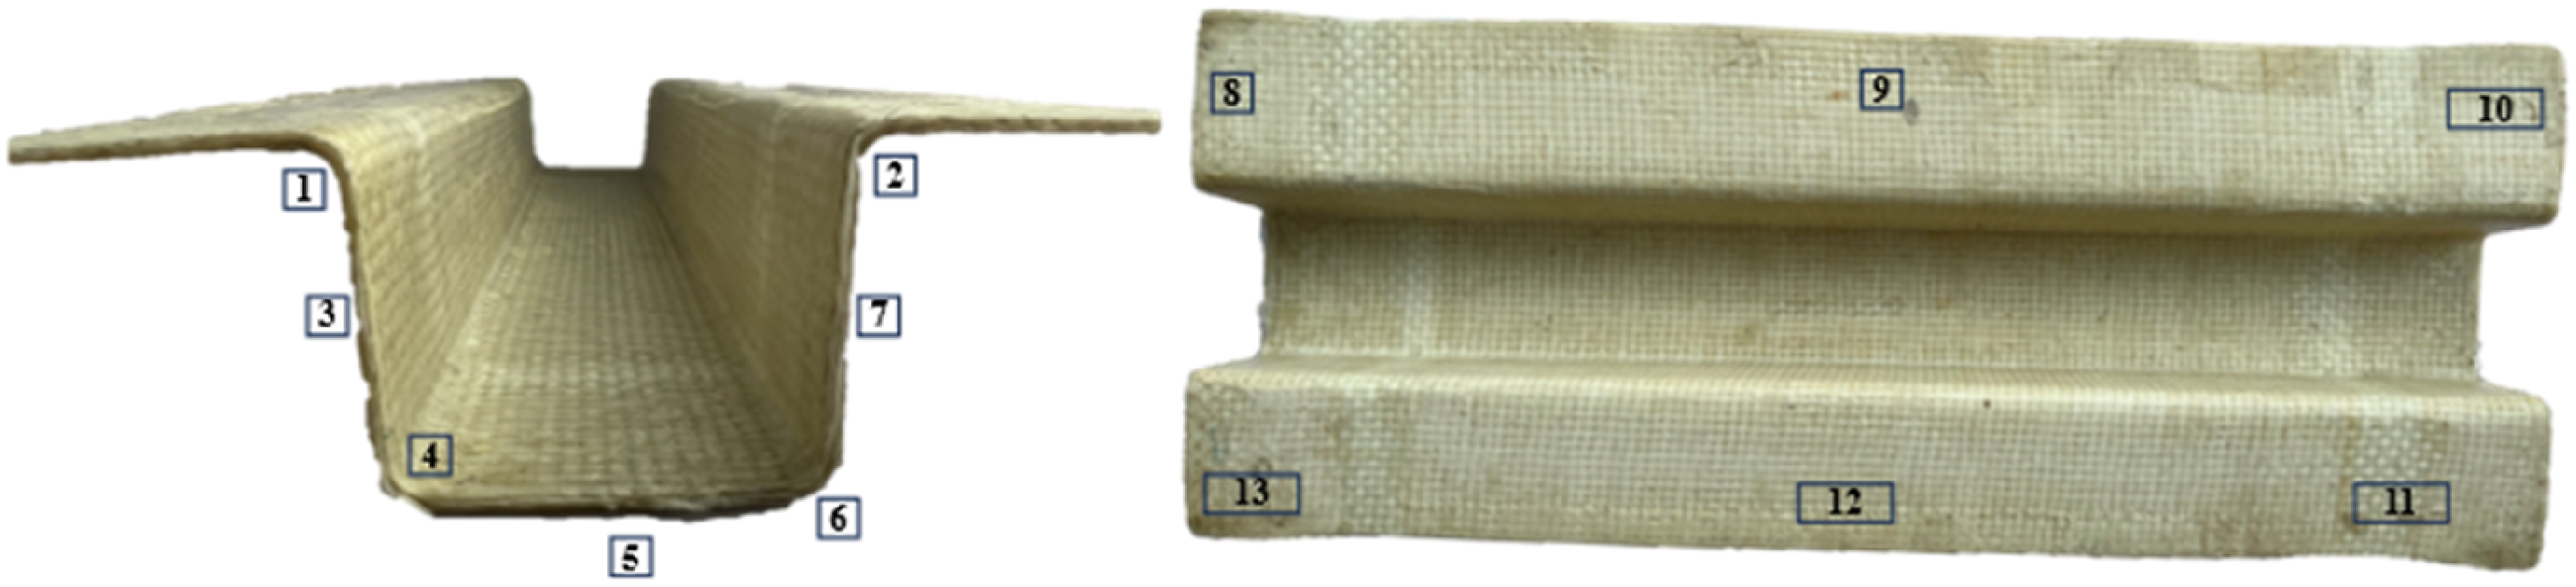


Experimental validation
Forming results validation
The forming results obtained from the test and simulation is shown in Figure 23. Both simulation and experimental results observed the edges of the workpiece show more obvious shear deformation. To further compare the forming and simulation results, an image of the outer contour coordinates of the workpiece was plotted, as shown in Figure 24, which shows a good agreement between the simulation and test results. Comparison of experimental and numerical boundary profiles. Coordinates of the outer contour of the workpiece obtained by experiment and simulation.

The distribution of detection points for the predicted and tested values of workpiece thickness is shown in Figure 20. The experimental and simulated values obtained at different detection points are shown in Figure 25. Table 8 further counts the error values between experimental and simulated values. It can be observed that the maximum error occurs at positions 4 and 6, while the predicted values at other positions are more consistent with the experimental values (Tables 9–11). Comparison of thickness at different detection points obtained from test and simulation. The error between the thickness obtained from the test and the predicted value. The error between the fiber angle obtained from the test and the predicted value. The error between the angle obtained from the test and the predicted value.
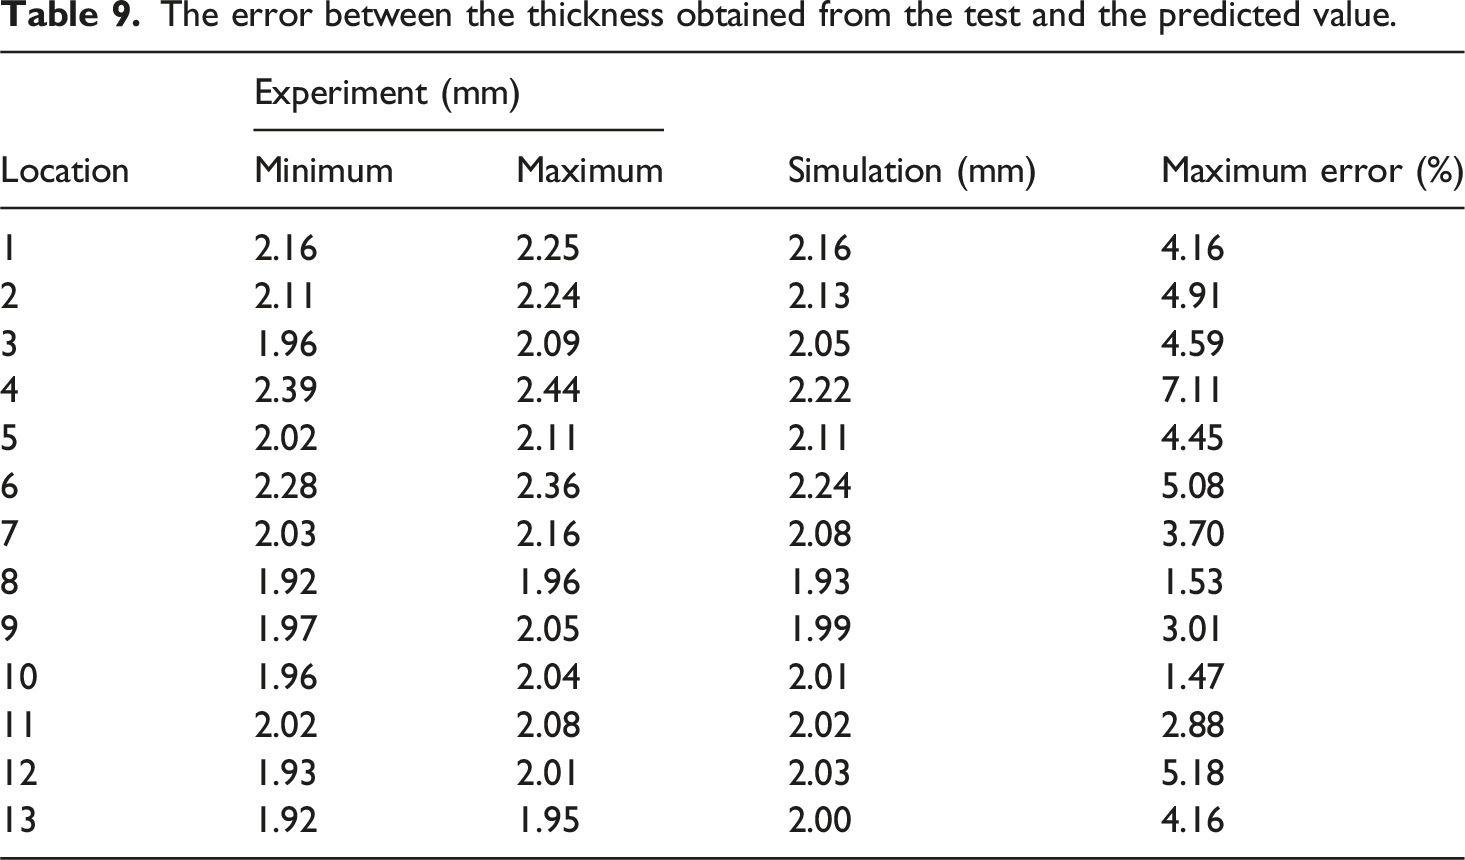


Figure 26 shows the contour plot of the distribution of the inter-fiber shear angle of the hat-shaped beam sample derived from the simulation analysis. The angular distribution of the fibers at nine different locations was counted, and the final results are shown in Figure 27. Point 1, 2, 3, 5, 6, and 9 agree with the simulation results. The larger angular deviations between the experimental and numerical results occur at positions 4, 7, and 8. This may be due to the insufficient binder force on that side during the forming process, and the simulation model may have amplified the effect. Meanwhile, in both the experiment and the FE analysis, the maximum angular change is less than 10°, which is small compared to the shear locking angle (38.6°) shown in Table 6. Significant shear angle variations are usually seen as an indication of wrinkling, so no considerable wrinkling was observed during the simulations and experiments in which the hat-shaped beams were shaped. Contour plot of shear angle distribution obtained from simulation. Comparison between actual fiber angles and predicted values.

As mentioned earlier, a smaller binder force may increase the local shear angle, and more direct evidence is further observed in the undulation at the flange edge for both simulated and experimentally formed parts, as shown in Figure 28. The magnitude of the binder force during the forming process is may closely related to the undulation phenomenon. In-plane undulation phenomena observed in tests and simulations.
Springback results validation
The experimental results of the four angles of the formed hat‐shaped beam workpiece were compared with the FE results to validate the proposed FE process chain. Figure 21(b) shows the numbering of the angular positions to be measured in detail. Figure 29 illustrates the springback contour plot obtained from the simulation Figure 30(a) shows the specific angles of the workpiece after forming, and (b) extracts the cross-sections of the workpiece obtained from simulation and experiments respectively. The experimental results show good consistency with the simulation results. Table 8 further counts the error values between experimental and simulated values. Comparing the simulation results with the FE analysis results, all the predicted values are within the error range except the angle at the second position. Delivering more molding information can effectively improve the springback prediction accuracy compared to the conventional method that only delivers nodal temperature information.
33
The maximum error in springback prediction is reduced from 8.65% in the conventional method to 5.71%. This indicates that the FE simulation procedure proposed in this paper effectively predicts the springback of thermo-stamping CFRTP workpiece. However, the predicted values in this paper are all greater than the average value of the angle of the workpiece obtained from the tests, which may be due to the change in the angle of the fibers of the workpiece during the thermo-stamping process. For the plain weave composites used in this paper, factors such as the tightness of the weave structure and the angle of the fibers affect the coefficient of thermal expansion. The tighter the weave structure, the stronger the mutual constraints between the fibers, and the coefficient of thermal expansion is relatively small; while the change of the angle between the fibers will change the distribution of the fibers in different directions and the force, thus affecting the local mechanical properties and thermal expansion properties of the composites. However, the effect of fiber angle change on the local properties was not incorporated into the finite element analysis in this study. The focus of the next step of research will be to consider these factors in order to improve the accuracy of the simulation. The springback contour plot obtained from the simulation. Statistics of the workpiece angle after demolding (a) workpiece angles obtained by simulation and experiment (b) the simulated values and experimental values of the cross-section of the workpiece.

Conclusion
This study develops an integrated simulation method for the CFRTP thermo-stamping process, integrating thermo-mechanical forming, in-mold cooling, and demolding stages. By transferring forming history information between stages, the method captures the dynamic evolution of residual stress, strain, and deformation behaviors. Experimental validation on CFRTP hat‐shaped beams confirms the model’s accuracy, with simulation errors for fiber shear angel, wrinkling, and springback controlled within 8%.
Constitutive models for different forming stages are established based on material tests, including uniaxial tensile, picture frame shear, and bias extension tests. A thermo-mechanical coupling approach is used to simulate the forming stage, while in-mold cooling and springback models characterize residual stress evolution and post-demolding deformation. The experimental results align closely with simulations, demonstrating the reliability of the proposed method in predicting forming outcomes. However, there is an overestimation of the springback angle compared to the experimental results, which may be an effect of local mechanical property changes due to fiber reorientation and changes in thermal expansion effects, and should be further considered in future work. In addition, the interface parameters, such as friction coefficient and heat transfer coefficient, used in this study are quoted from the existing literature, and the comparison of experimental and simulation results in this paper shows that the quoted parameters can predict the molding results under the current working conditions. Nevertheless, these parameters may have an effect on the prediction results under some more complicated mold structures and boundary conditions. Therefore, relevant experiments need to be designed to accurately characterize the interfacial parameters in subsequent studies.
Compared with the traditional methods, the integrated simulation method proposed in this study, on the one hand, can more comprehensively predict the various defects appearing in the workpiece during the thermo-stamping process. On the other hand, it takes into account more forming history variables in the forming process (temperature, stress, and thickness), compared with the springback prediction that only transmits the temperature variation, the maximum springback prediction error is reduced from 8.65% to 5.71% in this paper.
Footnotes
Ethical consideration
This study did not involve human or animal subjects, and thus, no ethical approval was required. The study protocol adhered to the guidelines established by the journal.
Author Contributions
Funding
The authors disclosed receipt of the following financial support for the research, authorship, and/or publication of this article: The work is supported from Jiangsu Provincial Key Research and Development Program (BE2022053-4) and Natural Science Foundation of Jiangsu Province (Grant Number BK20230530). China Postdoctoral Science Foundation (Grant Number 2024M751166). The work is supported from Science and Technology Planning Project of Zhenjiang City (Grant Number GY2024019).
Declaration of conflicting interests
The authors declared no potential conflicts of interest with respect to the research, authorship, and/or publication of this article.
Data Availability Statement
The raw/processed data required to reproduce these findings cannot be shared at this time due to technical or time limitations.